Controlling Health Care Costs through Limited Network
Insurance Plans: Evidence from Massachusetts State Employees
The MIT Faculty has made this article openly available.
Please share
how this access benefits you. Your story matters.
Citation
Gruber, Jonathan, and Robin McKnight. “Controlling Health Care
Costs through Limited Network Insurance Plans: Evidence from
Massachusetts State Employees†.” American Economic Journal:
Economic Policy 8, no. 2 (May 2016): 219–250. © 2017 American
Economic Association
As Published
http://dx.doi.org/10.1257/pol.20140335
Version
Final published version
Citable link
http://hdl.handle.net/1721.1/110246
Terms of Use
Article is made available in accordance with the publisher's
policy and may be subject to US copyright law. Please refer to the
publisher's site for terms of use.
219
Controlling Health Care Costs through Limited
Network Insurance Plans:
Evidence from Massachusetts State Employees
†By Jonathan Gruber and Robin McKnight*
We investigate the impact of limited network insurance plans in the
context of the Massachusetts Group Insurance Commission (GIC), the
insurance plan for state employees. Our quasi-experimental analysis examines the introduction of a major financial incentive to choose limited network plans that affected a subset of GIC enrollees. We find that enrollees are very price sensitive in their decision to enroll in limited network plans. Those who switched spent almost 40 percent less on medical care. This reflects reductions in the quantity of services and prices paid per service. The spending reductions came from
specialist and hospital care, while spending on primary care rose.
(JEL G22, H75, I11, I13, J45)
A
s employers and governments look to control runaway health care costs, one place they are turning is to limited network plans. Recognizing that the cost of comparable services can vary widely across providers, insurers are offering plans that exclude the highest cost providers and thereby significantly reduce insurance premiums. These plans often do not vary in their enrollee cost sharing or other plan characteristics, relying only on the restriction to lower cost providers to ensure sav-ings. As a result, they have proven to be increasingly popular, and they appear to be a mainstay of the plan offerings on state and federal exchanges under the Affordable Care Act (ACA). In particular, the explicit tying of ACA insurance subsidies for low income families to the (second) lowest cost plan in the area is likely to induce enor-mous movement into limited network plans, which are often the least expensive.But these limited network plans are not without their detractors. Many are con-cerned that individuals will suffer a disruption in care if they switch to a limited
* Gruber: Department of Economics, Massachusetts Institute of Technology (MIT), 50 Memorial Drive, Building E52, Room 355, Cambridge, MA 02142 and the National Bureau for Economic Research (NBER) (e-mail: gru-berj@mit.edu); McKnight: Department of Economics, Wellesley College, 106 Central Street, Wellesley, MA 02481 and the NBER (e-mail: robin.mcknight@wellesley.edu). We are extremely grateful to Dolores Mitchell, Ennio Manto, Catherine Moore, and Diane McKenzie at the Group Insurance Commission (GIC) for their enormous assis-tance in providing the data for this project and to the referees, as well as seminar participants at the Federal Reserve Bank of Boston, Boston University, Brigham Young University, Syracuse University, Tufts University, University of California, Irvine, University of Illinois at Chicago, University of Michigan, University of Pennsylvania, the NBER Conference on the Economics of Health Insurance Exchanges, and NBER Summer Institute for helpful comments. This research was supported by the National Institute on Aging through Grant #P30AG012810 to the National Bureau of Economic Research.
† Go to http://dx.doi.org/10.1257/pol.20140335 to visit the article page for additional materials and author
220 AMErICAn ECOnOMIC JOurnAL: ECOnOMIC POLICy MAy 2016
network plan. This could lead to deterioration in the quality of care where the continuity of care is most valuable, such as for those with chronic illness. Recent expansion in limited and tiered network plans (the latter include a broader network but charge differentials for use of more expensive providers) in Massachusetts, for example, was strongly opposed not only by higher cost providers but also by patient advocacy groups.1 Indeed, this concern prompted tying the ACA
subsi-dies to the second-lowest cost plan in an area, to ensure that patients would not be “forced” into networks which did not include their provider. Despite this, ACA critics have recently focused on the dominance of limited network plans on the new exchanges.2
Assessing the implications for enrollees of limited network plan enrollment is therefore an important issue for evaluating both the future of employer-sponsored insurance (ESI) and the efficacy of the ACA exchanges. Yet there is virtually no work on the implications of enrollment in a limited network plan for enrollee well-being. There is an older and much larger literature on the impacts of managed care plans, which include as one of their key aspects network limitations (e.g., Glied 2000). But this literature was not focused on distinguishing the impacts of network limitations from many of the other differences involved in managing care. There is also a small recent literature on how limited networks impact choice of providers (see Frank et al. 2014, for a review), but this literature does not address the impacts on overall spending and utilization patterns.
To address this issue, we turn to the example of the Massachusetts Group Insurance Commission (GIC), the health insurance provider for state employees, which introduced sizeable new incentives for limited network plans as part of their open enrollment for fiscal year 2012. In particular, the state offered a three-month premium holiday for enrollment in limited network plans by state employees. At the same time, the GIC provides insurance for a number of municipalities, to whom this premium holiday was not extended, providing a natural control group. We have obtained from the GIC a complete set of claims data for the 2009 through 2012 period, which allow us to assess the implications of this sizeable new incentive for enrollment in limited network plans.
We use these data to answer two sets of questions about limited network plans. First, how responsive are individuals to financial incentives to use such plans? We have sizable variation in financial incentives in our data, with the savings from choos-ing a limited network plan rischoos-ing by over $500 per year on average. This allows us to obtain projections for price sensitivity that are highly relevant to employer plans and exchanges. We can also assess which enrollees are most price sensitive. Do financial incentives induce only healthy enrollees to join limited network plans, leading to increased sorting by health across insurers?
1 Weisman and Conaboy (2011).
2 For example, the CEO of Cedars-Sinai Hospital, Thomas Priselac, recently told Time magazine, “We’re
very concerned with the impact [that a smaller network] has on patients” (Pickert 2014). An article on CNN.com described patients who are “dismayed that their current doctors aren’t in the plans or that they can’t go to the ones they think are best for them” (Luhby 2014). Similarly, The Boston Globe quoted patient Nancy Petro, who said “Now I have to drive 50 miles for blood work when there’s a hospital three miles from my house” (Jan. 2014).
We then estimate the implications of limited network enrollment for health care utilization, spending, and outcomes, for those enrollees who do decide to switch. We are particularly interested in assessing the extent to which such switchers change their pattern of physician utilization, and whether this impacts broader health care utilization.
Our findings suggest that switching to a limited network plan is very sensitive to financial incentives; the three month premium holiday offered by the GIC caused 10 percent of enrollees to switch to limited network plans, with an implied elasticity of switching with respect to the premium savings of 1.3. The healthiest individuals are the likeliest to switch, although the differences by health are not large.
We find that incentives to switch to a limited network plan induced a sizeable reduction in spending for the GIC of 4.2 percent, implying that the marginal person induced to switch plans by this incentive spent 36 percent less. There are several potential mechanisms that could generate this spending decline: reduction in the quantities of care received, reduction in the prices paid for care, and the shifting of the site of some care from more expensive to less expensive settings. These mech-anisms are not mutually exclusive and, indeed, we find some evidence for each of them. For example, we find a reduction in specialist visits; we find a reduction in per-visit costs for outpatient care; and we find a reduction in emergency room per-visits that is concentrated in diagnoses that are likely to be treatable in office settings. Thus, we conclude that limited networks reduce costs through a combination of all three mech-anisms. Our analysis suggests that the key plan feature underlying the cost reductions is limited network size, not differences in cost sharing or in managed care status.
Spending falls significantly for most categories of spending. Most importantly, however, there is an increase in primary care physician visits and spending that is more than offset by a decrease in specialist visits and spending. Falls in emergency room and hospital spending suggest that any reduction in physician access through network limitations did not cause an increase in use of tertiary care, and there is no evidence of any deterioration along measures of hospital quality. Distance traveled to providers falls for primary care physicians, but rises for specialists and in partic-ular hospitals; there is, however, no evidence that patients are using lower quality hospitals. There is also no evidence of particularly harmful effects for chronically ill patients. But we do find that the savings are concentrated among those individuals who can retain their primary care physician when moving to a limited network plan, suggesting that limits on primary care access may not be as cost reducing as are downstream limits on other providers. Overall, the findings suggest that the switch to limited network plans reduced spending without harming access to primary care or inducing shifts to more expensive tertiary care.
Our paper proceeds as follows. Section I discusses the related previous literature. Section II describes the GIC policy change. Section III lays out the detailed data made available to us by the GIC, and Section IV describes our empirical strategy for using these rich data to identify the impact of limited network plans. Section V shows the results for plan choice, and Section VI presents the results for utilization responses. Section VII considers impacts on patient access as measured by distance traveled and hospital quality, while Section VIII considers heterogeneity in our find-ings. Section IX concludes.
222 AMErICAn ECOnOMIC JOurnAL: ECOnOMIC POLICy MAy 2016
I. Literature Review
As noted in the introduction, there is little work directly on the impacts of limited networks on patient care. But our paper does relate to some other important areas within health economics.
The first is the literature on the price sensitivity of plan choice in the employer-sponsored insurance (ESI) setting. A number of papers have found that employees are very price sensitive in choosing across ESI plans (e.g., Buchmueller and Feldstein 1997, Cutler and Reber 1998, and Royalty and Solomon 1999). Royalty and Solomon (1999) find price elasticities—where the “price” is defined as the employee’s out-of-pocket premium cost—in the range of −0.4 to −0.8. This prior literature highlights that there are likely to be switching costs, such as those arising from switching doctors, and that these switching costs may be higher for some employees than others. Strombom, Buchmueller, and Feldstein (2002) illustrate that there is significant heterogeneity in price elasticities: new hires and younger /health-ier employees are much more price sensitive than are incumbent employees and older/sicker employees. Our analysis adds to this literature by examining a setting where employees face an explicit trade-off between plan characteristics and premi-ums. Other research has investigated enrollee preferences over plan characteristics; for example, Scanlon et al. (2002) find that enrollees are less likely to enroll in plans with high out-of-pocket costs and poor quality ratings. But there is no work about which we are aware estimating the price sensitivity with respect to network limitations.
A recent paper by Dahl and Forbes (2014) focuses specifically on the introduc-tion for employees in the University of California system of a new opintroduc-tion with lower premiums and a more limited physician network. They find that individuals are will-ing to pay a substantial premium to keep their doctors; they estimate that 35 percent of employees are willing to pay an average of over $100 extra per month to retain their doctors. But they do not investigate the implications for patient outcomes and costs of enrolling in the more limited network plan.
There is a sizeable literature in economics on how insurance plan care manage-ment impacts utilization, as reviewed by Glied (2000). A well-known study in this area is Cutler, McClellan, and Newhouse (2000), which finds that managed care appears to reduce provider prices without fundamentally changing the pattern of patient care, at least for cardiac patients. But this literature does not focus specif-ically on network limitations as opposed to the larger issue of care management. Below we will try to assess the extent to which care management may be driving our results and conclude that, while it may contribute to the cost savings in limited network plans, it is not likely to be the primary cause of the savings that we observe.
Finally, there is a sizeable literature in industrial organization that investigates the negotiations between providers and insurers in establishing networks, as reviewed by Gaynor, Ho, and Town (2014). Of particular relevance are studies by Ho (2006) and Ho and Lee (2013), which estimate as part of the model consumer demand for limited network plans. These articles find substantial valuation of hospital networks in choosing an insurance plan; Ho (2006) estimates an implied value of $15/year/ insured to having full choice of providers. She notes, however, that this valuation
appears small relative to the savings to insurers from provider bargaining that accompany the construction of limited networks. This is consistent with the rapid growth in limited network plans in recent years.
II. The GIC Policy Change
The GIC provides health insurance options for all state employees as well as employees of a number of local municipalities who have chosen to buy into the state plan. At the start of our sample period, the GIC insured 81,420 state employ-ees and 109,343 dependents. In addition, there were 23 municipalities purchasing their insurance through the GIC, with 14,232 employees and 19,160 dependents. Municipalities may find the broader negotiating power of the GIC a more attractive alternative to their local purchasing options, although unions often oppose the higher employee contributions and more limited choices associated with GIC enrollment. As a result of these conflicting interests, about 10 percent of the municipalities in the state were enrolled in the GIC by 2012.3
In fiscal year 2011, the year before the limited network incentive plan began, the GIC offered 11 plan options. These plan options are summarized in Table 1. Of these plans, five were classified as broad network plans (mostly Preferred Provider Organizations (PPOs)) that allowed employees a free choice of provider in the counties in which the plans operated. The other six were categorized as narrow network plans with more limited choice of providers. The cost-sharing features of the broad network and limited network plans are nearly identical, so the only sub-stantive difference across the plans is their network.4 According to information from
GIC insurers, these narrow network plans are established to exclude the most expen-sive providers while still maintaining sufficient coverage of the plan’s service area.
Of course, “narrow network” is a vague term that can have multiple meanings. To provide a richer interpretation of the meaning of a narrow network in the GIC context, we consider empirical measures of network breadth. In particular, we take our full set of data over three years (described further below) and focus on counties in which plans operate. In those counties, we consider all providers for which we observe at least five (or ten) in-network claims over the three-year period across all insurers. We then calculate, for each insurance plan, the proportion of these provid-ers for which we observe at least five (or ten) in-network claims for that particular plan. While this measure undoubtedly incorporates measurement error, it nonethe-less provides some relative information about the breadth of each plan’s network within the counties in which it operates.
3 One reason for less widespread enrollment of municipalities is that enrollment required union agreement to
give up on collective bargaining on benefits.
4 There are minimal differences in cost sharing across plans; most of the variation is across insurers, not across
plan types. For instance, Tufts plans have slightly higher hospital copayments than other plans, but these higher co-payments apply to both their broad network plan (Tufts Navigator) and their limited network plan (Tufts Spirit). As a result, average hospital co-payments in limited network plans are identical to average hospital co-payments in broad network plans. For a specialist (in Tier 1), co-pays range from $20 to $25, with an average of $24.17 in limited network plans and $23.00 in broad network plans. For primary care physicians, co-payments range from $15 to $20, with an average of $17.50 in limited network plans and $18.00 in broad network plans.
224 AMErICAn ECOnOMIC JOurnAL: ECOnOMIC POLICy MAy 2016
The results of this exercise are presented in Table 2. They suggest that limited network plans, on average, have claims from a smaller fraction of the physicians and hospitals in a county than the broad network plans do. Overall, our measures suggest that broad network plans cover nearly twice as many physicians and about 50 percent more hospitals than are covered by narrow network plans. While one of the limited network plans, Health New England, appears to have a relatively broad hospital network, it is worth noting that this plan does not operate in eastern Massachusetts, so its network does exclude many hospitals in the state.5 We have
also calculated these measures separately for primary care physicians and special-ists, and found that the difference in network sizes is somewhat more pronounced for specialists than for primary care physicians. Broad networks include about twice as many specialists as narrow networks do, and about 50 percent more primary care physicians than narrow networks do.
Prior to the premium holiday, there was an existing financial benefit to choos-ing limited network plans, reflectchoos-ing directly the lower cost of those plans to the state. In particular, the state contributed 80 percent of the cost of insurance plans for active employees hired before July 1, 2003 (and 75 percent for those hired after that date), so that a portion of the lower costs of limited network plans were passed on to employees. In 2011, the employee share of the monthly premium for individ-ual coverage ranged from $81.32 for Unicare Community Choice to $153.36 for Unicare Basic (for workers paying 20 percent of the premium cost). Sixteen percent of enrollees at the state level chose to enroll in limited network plans.
The financial incentive to switch to a limited network plan varied significantly across employees, for several reasons. First, there were different contribution rules
5 We have confirmed the results in Table 2 by using data from insurers where available. We have compared the
lists of in-network hospitals for limited network plans and found that the results are similar to those that we report in Table 2. For example, Health New England includes 92.3 percent of hospitals in the claims-based measure and 100 percent of the hospitals in the list-based measure. Likewise, Tufts Spirit includes 32.9 percent of hospitals in the claims-based measure and 25.7 percent in the list-based measure. For physicians, we entered data on all in-network physicians for two limited network plans, Harvard Primary Choice and Health New England. For both plans, we found that for 25 percent of physicians we did not have enough claims to classify them in our claims data; for the remaining 75 percent of physicians, 60 percent (Harvard) or 68 percent (Health New England) were classified as limited in both our data and the insurers’ lists, an “effective” match rate of 80–90 percent.
Table 1—Details of 2010 GIC Plan Options
Plan name in June 2010Enrollment Type of plan network planLimited
Fallon Community Health Plan Direct Care 1 percent HMO Yes
Fallon Community Health Plan Select Care 3 percent HMO No
Harvard Pilgrim Independence Plan 26 percent PPO No
Harvard Pilgrim Primary Choice Plan 0 percent HMO Yes
Health New England 6 percent HMO Yes
Neighborhood Health Plan 1 percent HMO Yes
Tufts Health Plan Navigator 31 percent PPO No
Tufts Health Plan Spirit 0 percent EPO Yes
Unicare State Indemnity Plan Basic 17 percent Indemnity No
Unicare State Indemnity Plan Community Choice 6 percent PPO-type Yes
for the local municipalities. For example, while Saugus required that employees contribute only 10 percent towards most plans, Swampscott required that employees contribute 35 percent towards most plans. Second, within municipalities, different contribution rules apply to different types of employees. For instance, teachers face different rates than other employees in some municipalities. Third, the state charges different rates to employees with different hiring dates, as described above. Finally, some municipalities provided more generous coverage of lower-cost insurance options. For example, Springfield required that employees contribute 25 percent towards Unicare Basic, but only 15 percent towards other plans. These differences in contribution rules generate meaningful differences in the incentive to switch to a limited network plan. For example, the savings from switching from family cov-erage through Tufts Navigator (a broad network plan) to family coverage through Tufts Spirit (a limited network plan) ranged from $29 per month in the three munic-ipalities that required a 10 percent employee contribution for both plans, to $160 per month in a municipality that required a 7 percent higher employee contribution for Tufts Navigator than for Tufts Spirit.
For the fiscal year 2012 open enrollment, the GIC decided to add an extra incen-tive for state employees to enroll in limited network plans.6 In particular, state
employees who decided to enroll in limited network plans were offered a one-time, three month “premium holiday,” with no employee contribution required for the first
6 At the same time the state imposed mandatory re-enrollment in GIC plans, with an automatic default to limited
network plans if individuals didn’t re-enroll. But re-enrollment rates were over 99 percent, so this didn’t end up having a very large impact (Commonwealth of Massachusetts Group Insurance Commission 2012).
Table 2—Measures of Network Breadth
Physician Hospital
>5 claims >10 claims > 5 claims >10 claims Average across all plans
Broad 0.250 0.212 0.776 0.710
Narrow 0.135 0.107 0.541 0.419
Harvard Pilgrim
Broad: Independence 0.367 0.315 0.963 0.901
Narrow: Primary Choice 0.110 0.077 0.570 0.418
Tufts Broad: Navigator 0.351 0.312 0.827 0.815 Narrow: Spirit 0.054 0.034 0.329 0.158 Unicare Broad: Basic 0.263 0.220 0.926 0.864 Broad: Plus 0.199 0.160 0.802 0.728
Narrow: Community Choice 0.166 0.128 0.650 0.563
Fallon
Broad: Select 0.069 0.052 0.360 0.240
Narrow: Direct 0.066 0.051 0.400 0.200
Other narrow
Health New England 0.353 0.313 0.923 0.923
Neighborhood Health Plan 0.059 0.041 0.373 0.253
note: This table shows the proportion of providers located in the counties where the insurance plan operates for whom we observe at least five (or ten) in-network claims.
226 AMErICAn ECOnOMIC JOurnAL: ECOnOMIC POLICy MAy 2016
three months of the year. For the affected plans, this premium holiday amounted to a 25 percent reduction in contributions, ranging from total savings of $268 over the three-month period for individual coverage from Unicare Community Choice for state employees hired before July 2003 to $956 for family coverage from Harvard Pilgrim Primary Choice for more recently hired state employees. This incentive was not offered by localities which use the GIC system. This policy change induced a major differential incentive for limited network plans for state versus municipal employees.7
III. Data
Our data for this analysis include a complete set of claims and enrollment records for all GIC enrollees for the three fiscal years, spanning the period from July 2009 through June 2012. GIC’s insurance contracts run from July through June, so these data allow us to observe three fiscal years. The premium holiday affects fiscal year 2012, which runs from July 2011 to June 2012.
For the purposes of our analysis, we limit the sample to active employees and their dependents who were continuously enrolled over the three years of our sample period. The restriction to continuously enrolled individuals ensures that the com-position of our sample does not change over time. However, this sample restriction precludes the inclusion of eight municipalities that joined GIC during our sample period. Because we cannot identify which employees are teachers, we exclude data from a municipality that has different contribution rates for teachers than for other employees. The resulting sample includes data on 159,732 enrollees, of whom 86 percent obtained coverage through the state and 14 percent obtained coverage through one of 21 municipalities in our sample.
Our (de-identified) data include very limited demographic information such as age and gender, information on enrollment choices, and information on health care utilization and spending over this time period. In the claims data, we identify dif-ferent types of services and construct annual measures of utilization. Our measures include counts of medical encounters in a year (e.g., office visits, prescription drug purchases, etc.) and total expenditures by all payers for those medical services. While it is possible that out-of-network providers choose not to file claims with the limited network insurers, we do observe claims that indicate that the provider is out-of-network, including some claims for which the insurer pays nothing. While we can’t rule out the possibility that we are missing some claims from out-of-network providers, any missing claims are likely to be for low-cost events and would there-fore have minimal effect on our overall findings. Overall, our data indicate that there is a small amount of out-of-network use, with out-of-network spending accounting for only 6 percent of total non-prescription drug spending on average. With three years of claims data for each enrollee, our final dataset includes 479,196 annual observations on the 159,732 continuously enrolled individuals in our sample.
7 According to the GIC administrator, the premium holiday structure was chosen because it was easier to
admin-ister than a year-long deduction; it would reduce problems of dealing with new hires during the year; and because it might be more salient than a broader premium reduction.
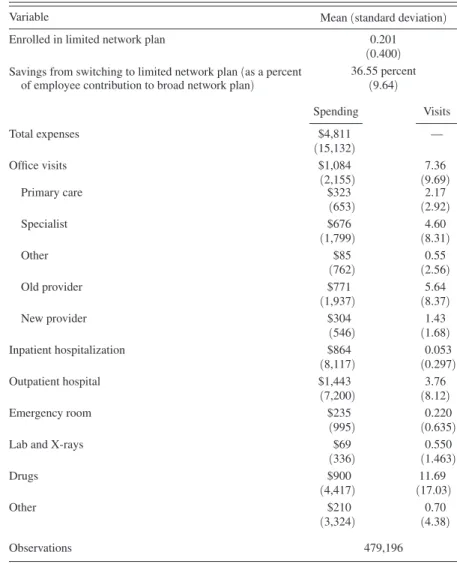
Table 3 provides summary statistics on our sample, including information on average annual medical expenditures and utilization. The average member incurs $4,811 in total medical expenses during a year. About 23 percent of these expenses are incurred in office visits, 18 percent in inpatient hospitalizations, and 30 percent in outpatient visits. Prescription drugs account for 19 percent of the costs. The remain-der of the costs includes emergency department visits, labs, and “other” costs, which include home health care, supplies, ambulances, and a variety of other services.
IV. Empirical Strategy
Following the discussion of the GIC policy change above, there are several sources of variation in the cost of limited and broad network plans. At any point in time, there is significant variation across state versus municipal workers, as well as across state workers by date of hire. Over time, as premiums change, these
Table 3—Summary Statistics
(means and standard deviations calculated for full sample period )
Variable Mean (standard deviation)
Enrolled in limited network plan 0.201
(0.400) Savings from switching to limited network plan (as a percent 36.55 percent of employee contribution to broad network plan) (9.64)
Spending Visits Total expenses $4,811 — (15,132) Office visits $1,084 7.36 (2,155) (9.69) Primary care $323 2.17 (653) (2.92) Specialist $676 4.60 (1,799) (8.31) Other $85 0.55 (762) (2.56) Old provider $771 5.64 (1,937) (8.37) New provider $304 1.43 (546) (1.68) Inpatient hospitalization $864 0.053 (8,117) (0.297) Outpatient hospital $1,443 3.76 (7,200) (8.12) Emergency room $235 0.220 (995) (0.635)
Lab and X-rays $69 0.550
(336) (1.463) Drugs $900 11.69 (4,417) (17.03) Other $210 0.70 (3,324) (4.38) Observations 479,196
228 AMErICAn ECOnOMIC JOurnAL: ECOnOMIC POLICy MAy 2016
differences in policy give rise to differential changes in the out-of-pocket premium cost of limited network plans. And the premium holiday in fiscal year 2012 created a sharp discontinuity in the cost of limited network plans for state employees relative to local employees.
As a result, we pursue two identification strategies in our analysis. The first is a difference-in-differences analysis around the 2012 policy change, comparing state to municipal employees over time. This is a legitimate identification strategy if there are no preexisting differential trends between these two groups, and if there is no contemporaneous shock to one of these two groups.
To carry out this strategy, we estimate regressions of the form: (1) y imt = α + βSTAT E m × AFTE r t + γ MUN I m
+ τYEA R t + δ X imt + ε imt ,
where i indexes individuals, m indexes municipalities (and state), and t indexes years. STATE is a dummy for obtaining coverage through a state employee, and
AFTEr is a dummy for fiscal year 2012. MUNI represents a full set of fixed effects
for municipality, and YEAR represents a full set of year fixed effects. X is a set of individual controls which includes age, gender, family coverage tier (individual or family), and an indicator for state employees who were hired before July 1, 2003. The coefficient β captures the impact of benefiting from the premium holiday, rela-tive to earlier state workers, and compared to the change over the same time period for municipal workers. Standard errors are clustered at the level of the municipality.
The second identification strategy incorporates the broader price variation that arises from the differential out-of-pocket premium cost of limited network plans across employee types and over time. The advantage of using this approach is that it provides more power to identify the effect of incentives to move to a limited network plan. The disadvantage is that there could be potential endogeneity from several sources in this broader variation. For example, the share that the state and municipalities require their employees to pay for health insurance could be related to underlying insurance demand, or date of employee hire could be correlated with individual insurance demand.
We address these concerns through our second empirical specification: (2) y imt = α + βLIMSA V mt + γ MUN I m + τYEA R t
+ δ X imt + ε imt ,
where LIMSAV is the savings from switching to a limited network plan for worker i. This measure is computed as the difference in the weighted average of employee contributions to broad network plans and the weighted average of employee contributions to limited network plans, measured as a percentage of the employee contributions to broad network plans. The weights represent the fraction of enrollees in each type of plan who chose each specific plan in a base period, so that more weight is placed on the employee contributions to the more popular plans.
Because we weight the employee contributions by baseline enrollment shares, the calculation excludes information about Harvard Primary Choice and Tufts Spirit, which were added as new insurance plan choices in fiscal year 2011. The use of a weighted average across all of the insurance plan options means that this measure does not vary across individuals within a municipality-year. Instead, this measure reflects the sources of variation that were outlined above, including variation across the state and municipalities, across hire date groups (i.e., groups facing the same premium-sharing rules), and over time. The use of a percentage difference in sav-ings means that we are not using variation in the level of savsav-ings that arises from differences in premiums across individual and family plans; the dollar value of sav-ings from switching to a limited network plan is always higher for family plans than the dollar value of savings for individual plans, but the percentage savings is always the same.
To address the potential endogeniety of LIMSAV, we include fixed effects for each municipality and controls for the hiring period for state employees to capture those correlates of insurance demand. In practice, since the most significant varia-tion in our sample comes from the premium holiday, our results are similar using either method.
It is very important to be clear on the interpretation of the key coefficient β. Our estimates of the implications of limited network plans for utilization and out-comes are identified solely by the compliers that switch plans in response to finan-cial incentives. That is, our estimates are not a population average estimate of the impact of forcing all enrollees to enroll in a limited network plan. But current policy conversations center around employee and exchange choice, which consider limited network plans as a choice option, not the mandated default. That is, our estimates provide the relevant estimates of the impacts of offering financial incentives of the range described above on utilization and outcomes.
V. Enrollee Plan Choice Results
We begin by examining the effects of financial incentives on the decisions of individuals to enroll in limited network plans. We estimate equations (1) and (2) using as a dependent variable a dummy for enrolling in a limited network plan. We estimate all models as linear probability models, although our results are very sim-ilar if we use probits.
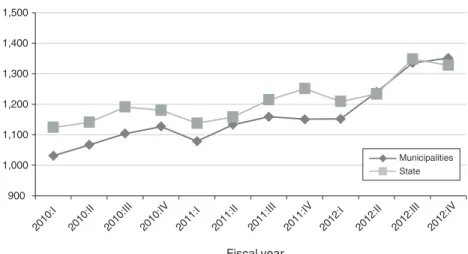
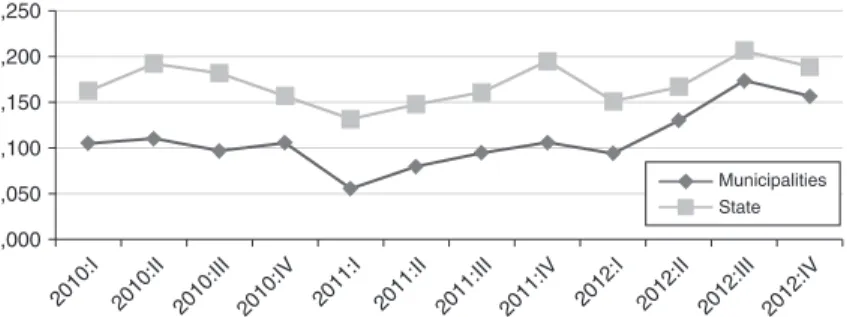
Figure 1 previews our first stage findings. Panel A graphs the savings from choos-ing a limited network plan by year, separately for municipalities and the state. As the figure shows, municipal employees in 2010 faced larger potential savings from switching to a limited network plan, because the employee share of the premiums was typically higher for them than for state employees. Because limited network plans have lower premiums than broad network plans, a higher employee share of premiums generates more potential savings from choosing a limited network plan. From 2010 to 2011, there was an increase in savings in both groups from choosing a limited network plan. This increase in savings was partially attributable to the fact that broad network plans had relatively large increases in premiums, whereas several of the limited network plans had premium increases that were close to zero.
230 AMErICAn ECOnOMIC JOurnAL: ECOnOMIC POLICy MAy 2016
In addition, increases in the employee share of premiums were implemented by the state and by several municipalities.8 From 2011 to 2012, there was a large rise in
the savings from limited network plans for state employees, due to the premium holiday, that was not present for municipal employees.
Panel B of Figure 1 shows enrollment rates in limited network plans over time for the state and municipalities. The initial rate of enrollment is higher in municipal-ities, which is consistent with the higher initial municipality discount for enrolling in such plans. From 2010 to 2011, enrollment in limited network plans rises in both groups by similar magnitudes, once again consistent with the parallel rise in finan-cial incentives over these years. From 2011 to 2012, enrollment in limited network plans in the municipalities is fairly constant, whereas there is an enormous jump
8 Under the FY10 Appropriation Act, premium contribution rates for state employees increased by 5
percent-age points. These changes were first proposed in June 2009 and implemented in August 2009 (Commonwealth of Massachusetts Group Insurance Commission 2011). Thus, while the price change was implemented partway through fiscal year 2010, the primary impact on enrollment choices should have occurred during open enrollment for fiscal year 2011.
Panel A. The monthly savings from switching to a limited network, as a percentage of average broad network premium contribution
20 25 30 35 40 45 50 55 2010 2011 2012 P er ce nt Fiscal year Fiscal year
Monthly savings from switching
Panel B. Enrollment in limited network plans, as a percentage of total enrollment
0 5 10 15 20 25 30 35 2010 2011 2012 P er ce nt
Enrollment in limited network plans
Municipalities State
Municipalities State
in the state plans, mirroring the increase in potential savings for state employees. For state employees, enrollment in limited network plans rises by about 50 percent between 2011 and 2012.
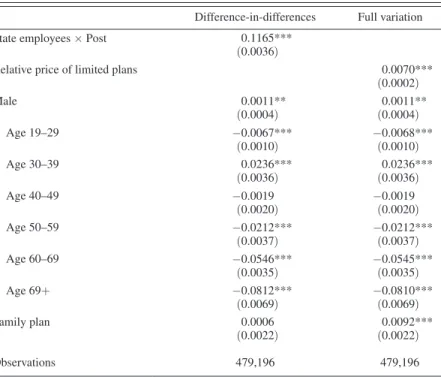
Table 4 presents these “first stage” results in regression form, confirming what is shown in the figures. We estimate that the premium holiday raised enrollment in limited network plans in the state by over 11 percentage points, relative to the municipalities. Our alternative regression approach, using the full variation over this period, yields an estimate that each 1 percentage point increase in the discount to limited network plans gives rise to a 0.7 percentage point increase in the share of enrollees in limited network plans. The discount rose by 16 percentage points from 2011 to 2012 as a result of the premium holiday, which would predict the same 11 percentage point rise in limited network enrollment. The estimated elas-ticity of limited network enrollment with respect to its premium discount is 1.28 (or 0.007 × (36.55/0.201)).
Table 4 also shows the coefficients on many of the covariates included in these first stage regressions. The coefficients suggest that males are slightly more likely to choose limited network plans than females are. Enrollment in limited network plans peaks between the ages of 30 and 39, and decreases considerably as adults age.
Table 4—First Stage Regressions
Difference-in-differences Full variation
State employees × Post 0.1165***
(0.0036)
Relative price of limited plans 0.0070***
(0.0002) Male 0.0011** (0.0004) (0.0004)0.0011** Age 19–29 −0.0067*** (0.0010) −0.0068***(0.0010) Age 30–39 0.0236*** (0.0036) (0.0036)0.0236*** Age 40–49 −0.0019 (0.0020) −0.0019(0.0020) Age 50–59 −0.0212*** (0.0037) −0.0212***(0.0037) Age 60–69 −0.0546*** (0.0035) −0.0545***(0.0035) Age 69+ −0.0812*** (0.0069) −0.0810***(0.0069) Family plan 0.0006 (0.0022) (0.0022)0.0092*** Observations 479,196 479,196
notes: Each column shows coefficients (and standard errors) from a single OLS regression. Other control variables include a full set of municipality and year fixed effects and controls for date of hire. The omitted age category is <19 years old. Standard errors are clustered on munic-ipality. The sample includes all continuously enrolled active employees over the three-year period from fiscal year 2010 to fiscal year 2012; the unit of observation is a person-year.
*** Significant at the 1 percent level. ** Significant at the 5 percent level. * Significant at the 10 percent level.
232 AMErICAn ECOnOMIC JOurnAL: ECOnOMIC POLICy MAy 2016
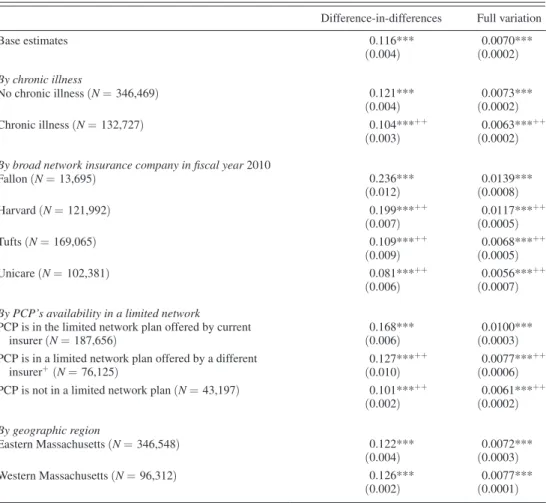
Table 5 explores heterogeneity in price sensitivity, in each case showing the key coefficients from the same specification shown in Table 4, but estimated on only the subsample of interest. We first consider heterogeneity by underlying health, divid-ing the population into those who are and are not chronically ill. We identify the chronically ill as individuals with a diagnosis (in an office setting) of hypertension, high cholesterol, diabetes, asthma, arthritis, affective disorders, and gastritis, fol-lowing Goldman et al. (2004). We find that healthier enrollees are more price sen-sitive: those who are not chronically ill are about 20 percent more responsive than
Table 5—Heterogeneity in First Stage
Difference-in-differences Full variation
Base estimates 0.116*** (0.004) (0.0002)0.0070*** By chronic illness No chronic illness (n = 346,469) 0.121*** (0.004) (0.0002)0.0073*** Chronic illness (n = 132,727) 0.104***++ (0.003) 0.0063*** ++ (0.0002) By broad network insurance company in fiscal year 2010
Fallon (n = 13,695) 0.236*** (0.012) (0.0008)0.0139*** Harvard (n = 121,992) 0.199***++ (0.007) 0.0117*** ++ (0.0005) Tufts (n = 169,065) 0.109***++ (0.009) 0.0068*** ++ (0.0005) Unicare (n = 102,381) 0.081***++ (0.006) 0.0056*** ++ (0.0007) By PCP’s availability in a limited network
PCP is in the limited network plan offered by current
insurer (n = 187,656) (0.006)0.168*** (0.0003)0.0100***
PCP is in a limited network plan offered by a different
insurer+ (n = 76,125) 0.127***
++
(0.010) 0.0077***
++
(0.0006) PCP is not in a limited network plan (n = 43,197) 0.101***++
(0.002) 0.0061*** ++ (0.0002) By geographic region Eastern Massachusetts (n = 346,548) 0.122*** (0.004) (0.0003)0.0072*** Western Massachusetts (n = 96,312) 0.126*** (0.002) (0.0001)0.0077*** notes: Each cell shows the coefficient (and standard error) from a single regression. In the first column, the coeffi-cient is on the interaction between “state employee” and post; in the second column, the coefficoeffi-cient is on the relative price of limited network plans. Each row shows results for a different subsample. Control variables include gender, age group, enrollment in a family plan, date of hire, and a full set of municipality and year fixed effects. Coefficients are estimated using OLS. Standard errors are clustered on municipality.
*** Significant at the 1 percent level. ** Significant at the 5 percent level. * Significant at the 10 percent level.
+ Results for a given subsample are statistically significantly different at the 10 percent level from the first
subsample in the group.
++ Results for a given subsample are statistically significantly different at the 5 percent level from the first
those who are chronically ill.9 This suggests that, when the GIC offered financial
incentives for enrollment in limited network plans, they improved the health mix of those plans and worsened the health mix of those remaining in broad network plans, although the differential effect is not large.
We next explore heterogeneity by initial choice of insurer, limiting our sample to those who were enrolled in broad network plans at the beginning of our sam-ple period. In general, enrollees who switch to a limited network plan tend to stay with the same insurer that ran their broad network plan. Overall, 68 percent of new enrollees in limited network plans in fiscal year 2012 chose the same insurer that they had used for their broad network plan. Thus, the characteristics of the limited network plan offered by an enrollee’s broad network insurer may particularly influ-ence his or her decision to enroll in a limited network plan. We see that there is some heterogeneity in switching by insurer. The first stage is largest for Fallon enrollees, and smallest for Unicare enrollees. While it is true that the first stage is relatively small for Tufts, which also has the largest gap in network sizes across broad and narrow network plans, there does not appear to be a systematic correlation between the first stages across companies and the “restrictiveness” of their limited network plans. A more systematic relationship exists between the strength of the first stage and the demographic characteristics of the enrollees, with the youngest and healthi-est enrollees in the plan with the larghealthi-est first stage (Fallon) and the oldest and most chronically ill enrollees in the plan with the smallest first stage (Unicare). So the heterogeneity in the results by insurer in the second panel of Table 5 is consistent with some positive selection into narrow networks.
Two key determinants of switching could be whether individuals can remain with their insurer, and whether they can keep their doctor. We explore these issues in the next panel of Table 5. For 79 percent of the enrollees in our sample, we can identify their primary care physician based on claims during the first two years of our sample. We identify the primary care physician as the physician with a primary care specialty with whom the enrollee had the most office visits during the first two years of our sample period. We then consider three mutually exclusive groups, among those enrollees who were not yet enrolled in a limited network plan in fiscal year 2011: those whose primary care physician is in the limited network version of the same insurance plan in which they are now enrolled; those whose primary care physician is in a limited network plan, but not that offered by their current insurer; or those whose primary care physician is not available through any limited network plan. We expect enrollment in a limited network plan to be declining across these groups, and indeed that is the case.
The results in Table 5 show that the coefficient on switching (that is identified primarily by the premium holiday) is declining across these groups.10 The effect
9 The relatively small differential in the first stage between chronically and not chronically ill enrollees may
partly reflect the fact that healthier enrollees were more likely to have enrolled in limited networks prior to the premium holiday, so that there was less potential for switching in response to the premium holiday. In fiscal year 2011, 15.1 percent of chronically ill state enrollees were in limited network plans, as compared to 16.6 percent of non-chronically ill state enrollees.
10 Of course, these results suffer from some censoring bias—those whose physician is in a limited network plan
may have been most likely to switch before the premium holiday. This would most likely lead us to understate the impact of the financial incentive differential across groups.
234 AMErICAn ECOnOMIC JOurnAL: ECOnOMIC POLICy MAy 2016
for those who can switch without changing insurer or physician is about 60 per-cent larger than for those who must switch both insurer and physician. As with the results by insurer, it is important to note that there are differences in observable characteristics across these subsamples: the enrollees who must switch both insurer and physician are three to five years older on average than the other subsamples and had higher spending and hospitalization rates in fiscal year 2010. These results should therefore be interpreted with caution, as the heterogeneity could reflect PCP network participation or underlying patient characteristics. To the extent that they reflect PCP network participation, they are consistent with Dahl and Forbes’ (2014) findings that individuals value the ability to keep their doctors.
It is interesting to note that over 90 percent of these enrollees have a primary care physician who participated in at least one limited network plan. This suggests that switching to a limited network plan does not necessarily disrupt primary care rela-tionships for many enrollees.
Finally, we examined geographic heterogeneity in our first stage. Narrow net-works appear to be substantially more restrictive in eastern Massachusetts than in western Massachusetts.11 Based on measures of the physician network breadth
based on five in-network claims, akin to the first column of Table 2, we find that, in eastern Massachusetts, narrow networks included 9.4 percent of providers while broad networks included 25.6 percent of providers. In western Massachusetts, nar-row networks included 17.3 percent of providers while broad networks included 23.5 percent of providers. In spite of these regional differences in the restrictiveness of the narrow networks, our results in the bottom panel of Table 5 suggest that there was not a statistically significant difference in the first stage across these regions.
VI. Results for Utilization and Spending
Having established our “first stage” fact that financial incentives for limited net-work plans strongly influence choice of such plans, we now turn to estimating the impact on patient outcomes. The regression framework is the same as that used in the previous section, but our dependent variables now relate to health care utilization and outcomes.
These regression coefficients can be interpreted as “reduced form” estimates of the impact of financial incentives on patient outcomes. If we normalize by the “first stage” estimates of the impact of financial incentives on plan choice, we can obtain an implicit instrumental variables estimate of the effect of enrolling in a limited network plan on outcomes. As noted earlier, this IV estimate is valid only for the marginal individuals induced to switch plans by financial incentives, and not for individuals randomly enrolled in a limited network plan.
Since our dependent variables feature both many zeros and a large degree of skewness, we estimate our models by a general linear model (GLM). In the absence of zeros, we would want to use ln(spending) as our dependent variable and estimate our models using OLS. However, the presence of observations with zero spending
11 In this analysis, western Massachusetts includes Berkshire, Franklin, Hampshire, and Hampden counties, and
makes this a problematic strategy, so we follow the literature and estimate GLM with a log-link function (Buntin and Zaslavsky 2004). In this approach, the condi-tional mean is modeled as:
(3) ln E(Spending | X ) imt = α + βLIMSA V mt + γ MUN I m
+ τYEA R t + δ X imt + ε imt .
This approach allows us to avoid selection on the dependent variable and also generates coefficients that are interpretable as percentage changes.12
A. Total Impact on Spending
We preview the results for total spending with Figure 2, which shows the trends in total spending for state and municipal employees. For this figure, we use quarterly data on total spending, in order to show more precisely the timing of any changes in total spending. This figure shows that spending trends very closely for state and municipal employees over time before the premium holiday, with state employees having consistently higher total spending (once again consistent with higher enroll-ment in limited network plans by municipal employees). There is then a very clear relative decline in total spending for state employees, which begins in the first quar-ter of fiscal year 2012 and becomes even stronger in subsequent quarquar-ters. The fact that the spending patterns for state employees, as compared to municipal employees, mirror the patterns of enrollment in limited network plans seen in Figure 1 is quite suggestive of a causal link.
In Table 6, we formalize this analysis using our regression framework. There are two columns in the table, representing our two identification strategies: the differ-ence-in-differences strategy is used in the first column, while the price variation strategy is used in the second column. In each cell, we present the GLM estimate of the effect on a spending measure. If one wishes to interpret these as structural esti-mates for the impact of being enrolled in a limited network plan then, as noted above the difference-in-differences estimates should be multiplied by 1/0.116 = 8.6, and the price variation estimates should be multiplied by 1/0.0070 = 143.
We begin in the first row by modeling total spending. We estimate a marginally significant 4 percent decline in the level of medical spending. Normalizing by the “first stage” effect, this implies that, for the marginal switcher, there is a 36 percent decline in total spending when moving to a limited network plan. This is a very sizeable impact. On the other hand, the magnitude of the decline is quite consistent with the difference in total premiums for the two types of plans. Indeed, the mean reduction in out-of-pocket premium for an enrollee to switch from an average broad network plan to an average limited network plan in our sample was 36.55 percent,
12 In contrast to GLM, OLS models E(ln Spending | X )
imt = α + βLIMSA V imt + γ MUN I m + τYEA R t +
δ X imt + ε imt . As a result, OLS generates coefficients that are difficult to translate into statements about E(Spending). The traditional solution has been to use a “smearing” estimator to convert predictions to the unlogged scale (Manning et al. 1987). However, these retransformations are biased in the presence of heteroskedasticity (Manning and Mullahy 2001, Buntin and Zaslavsky 2004).
236 AMErICAn ECOnOMIC JOurnAL: ECOnOMIC POLICy MAy 2016 900 1,000 1,100 1,200 1,300 1,400 1,500 2010 :I 2010 :II 2010 :III 2010 :IV 2011 :I 2011 :II 2011 :III 2011 :IV 2012 :I 2012 :II 2012 :III 2012 :IV Fiscal year Total spending per capita
Municipalities State
Figure 2. Total Quarterly Spending per Capita
Table 6—Basic Spending Results
Difference-in-differences Full variation
Total spending −0.042* (0.022) −0.0029**(0.0013) Office visits −0.018* (0.010) −0.0012*(0.0006) Inpatient hospitalization −0.056 (0.071) −0.0048(0.0043) Outpatient hospital −0.050* (0.025) −0.0033**(0.0015) Emergency room −0.095* (0.055) −0.0054*(0.0032)
Lab and X-ray −0.083*
(0.049) −0.0047(0.0029) Drugs 0.003 (0.017) (0.0011)0.0003 Other −0.111** (0.054) −0.0074**(0.0036) Observations 479,196 479,196
notes: Each cell shows coefficients (and standard errors) from a single regression. In the first column, the coefficient is on the interaction between “state employee” and post; in the second column, the coefficient is on the relative price of limited network plans. Each row shows results for spending on a different type of service. Control variables include gender, age group, enroll-ment in a family plan, date of hire, and a full set of municipality and year fixed effects. The sample includes all continuously enrolled active employees over the three-year period from fiscal year 2010 to fiscal year 2012; the unit of observation is a person-year. Coefficients are estimated using GLM. Standard errors are clustered on municipality.
*** Significant at the 1 percent level. ** Significant at the 5 percent level. * Significant at the 10 percent level.
as shown in Table 3. Our results suggest that the premium differential for limited net-work plans is driven not merely by positive selection, but by a substantive difference in costs per capita.13 The results using full variation, when normalized by the relevant
first stage results, generate very similar results: for the marginal switcher, there is a 41 percent decline in total spending. The fact that our two identification strategies gen-erate such similar results here, and throughout the subsequent results, is reassuring.
Given the increased scope for out-of-network use in limited network plans, we also examined the impact of the premium holiday on (non-prescription drug) spending by network status. Using our difference-in-differences specification, we find a statisti-cally significant 5.4 percent decline in in-network (nondrug) spending and a statis-tically insignificant 1.8 percent decline in out-of-network spending. Thus, it appears that enrollees responded to limited network plans by shifting their utilization towards in-network providers, as opposed to increasing their out-of-network utilization.
We then turn to modeling spending by subcategory of medical utilization. We find a large (albeit only marginally significant) decline in office spending, with the difference-in-differences estimate implying a roughly 16 percent decline in office spending for the marginal switcher. We estimate a reduction in hospital spending which is also very large, but statistically insignificant. Unfortunately, the confidence intervals for our inpatient hospital spending results are fairly wide, leaving us unable to rule out a large fall or rise in hospital spending.
We do, however, find a large and marginally significant 5 percent decline in out-patient hospital spending in the difference-in-differences specification, implying a 43 percent reduction in outpatient spending for the marginal switcher. Results for outpatient spending are similar in magnitude, and statistically significant, in the specification that uses the full price variation. We see an even larger reduction in lab spending of 8 percent in the difference-in-differences specification, implying a 71 percent reduction in lab spending for the marginal switcher. We have further explored the lab results and found that lab spending associated with office visits doesn’t fall significantly; rather, the major change is in lab spending associated with outpatient and emergency room settings.
We find a correspondingly large reduction in emergency room spending. This is striking because it defies the natural hypothesis that, when individuals have their physician choices limited, they may tend to use more emergency room care. We have further broken emergency room visits by type of visit, and find that about two-thirds of the reduction is from reduced use of the emergency department for treatment of injuries. We have also examined the decline in emergency room visits by diagnosis, categorized by the relative frequency that a given diagnosis is treated in the emergency room, as opposed to an office visit setting, in broad network plans in the baseline period. We found that the decline in emergency room visits
13 A simple regression of spending on limited network plan enrollment, ignoring the endogeneity of limited
net-work enrollment, yields a cost savings estimate of 30 percent. It is surprising that the causal impact on spending is larger than the OLS effect, given that the latter includes selection effects. This partly reflects relatively limited selec-tion: the average age of those enrolled is only three years younger than those not enrolled, and the odds of chronic illness is only about 10 percent lower. This may also partly reflect differences between the marginal complier with the policy change and the average enrollee in limited network plans, or differences in the long run effect of enroll-ment versus first year effects. Nevertheless, the results suggest that most of the savings from limited network plans is from reduced spending by enrollees, not just positive selection.
238 AMErICAn ECOnOMIC JOurnAL: ECOnOMIC POLICy MAy 2016
is concentrated among diagnoses that are treated in an emergency room less than 50 percent of the time. In other words, the decline appears to be coming from mar-ginal visits that could plausibly be treated in other settings. This suggests that one mechanism by which limited networks reduce spending is by shifting the site of care for some diagnoses away from the emergency department and presumably towards less expensive settings.
We find no meaningful impact on prescription drug spending, but a large impact on “other” spending. When we break down “other” spending into its constituent com-ponents, the results imply that there are particularly large reductions in home health care spending and ambulance spending, although neither is significant on its own. It is worth noting that “other” spending constitutes less than 5 percent of total spending, so declines in this category of spending, while larger in percentage terms, are relatively unimportant in explaining the aggregate decline in spending. Rather, if one takes the point estimates seriously, the changes that appear to be most important in driving the 4.2 percent decline in total spending include the 5.0 percent decline in outpatient spending and the (statistically insignificant) 5.6 percent decline in inpatient spending, which together account for more than half of the overall decline in total spending.
Given the robustness of our findings to the two empirical strategies used in Table 6, for the remainder of the paper we present only the more easily interpretable difference-in-differences results. All results presented below are, not surprisingly, consistent using the fuller measure of incentives.
B. Decomposing Spending Impacts
The large impacts on total spending that are apparent in Figure 2 can be further decomposed to assess whether the savings arise from a reduced quantity of care or lower prices paid for a fixed amount of care. We show the results of this decomposition in Figure 3. In panel A, we show the changes in costs per service type, weighted by fixed quantities of care for each service. These fixed quantities are based on average utilization for each service category (primary care office visits, specialist office visits, other office visits, inpatient care, outpatient care, ER visits, labs, prescription drugs, and other care) for broad network enrollees in fiscal year 2010. Costs per service are allowed to vary, on average, over time and across state versus municipal enrollees. Interestingly, average costs per service are similar for state and municipal enrollees at the beginning of the sample period, with costs for state enrollees, if anything, lower than costs for municipal enrollees in fiscal year 2011. But costs per service seem to decline relatively more for state enrollees after the premium holiday, especially towards the end of fiscal year 2012. This figure suggests that the decline in spending among state enrollees is partially attributable to a relative decline in per service costs.
Panel B of Figure 3 shows the changes in quantities of each type of service, weighted by fixed costs of care. The fixed costs are based on average per service allowable costs for each type of service for broad network enrollees in fiscal year 2010, while quantities are allowed to vary over time and across state versus munic-ipal enrollees. State enrollees were clearly using a greater amount of care than municipal enrollees in fiscal year 2010 and fiscal year 2011, but the magnitude of the gap declines visibly beginning at the time of the premium holiday. Based on
VOL. 8 nO. 2 gruber and mcknight: limited network insurance plans 239
these figures, it appears that declines in prices and quantities both play a role in reducing spending for state enrollees after the premium holiday.
Table 7 examines this issue, in a regression framework, for different categories of service. It extends Table 6 by presenting, in addition to our GLM spending results, results for measures of quantity of care and for costs per visit. Specifically, it shows OLS results for a dummy variable for any utilization of that type of service, for num-ber of instances of utilization (visits, stays, tests, drug prescriptions, etc.), and for average cost per instance of utilization (conditional on some utilization). The results shown here are all similar if we use Probit models for the “any visits” outcome, or if we use Poisson count models for the number of visits outcome.
We find that there is no change in the odds of having an office visit, but that the number of visits falls significantly, by 0.15 off a base of 7.36 visits on average. There is no effect on per-visit cost. For inpatient utilization, we once again do not find any results of statistical significance. The point estimates, however, are more consis-tent with a decline in costs per visit than with a decline in inpatient hospital visits. For outpatient utilization, we find a reduction in the odds of any outpatient visit, in the number of visits, and in the cost per visit. For emergency room utilization, there are reductions in all measures, but the only significant change is a reduction in the number of visits. For labs, we find a reduction in both the level of lab results and the cost per result, which produces the significant total drop in spending. The
Panel A. Quantities fixed at 2010 broad network level, prices varying
Panel B. Quantities varying, prices fixed at 2010 broad network level 1,100 1,150 1,200 1,250 1,300 1,350 1,400 1,450
2010:I 2010:II 2010:III 2010:IV 2011:I 2011:II 2011:III 2011:IV 2012:I 2012:II 2012:III 2012:IV
2010:I 2010:II 2010:III 2010:IV 2011:I 2011:II 2011:III 2011:IV 2012:I 2012:II 2012:III 2012:IV
1,000 1,050 1,100 1,150 1,200 1,250 Municipalities State Municipalities State
240 AMErICAn ECOnOMIC JOurnAL: ECOnOMIC POLICy MAy 2016
results for prescription drug utilization are interesting. As noted earlier, there is no net impact on prescription drug spending. But this appears to reflect a significant reduction in the number of prescriptions (a reduction of 0.4 prescriptions on a base of 11.7 prescriptions), offset by a large (although not significant) rise in the cost per prescription (a rise of $2.08 off a base of $77). We also see a large and statistically significant decline in the quantity of “other” care.
Overall, the results are consistent with the visual impression from the two panels of Figure 3, which suggested that the reduced spending is attributable to reductions in both quantity and price. The results in Table 7 indicate that the premium holiday is associated with declines in the quantity of care across all categories of service, with statistically significant effects on office visits, emergency room visits, prescrip-tion drugs, and other visits. The results indicate that premium holiday is also associ-ated with declines in the per-visit cost for every category of care, except prescription drugs, with statistically significant results for outpatient visits.
C. Type of Physician
The results for physician office utilization suggest the potential value of a further decomposition by type of physician. Table 8 follows the same format as Table 7, but further decomposes the results for office visits by type of provider.
Table 7—Broader Measures of Utilization for DD Model Total spending
(GLM) Any visits(OLS) Number of visits(OLS) Cost per visit(OLS)
Office visits −0.018* (0.010) (0.0026)0.0001 −0.154*(0.083) −0.127(2.087) Inpatient hospitalization −0.056 (0.071) −0.0005(0.0020) −0.0006(0.0027) −861.59(845.44) Outpatient hospital −0.050* (0.025) −0.0086(0.0053) −0.103(0.071) −20.00*(11.51) Emergency room −0.095* (0.055) (0.0029)0.0026 −0.0090*(0.0046) −67.24(42.15)
Lab and X-ray −0.083*
(0.049) −0.0019(0.0073) −0.036(0.022) −4.60(4.05) Drugs 0.003 (0.017) (0.0042)0.0039 −0.386***(0.113) (1.82)2.08 Other −0.111** (0.054) −0.034***(0.010) −0.075***(0.027) (21.45)−4.19 Observations 479,196 479,196 479,196 Varies
notes: Each cell shows the coefficient (and standard error) on the interaction between “state employee” and “post” from a single difference-in-differences regression. Each row shows results for a different service; each column shows a different measure of utilization for that service. Control variables include gender, age group, enrollment in a family plan, date of hire, and a full set of municipality and year fixed effects. The sample includes all contin-uously enrolled active employees over the three-year period from fiscal year 2010 to fiscal year 2012; the unit of observation is a person-year. Coefficients in the first column are estimated using GLM; results in the other columns are estimated using OLS. Standard errors are clustered on municipality.
*** Significant at the 1 percent level. ** Significant at the 5 percent level. * Significant at the 10 percent level.