All-flavor search for a diffuse flux of cosmic
neutrinos with 9 years of ANTARES data
A. Albert1, M. Andr´e2, M. Anghinolfi3, G. Anton4, M. Ardid5, J.-J. Aubert6, J. Aublin7, T. Avgitas7, B. Baret7, J. Barrios-Mart´ı8,
S. Basa9, B. Belhorma10, V. Bertin6, S. Biagi11, R. Bormuth12,13,
S. Bourret7, M.C. Bouwhuis12, H. Brˆanza¸s14, R. Bruijn12,15,
J. Brunner6, J. Busto6, A. Capone16,17, L. Caramete14, J. Carr6,
S. Celli16,17,19, R. Cherkaoui El Moursli20, T. Chiarusi21, M. Circella22,
J.A.B. Coelho7, A. Coleiro7,8, R. Coniglione11, H. Costantini6,
P. Coyle6, A. Creusot7, A. F. D´ıaz23, A. Deschamps24, G. De Bonis16,
C. Distefano11, I. Di Palma16,17, A. Domi3,25, C. Donzaud7,26,
D. Dornic6, D. Drouhin1, T. Eberl4, I. El Bojaddaini27, N. El
Khayati20, D. Els¨asser28, A. Enzenh¨ofer6, A. Ettahiri20, F. Fassi20, I. Felis5, L.A. Fusco21,29, P. Gay7,30, V. Giordano31, H. Glotin32,33,
T. Gr´egoire7, R. Gracia Ruiz7,34, K. Graf4, S. Hallmann4, H. van Haren35, A.J. Heijboer12, Y. Hello24, J.J. Hern´andez-Rey8, J. H¨oßl4, J. Hofest¨adt4, G. Illuminati8, C.W. James4, M. de Jong12,13,
M. Jongen12, M. Kadler28, O. Kalekin4, U. Katz4, D. Kießling4,
A. Kouchner7,33, M. Kreter28, I. Kreykenbohm36, V. Kulikovskiy6,37,
C. Lachaud7, R. Lahmann4, D. Lef`evre38, E. Leonora11,31, M. Lotze8,
S. Loucatos7,39, M. Marcelin9, A. Margiotta21,29, A. Marinelli40,41,
J.A. Mart´ınez-Mora5, R. Mele42,43, K. Melis12,15, T. Michael12,
P. Migliozzi42, A. Moussa27, S. Navas44, E. Nezri9, M. Organokov34,
G.E. P˘av˘ala¸s14, C. Pellegrino21,29, C. Perrina16,17, P. Piattelli11,
V. Popa14, T. Pradier34, L. Quinn6, C. Racca1, G. Riccobene11,
A. S´anchez-Losa22, M. Salda˜na5, I. Salvadori6, D.F.E. Samtleben12,13, M. Sanguineti3,25, P. Sapienza11, F. Sch¨ussler39, C. Sieger4, M. Spurio21,29, Th. Stolarczyk39, M. Taiuti3,25, Y. Tayalati20,
A. Trovato11, D. Turpin6, C. T¨onnis8, B. Vallage7,39,
V. Van Elewyck7,33, F. Versari21,29, D. Vivolo42,42, A. Vizzoca16,17,
J. Wilms28, J.D. Zornoza8, and J. Z´u˜niga8
1GRPHE - Universit´e de Haute Alsace - Institut universitaire de technologie de Colmar, 34 rue du Grillenbreit BP 50568 - 68008 Colmar, France
2Technical University of Catalonia, Laboratory of Applied Bioacoustics, Rambla Exposici´o,
08800 Vilanova i la Geltr´u, Barcelona, Spain
3INFN - Sezione di Genova, Via Dodecaneso 33, 16146 Genova, Italy
4Friedrich-Alexander-Universit¨at Erlangen-N¨urnberg, Erlangen Centre for Astroparticle Physics,
Erwin-Rommel-Str. 1, 91058 Erlangen, Germany
5Institut d’Investigaci´o per a la Gesti´o Integrada de les Zones Costaneres (IGIC) - Universitat
Polit`ecnica de Val`encia. C/ Paranimf 1, 46730 Gandia, Spain
6Aix Marseille Univ, CNRS/IN2P3, CPPM, Marseille, France
7APC, Univ Paris Diderot, CNRS/IN2P3, CEA/Irfu, Obs de Paris, Sorbonne Paris Cit´e, France 8IFIC - Instituto de F´ısica Corpuscular (CSIC - Universitat de Val`encia) c/ Catedr´atico Jos´e
Beltr´an, 2 E-46980 Paterna, Valencia, Spain
9LAM - Laboratoire d’Astrophysique de Marseille, Pˆole de l’ ´Etoile Site de Chˆateau-Gombert,
rue Fr´ed´eric Joliot-Curie 38, 13388 Marseille Cedex 13, France
10National Center for Energy Sciences and Nuclear Techniques, B.P.1382, R. P.10001 Rabat,
Morocco
11INFN - Laboratori Nazionali del Sud (LNS), Via S. Sofia 62, 95123 Catania, Italy 12Nikhef, Science Park, Amsterdam, The Netherlands
13Huygens-Kamerlingh Onnes Laboratorium, Universiteit Leiden, The Netherlands 14Institute of Space Science, RO-077125 Bucharest, M˘agurele, Romania
15Universiteit van Amsterdam, Instituut voor Hoge-Energie Fysica, Science Park 105, 1098 XG
Amsterdam, The Netherlands
16INFN - Sezione di Roma, P.le Aldo Moro 2, 00185 Roma, Italy
17Dipartimento di Fisica dell’Universit`a La Sapienza, P.le Aldo Moro 2, 00185 Roma, Italy 19Gran Sasso Science Institute, Viale Francesco Crispi 7, 00167 L’Aquila, Italy 20University Mohammed V in Rabat, Faculty of Sciences, 4 av. Ibn Battouta, B.P. 1014, R.P.
10000
21INFN - Sezione di Bologna, Viale Berti-Pichat 6/2, 40127 Bologna, Italy 22INFN - Sezione di Bari, Via E. Orabona 4, 70126 Bari, Italy
23Department of Computer Architecture and Technology/CITIC, University of Granada, 18071
Granada, Spain
24G´eoazur, UCA, CNRS, IRD, Observatoire de la Cˆote d’Azur, Sophia Antipolis, France 25Dipartimento di Fisica dell’Universit`a, Via Dodecaneso 33, 16146 Genova, Italy
26Universit´e Paris-Sud, 91405 Orsay Cedex, France
27University Mohammed I, Laboratory of Physics of Matter and Radiations, B.P.717, Oujda
6000, Morocco
28Institut f¨ur Theoretische Physik und Astrophysik, Universit¨at W¨urzburg, Emil-Fischer Str.
31, 97074 W¨urzburg, Germany
29Dipartimento di Fisica e Astronomia dell’Universit`a, Viale Berti Pichat 6/2, 40127 Bologna,
Italy
30Laboratoire de Physique Corpusculaire, Clermont Universit´e, Universit´e Blaise Pascal,
CNRS/IN2P3, BP 10448, F-63000 Clermont-Ferrand, France
31INFN - Sezione di Catania, Viale Andrea Doria 6, 95125 Catania, Italy 32LSIS, Aix Marseille Universit´e CNRS ENSAM LSIS UMR 7296 13397 Marseille, France;
Universit´e de Toulon CNRS LSIS UMR 7296, 83957 La Garde, France
33Institut Universitaire de France, 75005 Paris, France
34Universit´e de Strasbourg, CNRS, IPHC UMR 7178, F-67000 Strasbourg, France 35Royal Netherlands Institute for Sea Research (NIOZ) and Utrecht University, Landsdiep 4,
1797 SZ ’t Horntje (Texel), the Netherlands
36Dr. Remeis-Sternwarte and ECAP, Friedrich-Alexander-Universit¨at Erlangen-N¨urnberg,
Sternwartstr. 7, 96049 Bamberg, Germany
37Moscow State University, Skobeltsyn Institute of Nuclear Physics, Leninskie gory, 119991
Moscow, Russia
38Mediterranean Institute of Oceanography (MIO), Aix-Marseille University, 13288, Marseille,
Cedex 9, France; Universit´e du Sud Toulon-Var, CNRS-INSU/IRD UM 110, 83957, La Garde Cedex, France
l’Univers - Service de Physique des Particules, CEA Saclay, 91191 Gif-sur-Yvette Cedex, France
40INFN - Sezione di Pisa, Largo B. Pontecorvo 3, 56127 Pisa, Italy 41Dipartimento di Fisica dell’Universit`a, Largo B. Pontecorvo 3, 56127 Pisa, Italy
42INFN - Sezione di Napoli, Via Cintia 80126 Napoli, Italy
43Dipartimento di Fisica dell’Universit`a Federico II di Napoli, Via Cintia 80126, Napoli, Italy 44Dpto. de F´ısica Te´orica y del Cosmos & C.A.F.P.E., University of Granada, 18071 Granada,
Spain
November 21, 2017
Abstract
The ANTARES detector is at present the most sensitive neutrino telescope in the Northern Hemisphere. The highly significant cosmic neutrino excess observed by the Antarctic IceCube detector can be studied with ANTARES, exploiting its complementing field of view, exposure, and lower energy threshold. Searches for an all-flavor dif-fuse neutrino signal, covering 9 years of ANTARES data taking, are presented in this letter. Upward-going events are used to reduce the atmospheric muon background. This work includes for the first time in ANTARES both track-like (mainly νµ) and shower-like (mainly
νe) events in this kind of analysis. Track-like events allow for an
increase of the effective volume of the detector thanks to the long path traveled by muons in rock and/or sea water. Shower-like events are well reconstructed only when the neutrino interaction vertex is close to, or inside, the instrumented volume. A mild excess of high-energy events over the expected background is observed in 9 years of ANTARES data in both samples. The best fit for a single power-law cosmic neutrino spectrum, in terms of per-flavor flux at 100 TeV, is Φ1f0 (100 TeV) = (1.7 ± 1.0) ×10−18GeV−1cm−2s−1sr−1with spectral index Γ = 2.4+0.5−0.4. The null cosmic flux assumption is rejected with a significance of 1.6σ.
Introduction - A diffuse flux of cosmic neutrinos – here, and in the rest of this paper, the world neutrino refers to both ν and ¯ν – might originate from the ensemble of unresolved sources, too faint to be individually detected, and/or from the interactions of high-energy Cosmic Rays (CRs) as they propagate over cosmic distances. CRs can produce neutrinos when they inelastically interact on nucleons or photons. In the first case, the so-called pp reaction, a large amount of secondaries is produced, including also short-lived mesons decaying into neutrinos [1]; the second case is described by photo-production processes, where the pγ reaction produces a ∆-resonance which gives pions. Neutrinos and γ-rays originate in the decay chain of these
mesons [2]. High energy photons, however, can interact with thermal protons and photons. These processes, in turn, create photons of lower energies, distorting the original γ-ray spectrum. Neutrinos are weakly interacting particles and consequently do not suffer from significant absorption processes due to the presence of matter and radiation fields. Thus, their spectral energy distribution is not degraded.
The observation of a diffuse flux of cosmic neutrinos, i.e. the measure-ment of its spectrum and flavor composition, would provide information on the CR production, acceleration and interaction properties. Neutrinos should follow the energy spectrum of their parent CRs, ∝ E−Γ with Γ ∼ 2 according to the diffusive shock acceleration mechanism [3]. Under the as-sumption that neutrinos are produced in charged meson decays, their flux at the source has a flavor composition as νe : νµ : ντ = 1 : 2 : 0. Vacuum
oscillations over cosmic distances produce equipartition in the three flavors at Earth.
Searches for a diffuse flux of cosmic neutrinos by the IceCube collab-oration have yielded the observation of an excess of events over the ex-pected atmospheric background [4, 5, 6]. The measured flux can be mod-eled with a single power law dNν/dEν = Φ0Eν−Γ. Assuming an isotropic
astrophysical neutrino flux at Earth in flavor equipartition, the best-fit spectral index is Γ = 2.50 ± 0.09 and the normalization at 100 TeV is Φ3f0 (100 TeV) = 6.7+1.1−1.2× 10⁻¹⁸GeV−1cm−2s−1sr−1 for an all-flavor flux (3f ) [5]. The measurement of muon neutrinos coming only from the North-ern Hemisphere yields a best-fit single-flavor flux Φ1f0 (100 TeV) = 9.0+3.0−2.7× 10⁻¹⁹GeV−1cm−2s−1sr−1 and Γ = 2.13 ± 0.13 [6]. The latter is sensitive to neutrinos of energies larger than 100 TeV because of the more abundant atmospheric background, while the former, all-flavor searches, have lower energy thresholds. The tension between the two measurements could hint at multiple cosmic contributions to the IceCube signal [7].
The ANTARES telescope [8] can provide valuable information on the study of this signal, especially in the case of the presence of a Galactic con-tribution. Because of its lower energy threshold, ANTARES can constrain such a contribution, which is expected to be more intense at lower energies with respect to extragalactic signals. This applies both for point-like sources [9] and for extended emission regions [10, 11]. Past searches for a diffuse flux of cosmic neutrinos with ANTARES data were below the sensitivity for detecting a signal at the level of the flux observed by IceCube [12, 13, 14]. The analysis presented in this letter is based on improved reconstruction techniques and, for the first time, on an all-flavor search. The livetime of
the analyzed data sample is also largely extended with respect to previous analyses.
Detector and data sample - The ANTARES underwater neutrino tele-scope [8] is located 40 km off-shore Toulon, France, in the Mediterranean Sea (42◦ 480 N, 6◦ 100 E). It consists of a three-dimensional array of 10-inch photomultiplier tubes (PMTs) distributed along 12, 450 m long, vertical lines, anchored to the sea-bed at a depth of about 2500 m and kept taut by a top buoy.
Neutrino detection is based on the observation of Cherenkov light in-duced in the medium by relativistic charged particles. Cherenkov photons can produce signals in the PMTs (“hits”). The position, time and collected charge of the hits are used to infer the direction and energy of the incident neutrino. Triggers based on combinations of local coincidences are applied to discard events produced by environmental light emitters like inorganic
40K decays and organic bioluminescence [15].
Charged Current (CC) interactions of muon neutrinos produce a track signature in the detector. For these events, a median angular resolution as low as 0.4◦ is achieved [9]. All-flavor Neutral Current (NC) as well as νeand
ντ CC interactions produce electromagnetic and hadronic showers with an
almost point-like emission of Cherenkov photons. These events are recon-structed when the neutrino interacts close to, or inside, the instrumented volume [16] with a median angular resolution of the order of 3◦ and a rela-tive energy resolution as low as 10% in the case of CC νeinteractions above
some tens of TeV.
Data collected from 2007 to 2015 are considered, corresponding to an equivalent livetime of 2450 days. In order to avoid biases in the optimization of the event selection, the analysis follows a blind policy, according to which all cuts are optimized on Monte Carlo only, with 10% of the data used to check the agreement with simulations. Since the data acquisition conditions in the deep sea are variable, the simulation of the apparatus follows the data-taking conditions [17].
Search method - The search strategy follows a two-step procedure. First, an event selection chain is defined to overcome the large background of at-mospheric muons. Second, since the cosmic signal has a harder energy spec-trum and becomes more intense than the atmospheric one at high energies, an energy-related selection maximizes the sensitivity of the search. Thus, the Model Rejection Factor (MRF) procedure [18] based on the Feldman and Cousins upper limit estimation [19] is applied.
An isotropic flux over the whole sky is assumed for cosmic neutrinos, equally distributed into the three neutrino flavors and between ν and ¯ν, and
with single power law energy spectrum. Two possible spectral indexes are considered for the optimization of the event selection: Γ = 2.0 and Γ = 2.5. The most abundant background comes from penetrating atmospheric muons reaching the apparatus. The MUPAGE simulation code [20, 21] is used to produce samples of atmospheric muon bundles deep underwater. The Earth can be used as a shield to reduce the influence of these muons, by discarding events that are reconstructed as downward-going. Nonetheless, a certain amount of atmospheric muon events could still be mis-reconstructed as upward-going. A selection based on the event reconstruction quality parameters (see below) allows for a significant reduction of their amount.
Atmospheric neutrinos are produced together with muons and cannot be shielded by the Earth. Two spectral components contribute to the total atmospheric neutrino flux, namely the conventional and the prompt compo-nent. The former comes from neutrinos produced in the decays of pions and kaons; the latter originates from the decays of charmed hadrons. Charmed hadrons are much shorter-lived than pions and kaons and they almost imme-diately decay, producing a harder neutrino energy spectrum. In this work, the conventional component is described according to the calculations in Ref. [22], while the prompt component follows the prescription of Ref. [23]. Different assumptions in the description of atmospheric neutrino fluxes are accounted for as systematic effects.
Track-like events are reconstructed through a multi-step procedure based on likelihood fits [9] using hits registered by the PMTs. The discrimina-tion between downward-going atmospheric muons and high-energy neutrino induced events is accomplished by applying, a priori, a cut on the recon-structed zenith angle (θtrack > 90◦). Neutrino induced events are then selected against wrongly reconstructed muons, keeping events with low an-gular error estimate and good track quality parameter [24]. An energy-related variable such as the number of hits used in the track reconstruction is considered as well to reduce the number of background events. The re-sulting atmospheric neutrino rate in the track channel is about 1 event/day, with a contamination from atmospheric muons below the percent level in this sample.
Since the energy cannot be directly measured in the case of CC νµ
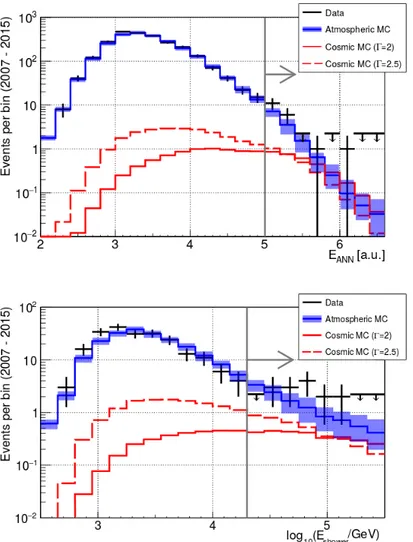
track-like events, a proxy for the event energy must be used. An algorithm based on Artificial Neural Networks [25] is used for this purpose. Figure 1 (top) shows the energy estimator distribution for the selected neutrino sample. The vertical line and arrow show the optimal selection cut obtained with the MRF procedure. Above the cut value EAN N > 5, a total of 13.5 background
neutrino events are expected, and about 3 – 3.5 events should be produced by an IceCube-like signal. This depends on the spectral index and flux normalization resulting from the different best-fit values described above.
The event selection chain described in Ref. [16] is used in this work to obtain a high-purity sample of shower-like events. No explicit veto on atmo-spheric events is applied; events reconstructed up to 10◦ above the horizon are considered and events entering into the final track-like sample are ex-cluded. The muon-rejecting procedure leaves about 8×10⁻³ atmospheric muons per day in the sample. The resulting atmospheric neutrino rate in the shower channel is 0.1 events/day. However, the rejection of atmo-spheric muon events is more difficult at the highest energies, where the con-tamination is larger. The final selection is obtained after rejecting events with reconstructed shower energy below 20 TeV. This value arises from the MRF optimization to obtain the best sensitivity to the IceCube cosmic neu-trino signal flux. The reconstructed shower energy distribution is shown in Fig. 1 (bottom). After the energy-related selection, 10.5 background events (6.5 neutrinos and 4 atmospheric muons) are expected. Assuming a cosmic flux proportional to E−2 (E−2.5) with normalization Φ1f0 (100 TeV) = 10−18 (1.5×10⁻¹⁸) GeV−1cm−2s−1sr−1, compatible with the flux measured in Ref. [5, 6], 3 (3.5) signal events are expected.
Results - The unblinding of the two samples yields a total of 33 events (19 tracks and 14 showers), as shown in Fig. 1. The expectation from Monte Carlo simulations for the background is 24 events (13.5 tracks and 10.5 showers), with an estimated uncertainty of ±7 events. The uncertainties related to the atmospheric neutrino fluxes, to the detector efficiency and to the water properties have been accounted for. A ±25% uncertainty on the normalization of the conventional atmospheric neutrino component is considered [26]; the highest and lowest predictions from the computations of Ref. [23] have been used as uncertainty on the prompt component. It should be noted that IceCube measurements strongly constrain the predictions of prompt neutrino fluxes [6]. The effect of the H3a [27] model of the CR energy spectrum and composition around the knee is also considered.
Uncertainties on the background due to wrongly reconstructed atmo-spheric muons are taken into account, allowing for changes in the normal-ization by ±40% [28]. The effect is negligible in the track channel, because of the low contamination in this sample, but represents around 50% of the total uncertainty on the background for shower-like events.
Finally, the effect of the uncertainty on the detector response on sig-nal and background is evaluated by varying input parameters in the Monte
Figure 1: Distribution of the energy estimator for track-like (top panel) and shower-like (bottom panel) events, after the event selection chain. The solid (dashed) red histogram shows the cosmic neutrino expectation for a cosmic flux proportional to E−2 (E−2.5) with normalization Φ1f0 (100 TeV) = 10−18 (1.5×10⁻¹⁸) GeV−1cm−2s−1sr−1. The blue line represents the sum of all atmospheric events, scaled up to match the fitted atmospheric contribution as described in the text. All the uncertainties related to this evaluation, taken into account as described in the text, are depicted as a shaded area. The gray line represents the energy-related cut. Data after unblinding are shown as black crosses. For empty bins, upper limits are indicated by a horizontal bar with an arrow beneath.
Γ = 2.0 Γ = 2.5 Φ1f, 90%Sens.0 (100 TeV) 1.2 × 10⁻¹⁸ 2.0 × 10⁻¹⁸ Φ1f, 90%U.L.0 (100 TeV) 4.0 × 10⁻¹⁸ 6.8 × 10⁻¹⁸ Φ1f, 68%C.I.0 (100 TeV) 0.29 − 2.9 × 10⁻¹⁸ 0.5 − 5.0 × 10⁻¹⁸
Table 1: Sensitivity and unblinded results from counting statistics. The one-flavor 90% confidence level sensitivity Φ1f, 90%Sens.0 and upper limit Φ1f, 90%U.L.0 flux normalization factors at 100 TeV are reported, as well as the 68% confidence interval Φ1f, 68%C.I.0 , under the assumption of a cosmic spectrum proportional to E−2 or E−2.5. Systematic effects are included into these estimations. Fluxes are shown in units of GeV−1cm−2s−1sr−1.
Carlo simulations. Water properties and the efficiency of the optical mod-ules are varied according to the known uncertainties on the values used for the simulation. The corresponding effect is around 20% at high energies and induces a change of shape in the energy estimation, accounted for in the fit-ting procedure presented below. The overall uncertainty on the background coming from all the effects mentioned above is of the order of ±4 events for each sample. Uncertainties coming from independent sources are added in quadrature in the overall estimation, while correlated uncertainties are summed-up linearly.
Once these effects are taken into account, the observation can be trans-lated into a 68% confidence interval (C.I.) and a 90% confidence level (C.L.) upper limit (U.L.) according to the method of Ref. [29]. The results are re-ported in Table 1, together with the sensitivity of the analysis as estimated from the MRF procedure. These limits and sensitivities are valid in the energy range 40 TeV – 7 PeV (30 TeV – 1.5 PeV) for spectral index Γ = 2.0 (2.5), where 90% of the combined track and shower signal is expected. The observed excess does not translate into a significant observation of a cosmic signal, even though a null cosmic flux hypothesis can be excluded at 85% C.L. .
The observed distributions of the energy estimators, after the final se-lection, are fitted using a maximum-likelihood method as done in Ref. [5]. Monte Carlo simulations are used to create templates of the cosmic signal and of the atmospheric backgrounds, considering different normalizations and spectral indexes for the signal. Binned distributions of energy estima-tors of data and of the Monte Carlo templates are considered. The final
likelihood L is given by the product of the individual likelihoods Li,S
com-puted for each bin i of the energy estimator distribution for the shower (sh) and track (tr) samples S separately. The distribution of data and templates are compared considering Poisson statistics, with a Gaussian penalty factor to account for systematic effects on the Monte Carlo input parameters τj∗:
L =Q S∈{sh,tr} QNS i=0Li,S Li,S = e−µi,S ·µ ki,S i ki,S! · Q j 1 2πσ[τi,S,j]e −(τi,S,j −τ ∗ i,S,j) 2 σ2[τi,S,j ]
where µiis the expected number of events in the i-th bin from the simulated
templates, NS is the number of bins in the energy estimator histogram for
each event sample and ki,S is the number of events observed in data for
that event sample in that bin. The nuisance parameters τi,S,j considered
here are: the atmospheric neutrino background normalization; the resid-ual atmospheric muon background, relevant in the shower analysis only; an energy-scale shift, which can be produced by the uncertainty on wa-ter properties and optical module efficiencies, as well as on the response of the PMTs. The considered effects modify the expected µi in the simulated
templates analogously to what has been reported above. The atmospheric normalization is fitted simultaneously for the two samples, assuming that the background fluxes should follow the same modeling. The possible energy shift is considered separately for cascades and tracks. The 2D log-likelihood profile, after having fixed the nuisance parameters to the best-fit values, is shown in Fig. 2. The 68% and 90% C.L. contours from this analysis are shown together with the best-fit results from IceCube analyses.
The likelihood profile shows a flat minimum region, which does not al-low for constraining significantly the properties of the cosmic signal, but excludes extremely hard spectra or intense fluxes. The best-fit cosmic flux from ANTARES data yields a single-flavor normalization at 100 TeV of Φ1f0 (100 TeV) = (1.7 ± 1.0) × 10−18GeV−1cm−2s−1sr−1 and a spectral in-dex Γ = 2.4+0.5−0.4, when profiling the likelihood at the 68% C.L. . The best-fit value for the atmospheric neutrino normalization is 25% higher than the Monte Carlo simulations according to the predictions of Ref. [22], as also observed in Ref. [30]. This agrees with the event rates observed below the analysis energy threshold, where the sample is dominated by atmospheric events. An energy scale shift of −0.12 in the logarithm of the shower energy estimator provides the best-fit results; for the track energy estimator, a null shift is found. The same results are found when fitting the low-energy part
Γ 1.6 1.8 2 2.2 2.4 2.6 2.8 ] -1s -1 sr -2 cm -1 GeV -18 (100 TeV) [10 1f 0 Φ 0 1 2 3 4 5 6 LLH Δ -2 2 − 10 1 − 10 1 10 68% 90%
ANTARES (this work) IceCube all-sky (2015) IceCube diffuse tracks (2016)
Figure 2: 2D log-likelihood scan of the diffuse cosmic flux normalization and spectral index. The 68% and 90% confidence contours are shown as black lines. The empty circle is the best-fit point from this analysis, compared to the IceCube best fits from the all-sky combined analysis [5] (full square) and the diffuse flux analysis using tracks [6] (full triangle). The color gradient represents the log-likelihood difference with respect to the best-fit point.
of the energy distributions only, under the assumption that a cosmic signal would not be visible there.
Both IceCube best-fit points lie in the 68% C.L. contour of this analy-sis. Not shown here are the 68% C.L. contours from Ref. [5] and [6], which would also entirely be inside the 68% C.L. contour depicted in Fig. 2. The hypothesis of a null cosmic flux is excluded at 1.6σ, assuming the best-fit hypothesis in a likelihood-ratio test. Even though this significance is not large, this result leans towards the observation of a cosmic neutrino flux compatible with the one observed in the IceCube data.
Acknowledgments - The authors acknowledge the financial support of the funding agencies: Centre National de la Recherche Scientifique (CNRS), Commissariat `a l’´energie atomique et aux ´energies alternatives (CEA), Com-mission Europ´eenne (FEDER fund and Marie Curie Program), Institut Uni-versitaire de France (IUF), IdEx program and UnivEarthS Labex program at Sorbonne Paris Cit´e (ANR-10-LABX-0023 and ANR-11-IDEX-0005-02), Labex OCEVU 11-LABX-0060) and the A*MIDEX project (ANR-11-IDEX-0001-02), R´egion ˆIle-de-France (DIM-ACAV), R´egion Alsace (con-trat CPER), R´egion Provence-Alpes-Cˆote d’Azur, D´epartement du Var and Ville de La Seyne-sur-Mer, France; Bundesministerium f¨ur Bildung und Forschung (BMBF), Germany; Istituto Nazionale di Fisica Nucleare (INFN), Italy; Nederlandse organisatie voor Wetenschappelijk Onderzoek (NWO), the Netherlands; Council of the President of the Russian Federation for young scientists and leading scientific schools supporting grants, Russia; National Authority for Scientific Research (ANCS), Romania; Ministerio de Econom´ıa y Competitividad (MINECO): Plan Estatal de Investigaci´on (refs. FPA2015-65150-C3-1-P, -2-P and -3-P, (MINECO/FEDER)), Severo Ochoa Centre of Excellence and MultiDark Consolider (MINECO), and Prometeo and Grisol´ıa programs (Generalitat Valenciana), Spain; Ministry of Higher Education, Scientific Research and Professional Training, Morocco. We also acknowledge the technical support of Ifremer, AIM and Foselev Marine for the sea operation and the CC-IN2P3 for the computing facilities.
References
[1] S.R. Kelner, F.A. Aharonian and V.V. Bugayov, Phys. Rev. D 74: 034018 (2006).
[2] K. Mannheim, R. Protheroe and J.P. Rachen, Phys. Rev. D 63: 023003 (2001).
[3] A.R. Bell, MNRAS 182: 147 (1978).
[4] M.G. Aartsen et al., Phys. Rev. Lett. 113: 101101 (2014).
[5] M.G. Aartsen et al., Astrophys. J. 809: 98 (2015).
[6] M.G. Aartsen et al., Astrophys. J. 833: 3 (2016).
[7] A. Palladino, M. Spurio and F. Vissani, J. Cosmol. Astropart. Phys. 16: 045 (2016).
[8] M. Ageron et al., Nucl. Instrum. Meth. A 656: 11 (2011).
[9] S. Adri´an-Mart´ınez et al., Astrophys. J. 786: L5 (2014).
[10] S. Adri´an-Mart´ınez et al., Phys. Lett. B 760: 143 (2016).
[11] A. Albert et al., Phys. Rev. D 96: 062001 (2017).
[12] J.A. Aguilar et al., Phys. Lett. B 696: 16 (2011).
[13] J. Schnabel et al., POS(ICRC2015)1065 (2015).
[14] A. Albert et al., Eur. Phys. J. C 77: 419 (2017).
[15] J.A. Aguilar et al., Nucl. Instr. and Meth. A 570 1: 107 (2007).
[16] A. Albert et al., accepted for publication by Astrophys. J. (2017). Preprint available at https://arxiv.org/abs/1708.03649.
[17] L.A. Fusco, A. Margiotta et al., EPJ Web Conf. 116: 02002 (2016).
[18] G.C. Hill and K. Rawlins, Astropart. Phys. 19: 393 (2003).
[19] G.J. Feldman and R.D. Cousins, Phys. Rev. D 57: 3873 (1998).
[20] Y. Becherini et al., Astropart. Phys. 25: 1 (2006).
[21] G. Carminati et al., Comput. Phys. Commun. 179: 915 (2008).
[22] M. Honda et al., Phys. Rev. D 75: 043006 (2007).
[23] R. Enberg et al., Phys. Rev. D 78: 043005 (2008).
[24] S. Adrian-Martinez et al., Astrophys. J. 760: 53 (2012).
[26] G.D. Barr et al, Phys. Rev. D 74: 094009 (2006).
[27] T.K. Gaisser, J. Phys. Conf. Ser. 718 no.5: 052014 (2016).
[28] J.A. Aguilar et al., Astropart. Phys. 34: 179 (2010).
[29] J. Conrad et al., Phys. Rev. D 67: 012002 (2003).