HAL Id: hal-01139700
https://hal.archives-ouvertes.fr/hal-01139700
Submitted on 7 Apr 2015
HAL is a multi-disciplinary open access
archive for the deposit and dissemination of
sci-entific research documents, whether they are
pub-lished or not. The documents may come from
teaching and research institutions in France or
abroad, or from public or private research centers.
L’archive ouverte pluridisciplinaire HAL, est
destinée au dépôt et à la diffusion de documents
scientifiques de niveau recherche, publiés ou non,
émanant des établissements d’enseignement et de
recherche français ou étrangers, des laboratoires
publics ou privés.
Erratum: Climate reconstruction from pollen and d13C
records using inverse vegetation modeling - Implication
for past and future climates (published in Clim. Past
(2009) 5 (147-156))
Christine Hatté, D.-D. Rousseau, Joel Guiot
To cite this version:
Christine Hatté, D.-D. Rousseau, Joel Guiot. Erratum: Climate reconstruction from pollen and d13C
records using inverse vegetation modeling - Implication for past and future climates (published in
Clim. Past (2009) 5 (147-156)). Climate of the Past, European Geosciences Union (EGU), 2010, 6
(1), pp.83-84. �10.5194/cp-6-83-2010�. �hal-01139700�
Clim. Past, 6, 83–84, 2010 www.clim-past.net/6/83/2010/
© Author(s) 2010. This work is distributed under the Creative Commons Attribution 3.0 License.
Climate
of the Past
Corrigendum to
“Climate reconstruction from pollen and δ13C records using inverse
vegetation modeling – Implication for past and future climates”
published in Clim. Past, 5, 147–156, 2009
C. Hatt´e1, D.-D. Rousseau2,3, and J. Guiot4,5
1Laboratoire des Sciences du Climat et de l’Environnement, UMR CEA-CNRS-UVSQ 1572, Domaine du CNRS,
91198 Gif-sur-Yvette, France
2Ecole Normale Sup´erieure, Laboratoire de M´et´eorologie Dynamique, UMR CNRS 8539, 24 rue Lhomond,
75231 Paris cedex, France
3Lamont-Doherty Earth Observatory of Columbia University, Palisades, NY 10964, USA
4CEREGE, CNRS/Aix-Marseille Universit´e UMR 6635, BP 80, 13545 Aix-en-Provence cedex, France 5ECCOREV, CNRS/Aix-Marseille Universit´e FR 3098, BP 80, 13545 Aix-en-Provence cedex, France
In the manuscript “Climate reconstruction from pollen and
δ13C records using inverse vegetation modeling – Implica-tion for past and future climates” by C. Hatt´e et al., a figure has been omitted in the final published manuscript.
The section “3.4 Application on Eemian of La Grande Pile” on page 153, last paragraph, should refer to the missing Fig. 7.
3.4 Application on Eemian of La Grande Pile
Considering our previous geochemical results and the as-sumption that for time periods under similar climatic condi-tions degradation can be assumed to be roughly constant, we decided to apply a −1 degradation isotopic shift throughout the studied period (estimated original δ13C = measured δ13C + 1). Nevertheless, to account for this induced uncertainty, the LH threshold was set at −0.5 (corresponding to a δ13C deviation of on average 0.7) instead of −0.2.
Correspondence to: C. Hatt´e
Results are shown in Fig. 6. Mean annual temperature and annual precipitation reconstructed by biome(s) and δ13C inverse modeling are presented bracketed by the combined domain of potential climatic niches of both of the most likely pollen-derived biomes. This figure clearly demon-strates the added value of the double constraints inverse veg-etation model. Precipitation reconstruction would have re-mained constant and not informative ([−600; +200 mm yr−1] in precipitation anomaly) for the whole studied period with biome as the single constraint. Precision increases by more than a factor of two and even reaches a factor of four by con-sidering both isotopic fractionation and biome as combined constraints. Furthermore, reconstructed temperature ranges are often specified by a factor two for the same period.
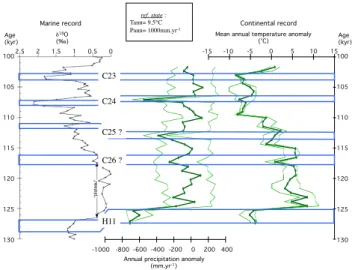
This improvement within paleoclimatic reconstructions al-lows us to highlight important climatic shifts that have previ-ously been recognized in marine records (McManus et al., 1994, 2002; Shackleton et al., 2002) but have been only poorly documented in continental records. Figure 7 illus-trates some cooling events identified in both oceanic and con-tinental records. Heinrich Event 11 (Heinrich, 1988) is then marked by a very dry (about 300 mm yr−1) and relatively
84 C. Hatt´e et al.: Corrigendum cold period (mean annual temperature of 2◦C). An initial
5◦C cooling event at 117–116 ka can be linked to the sea
surface cooling C26 recorded in the central North Atlantic. This cooling is contemporaneous with a 200 mm yr−1 pre-cipitation decrease. After 115 ka, a progressive cooling in mean annual temperature is recorded, followed 1000 to 2000 years later by a decrease in precipitation by ca 400 mm yr−1. A sudden cooling at 109 ka followed 2000 to 3000 years later by a sharp decrease of mean annual precipitation of ca 500 mm yr−1. Decreased temperature with a stationary precipitation regime leads to longer wet winters. For the middle latitudes, this conjunction of low temperature with high precipitation likely mirrors a similar situation further north that would have been favorable to ice-sheet extension. Ice build-up agrees with climate modeling that shows north-ern hemisphere ice volume growth starting ca 115 ka with a maximum at ca. 108 ka (Sanchez-Goni et al., 2005). A cli-matic improvement is recorded as 108 ka by a sharp increase of mean annual precipitation by ca 500 mm yr-1 and a slight warming. This milder climate, which lasted until 104 ka, was recognized as a Br¨orup period. This is in agreement with travertine growth that very rapidly accumulated in Germany around 106–105 ka (Frank et al., 2000). Paleoclimatic inter-pretation in a global context is further developed in Rousseau et al. (2006a). 100 105 110 115 120 125 130 -15 -10 -5 0 5 10 15
Mean annual temperature anomaly (°C)
age (kyr)
-1000 -800 -600 -400 -200 0 200 400 Annual precipitation anomaly (mm.yr-1)
ref. state :
Tann= 9.5°C
Pann= 1000mm.yr-1 Mean annual temperature anomaly
(°C) -15 -10 -5 0 5 10 15 Continental record 100 105 110 115 120 130 125 Age (kyr) -1000 -800 -600 -400 -200 0 200 400 Annual precipitation anomaly
(mm.yr-1) 100 105 110 115 120 130 125 Age (kyr) δ 18O (‰) 2.5 2 1.5 1 0.5 0 Marine record C25 ? C26 ? C24 C23 H11
Fig. 7. Atlantic and Grande Pile Eemian paleoclimatic records. The
left panel shows N. pachyderma sδ18O recorded in the MD95-2042 core (37048◦N 10010◦W 3146 m) for the Eemian period (Shack-leton et al., 2002). The middle and right panels present the mean annual precipitation and annual temperature in La Grande Pile dur-ing the Eemian period, reconstructed by biome(s) and δ13C inverse modeling. Median values are bracketed by their 95%-confidence intervals. Bars underline cold events recognizable in both marine and continental records. Data are presented versus the age model described in Rousseau et al. (2006b).