HAL Id: hal-03037890
https://hal.umontpellier.fr/hal-03037890
Submitted on 3 Dec 2020
HAL is a multi-disciplinary open access
archive for the deposit and dissemination of
sci-entific research documents, whether they are
pub-lished or not. The documents may come from
teaching and research institutions in France or
abroad, or from public or private research centers.
L’archive ouverte pluridisciplinaire HAL, est
destinée au dépôt et à la diffusion de documents
scientifiques de niveau recherche, publiés ou non,
émanant des établissements d’enseignement et de
recherche français ou étrangers, des laboratoires
publics ou privés.
Distributed under a Creative Commons Attribution - NonCommercial - NoDerivatives| 4.0
International License
Molecular tracing of confiscated pangolin scales for
conservation and illegal trade monitoring in Southeast
Asia
Huarong Zhang, Mark Miller, Feng Yang, Hon Ki Chan, Philippe Gaubert,
Gary Ades, Gunter Fischer
To cite this version:
Huarong Zhang, Mark Miller, Feng Yang, Hon Ki Chan, Philippe Gaubert, et al.. Molecular tracing
of confiscated pangolin scales for conservation and illegal trade monitoring in Southeast Asia. Global
Ecology and Conservation, Elsevier, 2015, 4, pp.414-422. �10.1016/j.gecco.2015.08.002�. �hal-03037890�
Original research article
Molecular tracing of confiscated pangolin scales for
conservation and illegal trade monitoring in Southeast Asia
Huarong Zhang
a,∗, Mark P. Miller
b, Feng Yang
a, Hon Ki Chan
a,
Philippe Gaubert
c, Gary Ades
a, Gunter A. Fischer
aaKadoorie Farm and Botanic Garden, Lam Kam Road, Tai Po, N.T., Hong Kong Special Administrative Region
bU.S. Geological Survey, Forest and Rangeland Ecosystem Science Center, 3200 SW Jefferson Way, Corvallis, OR, 97331, USA cInstitut des Sciences de l’Evolution de Montpellier (ISEM) – UM2-CNRS-IRD-CIRAD-EPHE, Université de Montpellier,
Place Eugène Bataillon, Montpellier Cedex 05, France
a r t i c l e i n f o Article history:
Received 1 July 2015
Received in revised form 13 August 2015 Accepted 13 August 2015
Available online 14 September 2015
Keywords: Wildlife trade DNA forensics Pangolin scales Pangolin confiscation Haplotype richness Southeast Asia
a b s t r a c t
Despite being protected by both international and national regulations, pangolins are threatened by illegal trade. Here we report mitochondrial DNA identification and haplotype richness estimation, using 239 pangolin scale samples from two confiscations in Hong Kong. We found a total of 13 genetically distinct cytochrome c oxidase I (COI) haplotypes in two confiscations (13 and ten haplotypes respectively, with ten shared haplotypes between confiscations). These haplotypes clustered in two distinct clades with one clade representing the Sunda pangolin (Manis javanica). The other clade did not match with any known Asian pangolin sequences, and likely represented a cryptic pangolin lineage in Asia. By fitting sample coverage and rarefaction/regression models to our sample data, we predicted that the total number of COI haplotypes in two confiscations were 14.86 and 11.06 respectively, suggesting that our sampling caught the majority of haplotypes and that we had adequately characterized each confiscation. We detected substantial sequence divergence among the seized scales, likely evidencing that the Sunda pangolins were harvested over wide geographical areas across Southeast Asia. Our study illustrates the value of applying DNA forensics for illegal wildlife trade monitoring.
© 2015 The Authors. Published by Elsevier B.V. This is an open access article under the CC BY-NC-ND license (http://creativecommons.org/licenses/by-nc-nd/4.0/).
1. Introduction
Illegal trade of wildlife is a major threat to biodiversity (Corlett, 2007; Nijman, 2009; Rosen and Smith, 2010). Overexploitation driven by wildlife trade has pushed many species to the edge of extinction, as in the well-known cases of tigers, rhinos and elephants. South-East Asia is among the world’s ‘‘wildlife trade hotspots’’, where the trade is usually in high volume (Li et al.,2000;Nijman,2009;Phelps and Webb, 2015). It is estimated that illegal wildlife trade is worth US$2.5 billion a year in East Asia and the Pacific (UNODC, 2013). Monitoring and regulating wildlife trade has become a critical conservation priority (Wasser et al.,2008;Oldfield,2013;Welton et al.,2013;Chan et al.,2015;Challender et al.,2015).
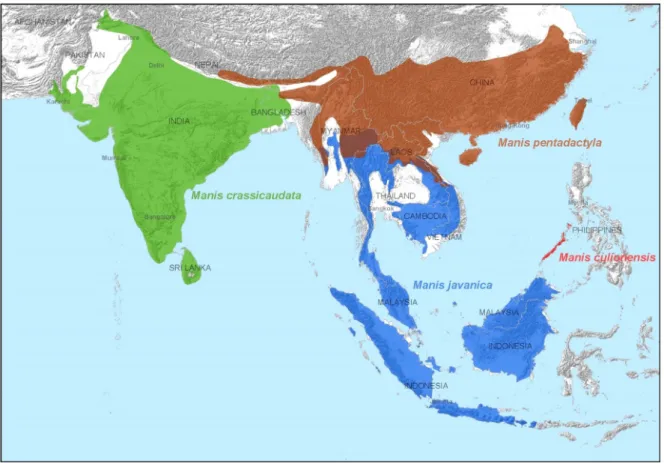
Pangolins (family Manidae) are heavily poached for their meat and scales, to supply the illegal food and traditional medicine trade (Challender, 2011; Challender and Hywood, 2012; Zhou et al.,2014). There are eight species of living pangolins (Gaubert, 2011), and four pangolin species in the genus Manis are found in Asia (Fig. 1; Appendix 1 in
∗Corresponding author.
E-mail address:hzhang@kfbg.org(H. Zhang).
http://dx.doi.org/10.1016/j.gecco.2015.08.002
2351-9894/©2015 The Authors. Published by Elsevier B.V. This is an open access article under the CC BY-NC-ND license (http://creativecommons.org/ licenses/by-nc-nd/4.0/).
Fig. 1. Geographic distribution of the four Asian pangolins: the Chinese pangolin (Manis pentadactyla), the Sunda pangolin (M. javanica), the Palawan
pangolin (M. culionensis), and the Indian pangolin (M. crassicaudata).
supplementary material): the Chinese pangolin (Manis pentadactyla), the Sunda pangolin (M. javanica), the Palawan pangolin (M. culionensis), and the Indian pangolin (M. crassicaudata). The remaining four pangolin species occur in Africa: the tree pangolin (Phataginus tricuspis), the long-tailed pangolin (Uromanis tetradactyla), the Cape or ground pangolin (Smutsia
temminckii) and the giant pangolin (Smutsia gigantea). Pangolins are nocturnal animals that prey on ants and termites.
They are ‘‘EDGE’’ (Evolutionarily Distinct and Globally Endangered;Isaac et al., 2007) mammals (constituting the Order Pholidota) that possess scale-covered bodies (Gaubert, 2011). Pangolins play an important role in controlling ant and termite populations in natural ecosystems (Swart et al.,1999;Wu et al.,2004). With their slow growth and low reproductive rates, pangolin populations are highly vulnerable to hunting. Many populations may now be locally extinct and recovery of the small number of individuals remaining in some severely impacted areas is likely to be slow (Wu et al.,2002;Newton et al.,
2008).
Due to rapid declines in their populations, all pangolin species are listed as ‘threatened’ in the International Union for Conservation of Nature (IUCN) Red List (IUCN,2015). They are also included in CITES Appendix II (CITES, 2013). Although pangolins are also protected by national and regional laws in their range states, they are still subject to illegal trade. Consumption of pangolins is driven by the folklore belief of their health benefits. However, pangolin scales consist of keratin, which has no proven pharmacological effects (Leader et al., 2008).
In the past decade, tons of pangolin scales and meat have been seized worldwide every year (TRAFFIC, 2013) and these seizure records are likely to represent only a small fraction of the massive illegal trade these species have been subject to (Pantel and Anak, 2010;Challender et al.,2015). In 2013, the illegal pangolin trade in Asia-Pacific was estimated to be valued at between US$100–150 million (UNODC, 2013). As the trade in pangolins raises serious legal and conservation concerns, accurate species identification is critical for trade regulation and law enforcement. However, it is difficult to confirm species identity from isolated scales (Challender, 2011).
Wildlife crime investigation has benefited from advances in DNA techniques which are increasingly used to assist cases (Ogden et al., 2009). Species or even populations can be distinguished by nucleotide substitutions in a selected fragment of DNA sequence such as the cytochrome c oxidase subunit 1 (COI) gene, the standard barcoding fragment for species identification (Hebert et al., 2003). Previous studies have shown application of DNA forensics in species identification from rhino horns (Hsieh et al., 2003), ivories (Ishida et al., 2013), whale and dolphin products (Baker et al., 1996), shark fins (Clarke et al., 2006), bushmeat including pangolins (Gaubert et al., 2015), and seized pangolin scales (Hsieh et al., 2011).
2. Material and methods
2.1. Taxon sampling
The study investigated two large seizures of pangolin scales that were made by the Customs and Excise Department of the Hong Kong Special Administrative Region (HKSAR) Government. Samples of scales were randomly removed from the consignments by the Agriculture, Fisheries and Conservation Department (AFCD) following a request for study samples from Kadoorie Farm & Botanic Garden (KFBG). The first confiscation in 2012 contained 224 kg of pangolin scales (Confiscation 1), whereas the second confiscation in 2013 included 312 kg of pangolin scales and 932 kg of carcasses shipped from Singapore (Confiscation 2). A total of 154 and 115 scale samples, weighing respectively 0.61 kg and 0.41 kg, were randomly taken from the two confiscations.
Scale samples were investigated for morphological characters, and inter-scale bristles were discovered in the samples, indicating that they belong to Asian pangolins (Heath, 1992). Our mammal experts were also able to distinguish scales which did not belong to Asian pangolins (based on physical features) from previous seizures in Hong Kong, and which turned out to belong to African species. Pangolin scales were occasionally connected by pieces of tissue, thereby presumably originating from the same individual animal. We separately weighed and labeled each scale-tissue clump. We estimated the total number of pangolins associated with each confiscation with the assumption that the average fresh weight of all scales on a M. javanica is 0.61 kg (Yang et al., 2010). The number of pangolin individuals in one confiscation was therefore calculated as: weight of confiscated scales (kg)/0.61 (kg).
Tissue samples were also taken from two de-scaled carcasses from Confiscation 2. The two carcasses were morphologi-cally identified as M. javanica (Appendix 2 in supplementary material), and were further used as references for identification. Reference DNA samples were also collected from five known provenance M. pentadactyla specimens originating from the wild in Hong Kong (Appendix 3 in supplementary material). Three M. pentadactyla individuals were rescued and delivered to the wildlife rescue center at KFBG as living specimens, whereas the other two specimens were dead carcasses found in Hong Kong’s countryside. These five samples were valuable to the study because of their known provenance. Handling of pangolins and the collection of DNA samples was undertaken by rescue center staff under license from the authorities.
2.2. DNA extraction, amplification, and sequencing
We used DNeasy Blood and Tissue Kits (Qiagen) and followed the handbook protocol for DNA extraction of the samples. DNA concentration was determined using Nano Drop8000 (Thermo-scientific, USA), and then diluted to the working concentration of 10–20 ng
/µ
l. We amplified the Cytochrome c oxidase subunit I (COI) gene from each sample using two separate primer sets to ensure accuracy. The first applied M13-tailed mammal cocktails fromIvanova et al.(2007). The second involved a new pair of primers (pangolin-COI-HZF3: 5′- AGATTTACAGTCTAATGCTT -3′and pangolin-COI-HZR1:5′- CCCATGTATCCAAAGGGCTCTT -3′) designed in Geneious Pro 6.1.6 software (Biomatters Ltd.). This primer set amplified
793 bp of the 5′end of the COI gene and span the standard barcode region. The forward primer (pangolin-COI-HZF3) is located in tRNA(Tyr), which is a conserved region upstream of the COI gene. To compare with the reference data of M.
crassicaudata (not represented by COI in Genbank), we amplified the first 402 bp of Cytochrome b (Cyt b) using the primer
pair GVL14724—H15149 byGaubert et al.(2011) in four scale samples (two samples from each of the COI haplotype H4 and H8).
DNA was amplified in the following PCR mixture for the new COI primers: 5
µ
l 5×
Colorless GoTaq Flexi Reaction Buffer (Promega), 0.
5µ
l 10 mM dNTPs (Fermentas), 2.
5µ
l 25 mM MgCl2, 1µ
l 10µ
M of each primer, 0.
2µ
l 0.02 U GoTaq FlexiDNA Polymerase (Promega), 1
µ
l DNA template, and ddH2O. The thermal cycling profiles for amplifications were as follows:denaturation at 94°C for 1 min, and 35 cycles of 94°C for 30 s, 52°C for 20 s, and 72°C for 50 s followed by one cycle of 72°C for 2 min. PCRs for COI mammal cocktails and Cyt b followedIvanova et al.(2007) andGaubert et al.(2011) respectively.
Amplification products were checked on 1.5% agarose gel and then sent to BGI Hong Kong for purification and sequencing on an ABI 3730xL Genetic Analyzer (Applied Biosystems).
2.3. DNA data analysis
The sample DNA sequences, together with the reference sequences of pangolins retrieved from GenBank (Appendix 4 and 5b in supplementary material) were assembled, edited and aligned in Geneious Pro 6.1.6 software (Biomatters Ltd.).
Sequence alignments were conducted with MUSCLE (Edgar, 2004) using default parameters, and subsequently checked by visual inspection. Final alignments have a sequence length of 600 bp in COI and 399 bp in Cyt b respectively. Outgroups were the domestic cat (Felis catus) for COI and the African tree pangolin (Phataginus tricuspis) for Cyt b.
We identified relationships among the sampled pangolin sequences and pangolin sequences obtained from GenBank in two different ways. First, Bayesian phylogenetic analysis was performed in MrBayes version 3.2 (Huelsenbeck and Ronquist, 2001) and maximum likelihood analysis in PHYML version 3 (Guindon and Gascuel, 2003) to infer phylogenetic relationships. The TRN
+
I model of evolution for COI and TPM2uf+
G for Cyt b gene were selected based on the Akaike information criterion (AIC) in jModelTest 2.1.4 (Darriba et al., 2012). Second, to more clearly resolve relationships of the closely relatedM. javanica COI haplotypes, haplotype networks were constructed with TCS v.1.21 (Clement et al., 2000). The connection
limit excluding homoplasic changes was set to 95% according toHart and Sunday(2007).
Nucleotide divergences among M. pentadactyla and the seized scale clades of COI gene were quantified by MEGA 5 (Kumar et al., 2008) using between-groups mean p-distance and standard errors estimated by 500 bootstrap replications. Tests for genetic differentiation between the two confiscations were performed using the analysis of molecular variance (AMOVA) procedure in Arlequin 3.5 (Excoffier and Lischer, 2010).
2.4. Estimating the total number of pangolin individuals and COI haplotypes
We performed a series of analyses to determine the extent that the observed number of haplotypes in the sample of scales from each confiscation reflected the true haplotype abundance from the confiscations. To estimate the true number of COI haplotypes contained in each confiscation, we used both sample coverage and rarefaction techniques. Sample coverage methods (Huang and Weir, 2001) were adapted from techniques that have been used in ecological investigations to estimate the total number of species based on a single sample or a set of samples (Chao et al.,2000;Colwell et al.,2012). We estimated the total number of haplotypes (k) using the M1, M2, and M3 statistics described in Eqs. (3), (8), and (9), respectively, of
Huang and Weir(2001).
The second approach involved the use of rarefaction (Kalinowski, 2004) to quantify the number of haplotypes that would be expected to be observed in samples of size n
=
1 through n=
N−
1, where N is the original number of individuals included in the sequence analyses. Rarefactions were based on Eqs. (1), (2a), and (2b) ofKalinowski(2004).After completing the rarefaction stage, regression models were fit to the data to estimate the rate at which additional alleles would be observed in a data set as sample sizes increase. We fit five different models to the rarefaction curves including:
(1) a hyperbolic function of the form y
=
(
a∗
x)/(
1+
(
b∗
x))
, (2) an exponential function of the form y=
a∗
(
1−
bx)
,(3) a power function of the form y
=
xa(4) a logarithmic function of the form y
=
1+
a∗
ln(
x)
, and (5) a simple linear function (y=
a∗
x+
b).We calculated the residual sums of squared deviations (SSDr) from each model and assumed that the model with
the smallest SSDr value would provide the best estimates of k (sensuJackson et al., 2008). Note that the hyperbolic and
exponential functions possess asymptotes at y
=
a/
b and y=
a, respectively. We assume that the asymptotic valueapproximates the true value of k when either of these two models had the lowest SSDr. The power, logarithmic, and linear
functions have no asymptotes. Thus, if any of these models has the smallest SSDr, extrapolation is required to infer a value of
k based on the estimated model parameters assuming a population size of x. For the purposes of these analyses, we assumed
underlying population sizes of 250, 500, 1000, and 2000 when generating any extrapolation-based estimates to encompass a range of possible values suggested by our estimates derived from scale weights (see Results).
The complete suite of analyses described above were performed separately for each confiscation, as well as for the sequences generated for both confiscations combined. All analyses described above were implemented using a computer program written in the Python programming language by MPM. Nonlinear regressions models were performed using the curve fitting routines of the ‘‘optimize.curve_fit’’ functions of the SciPy library for Python (www.scipy.org/scipylib; accessed 3 June 2014).
3. Results
3.1. Species identification
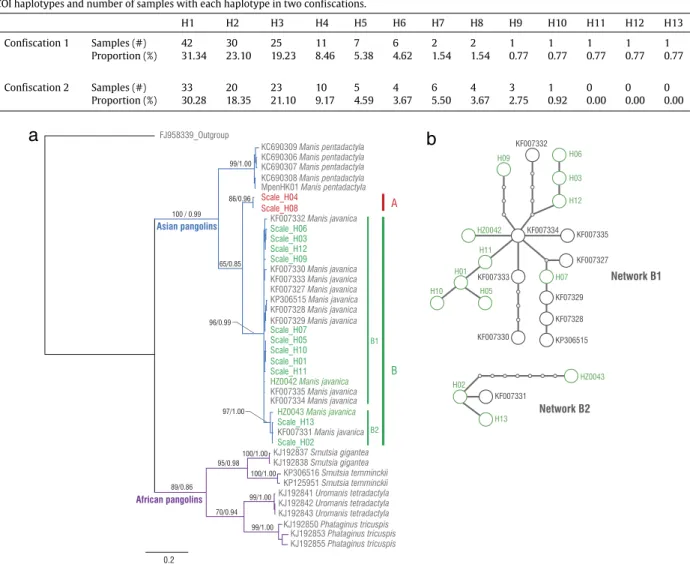
We obtained high quality COI sequences from 130 samples (out of 154 samples) in Confiscation 1 and 109 samples (out of 115 samples) in Confiscation 2. The weight for 130 samples in Confiscation 1 was 0.52 kg and 0.40 kg for 109 samples in Confiscation 2. A total of 13 haplotypes were identified in the 239 scale samples (Table 1).
The Bayesian tree and the Maximum Likelihood (ML) tree for COI possessed identical topologies. The COI phylogeny clearly separated the African from the Asian species with high statistical support (Fig. 2(a)). The clade of M.
Fig. 2. (a) Bayesian tree showing the phylogenetic relationships among pangolin species and scale haplotypes using COI gene. Numbers above branches are
values from the maximum likelihood tree/Bayesian posterior probabilities. Frequencies of scale haplotypes are listed inTable 1. Thirteen scale haplotypes are distributed in two clades (Clade A and B). Sequences from GenBank are listed as accession numbers. HZ0042 and HZ0043 are seized M. javanica carcasses. Outgroup taxon is Felis catus. (b) Haplotype networks for the COI gene of pangolin scale clades under the 95% parsimony criterion. The black dots correspond to the mutational steps between haplotypes obtained using the TCS program (Clement et al., 2000).
GenBank sequences of M. pentadactyla seized in mainland China, and our analysis identified an additional closely related haplotype in the Hong Kong specimens. None of these five COI haplotypes was recovered from the seized scale samples.
COI sequences from the confiscated scales and carcasses were divided into two distinct clades (Fig. 2(a)). Clade A consisted of two scale haplotypes (H4 and H8) which did not cluster with any reference data. From scale samples of H4 and H8, two samples of each COI haplotype were selected for Cyt b sequencing and two Cyt b haplotypes were found corresponding to H4 and H8. Phylogenetic analysis of Cyt b gene also suggested H4 and H8 were in a distinct clade, which was a sister clade to M. javanica and did not belong to M. crassicaudata and M. pentadactyla (Appendix 5a in supplementary material). Clade B corresponded to M. javanica and it consisted of 23 COI haplotypes. There was a sub-clade (four haplotypes) in Clade B divergent from the other 19 haplotypes. The mean p-distance between M. pentadactyla clade and the two scale clades (A and B) ranged from 12.6 to 13.2%, whereas it was 8.7% between A and B (Table 2).
3.2. Haplotype network analysis
Results from the statistical parsimony analysis were consistent with COI phylogenetic analyses, illustrating that Clade B had two separate haplotype networks (Fig. 2(b)). Network B1 included 19 haplotypes and Network B2 included four haplotypes.
Table 2
The between-groups p-distance calculated among M. pentadactyla and two COI scale clades showing the mean with the standard error.
M. pentadactyla Clade A
M. pentadactyla
Clade A 0.126 (0.013)
Clade B 0.132 (0.014) 0.087 (0.011)
Table 3
Estimated number of COI haplotypes from two confiscations of pangolin scales along with estimated derived from the combined data sets. Estimators M1, M2, and M3 are sample coverage estimators fromHuang and Weir(2001). Regression-based models are described in more detail in the text.
Estimator Confiscation
1 2 Combined
M1 13.52 10.09 13.16
M2 22.48 10.91 17.86
M3 31.87 11.06 20.62
Best-fit model Hyperbolic Hyperbolic Logarithmic Estimate type Asymptote Asymptote Extrapolated
Estimated values 14.86 11.06 12.74 (extrapolation to 250) 14.21 (extrapolation to 500) 15.69 (extrapolation to 1000) 17.16 (extrapolation to 2000)
3.3. Comparison of two confiscations
In the 13 haplotypes identified from 239 scale samples, 10 haplotypes were shared between two confiscations (Table 1). The proportion of various haplotypes presented in each confiscation showed similar pattern, and the three most common haplotypes accounted for 73.67% and 69.73% of samples in Confiscation 1 and Confiscation 2 respectively. There were three haplotypes only found in Confiscation 1 and each of these haplotypes was represented by a single sample. Two unique haplotypes were found in two carcasses.
Based on frequencies of COI haplotypes, an analysis of molecular variance (AMOVA) indicated that all of the genetic variation occurred within confiscations, and there was no differentiation between the two confiscations (P value
=
0.
677 and Fst=
0).3.4. Estimating the total number of pangolin individuals and COI haplotypes
The estimated number of pangolin individuals in Confiscation 1 and Confiscation 2 was 365 and 509 respectively based on the total weight of each confiscation and the average weight of scales of a M. javanica assumed to be 0.61 kg.
Hyperbolic function had the smallest SSDr value and was identified as the best-fit model to the data of Confiscation 1
and Confiscation 2. Using the asymptote of the estimated curve, the regression analyses suggested that the total number of COI haplotypes in Confiscation 1 and Confiscation 2 were 14.86 and 11.06 respectively (Table 3). When sequences from both confiscations were combined, the logarithmic function was identified as the best-fit model and yielded extrapolated estimates from 14.21 to 15.69 for sample sizes of 500 and 1000. Sample coverage estimates tended to be more variable between estimators in Confiscation 1 than Confiscation 2. Estimates for Confiscation 2 ranged from 10.09 to 11.06, while Confiscation 1 generated estimates ranging from 13.52 to 31.87.
4. Discussion
4.1. Species identification
Our COI phylogeny illustrates the large genetic differentiation between African and Asian pangolins, and further shows that the confiscated scale samples are not from Africa. This result is consistent with the inter-scale bristles found in the confiscated scale samples, an attribute that is unique to Asian pangolins (Heath, 1992). Phylogenetic studies using mtDNA data (Gaubert and Antunes, 2015;Hassanin et al.,2015) and comprehensive suites of morphological characters (Gaudin and Wible, 1999;Gaudin et al.,2009) also suggest the division of African and Asian pangolins. Our COI tree clearly showed the separation between M. pentadactyla and M. javanica, in line with other phylogenetic analyses using mitochondrial markers (Gaubert and Antunes, 2015;Hassanin et al.,2015).
The majority of the confiscated scale samples belong to M. javanica, which is a widespread species (Fig. 1) and the most commonly traded pangolin in Asia (Challender,2011;TRAFFIC,2013). Although M. pentadactyla also has a long history of international trade, it was not detected in the two confiscations we studied. M. pentadactyla populations have continued
unknown lineage of M. javanica, or a cryptic pangolin species distributed within the range of M. javanica. The COI distance between Clade A and M. javanica was high (8.7%), possibly indicative of species-level divergence (Francis et al., 2010). Unfortunately, we could not obtain information on the geographic origin of those pangolins. A detailed population genetic study of M. javanica and M. culionensis will be needed to better trace the delineation of taxonomic lineages.
4.2. Provenance identification
Genetic data can be used to detect geographic origins of animal species if they have geographically structured genetic diversity (Ishida et al., 2013). However, we cannot pinpoint the origins of the seized scales due to limited reference data (see above) and unknown geographic distributions of genetic lineages in M. javanica. Also trade routing can invariably be complicated as has been seen in other illegally traded species such as Chelonians (Ades et al., 2000), making determination of origin point for many individuals and scale consignments almost impossible.
Most of the scale haplotypes can be found in both confiscations, suggesting they are collected from similar areas, and possibly originating from the same smuggling ring. Although our sample sizes for M. pentadactyla originating from Hong Kong were small, they carried a distinct COI haplotype. If additional analyses based on larger sample sizes corroborate this finding, then our data increases the potential for predicting the original geographic locations of illegal M. pentadactyla harvests. If each scale haplotype found in this study is collected from a particular geographic region, then the confiscated pangolins are highly likely to be harvested from wide geographical areas of Southeast Asia, and then gathered in central collection points for processing and shipping. In some cases, the illegal wildlife trade involves opportunistic, loosely connected networks of individuals (Warchol, 2004). However, given the large size of the two Hong Kong seizures, it is possible that the operation of the harvest and smuggling involve an intricate network of hunters, traders and criminal syndicates.
Discovery of multiple clades and large genetic divergence were also found from seized pangolin scales by using mitochondrial D-loop in Taiwan (Hsieh et al., 2011), and most of those scales are likely to belong to M. javanica (Gaubert and Antunes, 2015). As little is known about intra-specific genetic diversity of M. javanica, the present study has offered new insights into the cryptic genetic diversity of this species and suggests it is composed of different genetic lineages that may constitute different management units or species.
4.3. Estimating the number of pangolins and COI haplotypes
The total number of COI haplotypes predicted for the two confiscations are close to the number of COI haplotypes acquired from our samples. This result suggests that our sampling has caught most of the COI haplotypes and that we have adequately characterized the confiscations.
Estimating the number of pangolins from scale weight is difficult without accurate species identification because different pangolin species have variable body sizes and scale weights. Limited information is available for the weight of scales of a pangolin.Heath(1992) suggests the proportion of scale weight to total mass is around 25% in M. pentadactyla. Hong Kong Customs & Excise Department uses 0.45–0.55 kg/individual as an assumption to estimate the total number of pangolin individuals from confiscated scales (TRAFFIC, 2013).Yang et al.(2010) studied the smuggled M. javanica in China and found the average fresh weight of scales for a M. javanica is 0.61 kg. Among the scale samples from the two Hong Kong confiscations, there are also skin tissue, tail parts and claws attached to scales. We may have over-estimated the number of pangolin individuals in our confiscations by using 0.61 kg, which is for the weight of the scales alone.
4.4. Illegal trade and conservation of pangolins
The illegal wildlife trade has been catastrophic for pangolins and the ecosystems that they inhabit. Overharvesting of pangolins not only threatens their existence, but also affects the food web and local ecosystems because pangolins strongly influence the abundance and diversity of important invertebrates in these ecosystems (Swart et al.,1999;Sileshi et al.,2009). The illegal trade of pangolin scales is largely driven by high demand and high profit. There is a high demand for pangolin scales for traditional medicines in Asia, and it was estimated that demand in China alone amounted to 200,000 pangolins per year (Wu et al., 2002). The price of pangolin scales on the black market has risen from HK$2000 to HK$5000 per kg over the past five years (Lo, 2014). However, it is becoming more difficult to find wild pangolins in Asia and although the
transportation distance is much greater, it has now become commercially viable for traders to exploit African pangolins through recently established smuggling networks in Africa (Challender and Hywood, 2012).
Monitoring and regulating wildlife trade is essential (Nijman, 2009). Our study demonstrates that DNA forensics is a powerful tool that can facilitate wildlife crime investigations (Alacs et al., 2009). Specifically, if regional authorities collect and maintain samples from confiscations for genetic investigations, then barcode genes such as Cyt b and COI may prove useful to investigations, especially given that there are validated primers and that much data now exists in GenBank available for comparison purposes (Gaubert and Antunes,2015). The information may help to strengthen the monitoring and enforcement networks along the supply chain and assist in combating the illegal wildlife trade.
Acknowledgments
We thank the Agriculture, Fisheries and Conservation Department of the HKSAR Government for donating seized pangolin samples; Kadoorie Farm and Botanic Garden for providing facilities and support; Yorkie Wong, Paul Crow, and Alex Grioni for assistance in handling carcasses and scale samples; two anonymous reviewers for comments and suggestions. MPM is a USGS employee and collaborator on this paper. Following the USGS scientific publication policy, any use of trade, product, or firm names is for descriptive purposes only and does not imply endorsement by the US Government.
Appendix A. Supplementary material
The following is the Supplementary material related to this article. Appendix 1 shows photos of the four Asian pangolins.
Appendix 2 contains a comparative table of species-diagnostic characters among Asian pangolins, and photos of the two seized carcasses.
Appendix 3 contains a table of reference pangolin specimens from this study.
Appendix 4 shows detailed information on the GenBank sequences and scale haplotypes used in the COI phylogenetic tree. Appendix 5 shows the Cyt b phylogenetic tree among Asian pangolin species, and information on the GenBank sequences and scale haplotypes used in the Cyt b tree.
Supplementary material related to this article can be found online athttp://dx.doi.org/10.1016/j.gecco.2015.08.002.
References
Ades, G., Banks, C.B., Buhlmann, K.A., Chan, B., Chang, H.C., Chen, T.H., Crow, P., Haupt, H., Kan, R., Lai, J.Y., Lau, M., Lin, H.C., Shi, H.,2000. Turtle trade in northeast Asia: regional summary (China, Hong Kong and Taiwan). In: van Dijk, P.P., Stuart, B.L., Rhodin, A.G.J. (Eds.), Asian Turtle Trade: Proceedings of a Workshop on Conservation and Trade of Freshwater Turtles and Tortoises in Asia. In: Chelonian Research Monographs, vol. 2. Chelonian Research Foundation, Lunenburg, Massachusetts, pp. 32–54.
Alacs, E.A., Georges, A., FitzSimmons, N.N., Robertson, J.,2009. DNA detective: a review of molecular approaches to wildlife forensics. Forensic Sci. Med. Pathol. 6, 180–194.
Baker, C.S., Cipriano, F., Palumbi, S.R.,1996. Molecular genetic identification of whale and dolphin products from commercial markets in Korea and Japan. Mol. Ecol. 5, 671–685.
Challender, D.W.S.,2011. Asian pangolins: Increasing affluence driving hunting pressure. TRAFFIC Bull. 23, 92–93.
Challender, D.W.S., Harrop, S.R., MacMillan, D.C.,2015. Understanding markets to conserve trade-threatened species in CITES. Biol. Conserv. 187, 249–259.
Challender, D.W.S., Hywood, L.,2012. African pangolins under increased pressure from poaching and intercontinental trade. TRAFFIC Bull. 24, 53–55.
Chan, H.K., Zhang, H., Yang, F., Fischer, G.,2015. Improve customs systems to monitor global wildlife trade. Science 348, 291–292.
Chao, A., Hwang, W.H., Chen, Y.C., Kuo, C.Y.,2000. Estimating the number of shared species in two communities. Statist. Sinica 227–246.
CITES, 2013. CITES Appendices I, II and III.http://www.cites.org/eng/app/appendices.php(accessed 01.03.15).
Clarke, S.C., Magnussen, J.E., Abercrombie, D.L., McAllister, M.K., Shivji, M.S.,2006. Identification of shark species composition and proportion in the Hong Kong shark fin market based on molecular genetics and trade records. Conserv. Biol. 20, 201–211.
Clement, M., Posada, D., Crandall, K.A.,2000. TCS: a computer program to estimate gene genealogies. Mol. Ecol. 9, 1657–1659.
Colwell, R.K., Chao, A., Gotelli, N.J., Lin, S.Y., Mao, C.X., Chazdon, R.L., Longino, J.T.,2012. Models and estimators linking individual-based and sample-based rarefaction, extrapolation and comparison of assemblages. J Plant Ecol. 5, 3–21.
Corlett, R.T.,2007. The impact of hunting on the mammalian fauna of tropical Asian forests. Biotropica 39, 292–303.
Darriba, D., Taboada, G.L., Doallo, R., Posada, D.,2012. jModelTest 2: more models, new heuristics and parallel computing. Nat. Methods 9, 772.
Dawnay, N., Ogden, R., McEwing, R., Carvalho, G.R., Thorpe, R.S.,2007. Validation of the barcoding gene COI for use in forensic genetic species identification. Forensic Sci. Int. 173, 1–6.
Eaton, M.J., Meyers, G.L., Kolokotronis, S.O., Leslie, M.S., Martin, A.P., Amato, G.,2010. Barcoding bushmeat: molecular identification of Central African and South American harvested vertebrates. Conserv. Genet. 11, 1389–1404.
Edgar, R.C.,2004. MUSCLE: multiple sequence alignment with high accuracy and high throughput. Nucl. Acids Res. 32, 1792–1797.
Excoffier, L., Lischer, H.E.L.,2010. Arlequin suite ver 3.5: a new series of programs to perform population genetics analyses under Linux and Windows. Mol. Ecol. Resour. 10, 564–567.
Francis, C.M., Borisenko, A.V., Ivanova, N.V., Eger, J.L., Lim, B.K., Guillén-Servent, A., Kruskop, S.V., Mackie, I., Hebert, P.D.N.,2010. The role of DNA barcodes in understanding and conservation of mammal diversity in Southeast Asia. PLoS One 5, e12575.
Gaubert, P.,2011. Family Manidae. In: Wilson, D.E., Mittermeier, R.A. (Eds.), Handbook of the Mammals of the World, Vol. 2: Hoofed Mammals. Lynx Edicions, Barcelona, Spain, pp. 82–103.
Gaubert, P., Antunes, A.,2005. Assessing the taxonomic status of the Palawan pangolin Manis culionensis (Pholidota) using discrete morphological characters. J. Mammal. 86, 1068–1074.
Gaubert, P., Antunes, A.,2015. What’s behind these scales? Comments to ‘‘The complete mitochondrial genome of Temminck’s ground pangolin (Smutsia temminckii; Smuts, 1832) and phylogenetic position of the Pholidota (Weber, 1904)’’. Gene 563, 106–108.
Hassanin, A., Hugot, J.P., van Vuuren, B.J.,2015. Comparison of mitochondrial genome sequences of pangolins (Mammalia, Pholidota). C. R. Biol. 338, 260–265.
Heath, M.E.,1992. Manis Pentadactyla. In: Mammalian species, vol. 414. pp. 1–6.
Hebert, P.D.N., Cywinska, A., Ball, S.L., deWaard, J.R.,2003. Biological identifications through DNA barcodes. Proc. R. Soc. Lond. B Biol. Sci. 270, 313–321.
Hsieh, H.M., Huang, L.H., Tsai, L.C., Kuo, Y.C., Meng, H.H., Linacre, A., Lee, J.C.I.,2003. Species identification of rhinoceros horns using the cytochrome b gene. Forensic Sci. Int. 136, 1–11.
Hsieh, H.M., Lee, J.C., Wu, J.H., Chen, C.A., Chen, Y.J., Wang, G.B., Chin, S.C., Wang, L.C., Linacre, A., Tsai, L.C.,2011. Establishing the pangolin mitochondrial D-loop sequences from the confiscated scales. Forensic Sci. Int. Genet. 5, 303–307.
Huang, S.P., Weir, B.S.,2001. Estimating the total number of alleles using a sample coverage method. Genetics 159, 1365–1373.
Huelsenbeck, J.P., Ronquist, F.,2001. MRBAYES: Bayesian inference of phylogenetic trees. Bioinformatics 17, 754–755.
Isaac, N.J.B., Turvey, S.T., Collen, B., Waterman, C., Baillie, J.E.M.,2007. Mammals on the EDGE: Conservation priorities based on threat and phylogeny. PLoS One 2, e296.
Ishida, Y., Georgiadis, N.J., Hondo, T., Roca, A.L.,2013. Triangulating the provenance of African elephants using mitochondrial DNA. Evol. Appl. 6, 253–265.
IUCN, 2015. The IUCN red list of threatened species.http://www.iucnredlist.org(accessed 12.06.15).
Ivanova, N.V., Zemlak, T.S., Hanner, R.H., Hebert, P.D.N.,2007. Universal primer cocktails for fish DNA barcoding. Mol. Ecol. Notes 7, 544–548.
Jackson, J.A., Patenaude, N.J., Carroll, E.L., Baker, C.S.,2008. How few whales were there after whaling? Inference from contemporary mtDNA diversity. Mol. Ecol. 17, 236–251.
Kalinowski, S.T.,2004. Counting alleles with rarefaction: private alleles and hierarchical sampling designs. Conserv. Genet. 5, 539–543.
Kumar, S., Nei, M., Dudley, J., Tamura, K.,2008. MEGA: a biologist-centric software for evolutionary analysis of DNA and protein sequences. Brief. Bioinform. 9, 299–306.
Leader, B., Baca, Q.J., Golan, D.E.,2008. Protein therapeutics: a summary and pharmacological classification. Nat. Rev. Drug Discov. 7, 21–39.
Li, Y.M., Gao, Z., Li, X., Wang, S., Niemelä, J.,2000. Illegal wildlife trade in the Himalayan region of China. Biodivers. Conserv. 9, 901–918.
Lo, C., 2014. Pangolin scales worth HK$17m found hidden in shipments from Africa, South China Morning Post. http://www.scmp.com/news/hong-kong/article/1534140/pangolin-scales-worth-hk17m-found-hidden-shipments-africa(accessed 22.11.14).
Newton, P., Thai, N.V., Roberton, S., Bell, D.,2008. Pangolins in peril: using local hunters’ knowledge to conserve elusive species in Vietnam. Endanger. Species Res. 6, 41–53.
Nijman, V.,2009. An overview of international wildlife trade from Southeast Asia. Biodivers. Conserv. 19, 1101–1114.
Ogden, R., Dawnay, N., McEwing, R.,2009. Wildlife DNA forensics—bridging the gap between conservation genetics and law enforcement. Endanger. Species Res. 9, 179–195.
Oldfield, S.,2013. The Trade in Wildlife: Regulation for Conservation. Earthscan, London, UK.
Pantel, S., Anak, N.A.,2010. A Preliminary Assessment of Sunda Pangolin Trade in Sabah. TRAFFIC Southeast Asia, Petaling Jaya, Malaysia.
Phelps, J., Webb, E.L.,2015. ‘‘Invisible’’ wildlife trades: Southeast Asia’s undocumented illegal trade in wild ornamental plants. Biol. Conserv. 186, 296–305.
Ratnasingham, S., Hebert, P.D.N., 2007. bold: The barcode of life data system. In: Mol. Ecol. Notes, 7. pp. 355–364. (http://www.barcodinglife.org). Rosen, G.E., Smith, K.F.,2010. Summarizing the evidence on the international trade in illegal wildlife. EcoHealth 7, 24–32.
Sileshi, G.W., Nyeko, P., Nkunika, P.O.Y., Sekematte, B.M., Akinnifesi, F.K., Ajayi, O.C.,2009. Integrating ethno-ecological and scientific knowledge of termites for sustainable termite management and human welfare in Africa. Ecol. Soc. 14, 48.
Swart, J.M., Richardson, P.R.K., Ferguson, J.W.H.,1999. Ecological factors affecting the feeding behaviour of pangolins (Manis temminckii). J. Zool. 247, 281–292.
TRAFFIC, 2013. TRAFFIC bulletin seizures and prosecutions: March 1997–April 2013, Cambridge, TRAFFIC. TRAFFIC Southeast Asia, 2004. Armoured but endangered. Asian Geographic, 64-71.
UNODC,2013. The illegal wildlife trade in East Asia and the Pacific. In: Transnational Organized Crime in East Asia and the Pacific: A Threat Assessment. UNODC, pp. 75–86.
Warchol, G.L.,2004. The transnational illegal wildlife trade. Crim. Justice Stud.: Crit. J. Crime Law Soc. 17, 57–73.
Wasser, S.K., Clark, J.W., Drori, O., Kisamo, S.E., Mailand, C., Mutayoba, B., Stephens, M.,2008. Combating the illegal trade in African elephant ivory with DNA forensics. Conserv. Biol. 22, 1065–1071.
Welton, L.J., Siler, C.D., Linkem, C.W., Diesmos, A.C., Diesmos, M.L., Sy, E., Brown, R.M.,2013. Dragons in our midst: Phyloforensics of illegally traded Southeast Asian monitor lizards. Biol. Conserv. 159, 7–15.
Wu, S., Liu, N., Ma, G., Tang, M., Chen, H., Xu, Z.,2004. A current situation of ecology study on pangolins. Chin. J. Zool. 39, 46–52. (in Chinese).
Wu, S., Ma, G., Tang, M., Chen, H., Liu, N.,2002. The status and conservation strategy of pangolin resource in China. J. Nat. Resour. 17, 174–180. (in Chinese).
Yang, L., Zou, J., Zhang, F., Su, C., Ma, G., Wu, S.,2010. Estimation of number of individuals of Malayan pangolin with number of their scales. Chin. J. Wildl. 31, 180–181. (in Chinese).