HAL Id: hal-00975560
https://hal.archives-ouvertes.fr/hal-00975560
Submitted on 14 Apr 2014
HAL is a multi-disciplinary open access archive for the deposit and dissemination of sci-entific research documents, whether they are pub-lished or not. The documents may come from teaching and research institutions in France or abroad, or from public or private research centers.
L’archive ouverte pluridisciplinaire HAL, est destinée au dépôt et à la diffusion de documents scientifiques de niveau recherche, publiés ou non, émanant des établissements d’enseignement et de recherche français ou étrangers, des laboratoires publics ou privés.
Assessing Barriers to Trade in the Distribution and
Telecom Sectors in Emerging Countries
Lionel Fontagné, Cristina Mitaritonna
To cite this version:
Lionel Fontagné, Cristina Mitaritonna. Assessing Barriers to Trade in the Distribution and Telecom Sectors in Emerging Countries. World Trade Review, Cambridge University Press (CUP), 2013, 12 (1), pp.57-78. �10.1017/S1474745612000456�. �hal-00975560�
Assessing Barriers to Trade
in the Distribution and Telecom Sectors in Emerging Countries
Lionel Fontagné* – Christina Mitaritonna**
*PSE (University Paris 1), European University Institute and CEPII **CEPII
Pre-publication version
Abstract:
We compute ad valorem equivalents (AVEs) for the regulation in three service sectors
(i.e. fixed telecom, mobile telecom, distribution) applied by selected emerging countries.
We start with qualitative information on the restrictions applied by each country in each
sector; we apply a multivariate statistical approach to transform this qualitative data into
a trade restrictiveness synthetic index (STRI). In a second stage we estimate the average
impact of STRI on price cost margins. In the third stage, this impact is used to calculate
the AVE of the STRI estimated in the first step. It is shown that the STRI has a
significant effect on the price-cost margins of the individual firms only when controlled
for Regional trade Agreements and exception to the MFN clause in the considered sector.
Lastly, we compute tariff equivalents for the STRIs previously calculated using the
estimated impact. More than half our AVEs are larger than 50% and one AVE out of six
is above 100%.
JEL classification : F13
1
Introduction
1Much of the studies addressing trade barriers in services have been relying on trade equation residuals to estimate tariff equivalents. The objective of this paper is on the contrary to rely on the observed sector-specific regulatory variables, that are qualitative information. The advantages of such an approach are obvious. Gravity equation residuals may be affected by potential specifications errors such as omitted variables and poor quality of the underlying data. Also such approaches do not address local presence, which is the principal mode of service provision abroad. We will illustrate this method for three sectors of services – distribution, fixed telecom, mobile telecom – and a sample of 11 emerging countries.2
The survey methodology applied here has the advantage to rely on direct evidence from applied regulations, however it comes at a cost. This technique indeed is highly resource consuming, and this is why this method is unlikely to be applied across a wide range of sectors and countries. First qualitative information on barriers to services trade need to be collected. It is important that all the relevant restrictions are considered. As this asks for an advanced knowledge of the sector, this first stage is normally conducted through a survey obtained from several acknowledged experts.
We managed to treat information on services regulations existing in the mid-2000s on three services sectors (Distribution, Fixed Telecom and Mobile telecom) in Argentina, Brazil, China, Egypt, India, Indonesia, Malaysia, Morocco, Singapore, Thailand, Philippines and Tunisia, as provided by the Queen Mary University (See Queen Mary University, 2009).
1 We are indebted to Queen Mary University and Development Solutions and Nora Dihel for providing
much of the data used in this research. We acknowledge inspiring comments and suggestions by two anonymous referees and the editor. All errors remain ours.
2 One questionnaire could not be coded (distribution in Thailand) hence we may consider 10 or 11 countries
Questions present in the original questionnaires are very precise and address many regulatory issues for the concerned sectors. For the fixed telecom sector, examples include “Is interconnection to the public switched network allowed legally?” or “What are the main criteria/procedures new entrants must satisfy to be granted a service license?”. Accordingly, an important part of this work was coding all the responses collected by the Queen Mary University, on a number of assumptions. While coding answers to the first question referred to as an example above is straightforward (it is dichotomic: either interconnection is allowed or not), coding the second example is more challenging. In the latter case we had to take into account the payment of a license fee, the occurrence of a competitive tender, the presence of an economic needs test, the request for submission of information and the possible discretionary decision by authority. We ensured that the coding process of this qualitative information remained fully transparent.3 In the
second step all the qualitative information (e.g. the modes of attribution of licenses is different for foreigners; price caps are often determined by authorities, etc…) need to be transformed into quantitative data by an accurate scoring of the actual restriction according to their restrictiveness, on a scale ranging from zero (not restrictive) to one (highly restrictive). Finally all the scores are synthesized in a unique indicator, the so called “Synthetic Trade Restrictiveness Index” (STRI),4 weighting together all the restrictions. We used an appropriate statistical method, the Principal Component analysis (PCA), to avoid assigning subjective weights (Section 2.1). As robustness, we attribute simple equal weights to all the measures.
The second step was to enter the synthetic STRI as an explanatory variable in an econometric model, where the dependent variable is the price-cost margins of firms operating in a given sector. The methodology applied here assumes that regulatory measures impact on price and cost
3 We provide in Appendix 1 the Coding schemes for the fixed telecom sector. The Coding schemes for the
two remaining sectors are provided in the Web Appendix while the file summarizing coding assumptions is available to the interest reader upon request.
4 We will use the acronym STRI instead of TRI to avoid any confusion with the TRI approach used
and that we can deduce from the change in the wedge the ad valorem equivalent of a tariff on prices. The bottom line is that costs increase more than prices as the regulation is reducing efficiency in the provision of services. The price-cost margin is indicative of the magnitude of the barriers, when determinants other than regulatory measures are properly controlled for (e.g. market concentration). This calculation is done for a larger set of countries than in the survey, taking benefit of OECD surveys previously performed. We are indebted to Nora Dihel for access to her large dataset (Dihel, 2007), which we used for the regression in order to obtain the average impact of the STRI on price cost margins (i.e. the coefficient of STRI).5
As robustness, we use an alternative STRI measure, computed by the Australian Productivity Commission that has pioneered studies in this field.
Finally both STRI and the average effect of the STRI on price cost margins were used to compute the corresponding tariff equivalents for the sample of sectors and countries present in the Queen Mary University survey.
A first significant limitation of the methodology is that the results from the empirical models do not differentiate the exact nature of the economic effects of the barriers (whether they are cost-increasing or rent-creating for incumbent firms). However, while information on firm-level margins is relatively freely available, data on costs and prices separately is not. The available information allows only the effect on margins to be measured.
A second limitation of the method is to rely on two different datasets, whereby the second is providing more observations to econometrically estimate the impact of STRI on price-cost margins. We however used a common PCA methodology for both datasets, in order to insure
5
The Dihel dataset is very rich. For the fixed telecom sector, for instance, it includes variables such as capital intensity of production (total capital / net sales), percentage of digital mainlines, price-cost margin ((EBIT + depreciation) / net Sales), labour productivity (net sales / number of employees). The detail and definition of these variables are provided in the Web Appendix.
consistency when the estimated average impact of the STRI is applied to our sample of observed countries.
A third limitation of the method is that it cannot clearly state to what extent regulations are cost increasing or rent creating. We observe only the net effect. This is even more the case that we cannot identify whether the price-cost margin effect of a given measure is observed on individual firms with domestic or foreign ownership. What is the relation between rents and additional costs is a field of research deserving further investigation based on different data.
Lastly and this is relevant for policy, preferential trading arrangements as well as most favored nation (MFN) exemptions introduce a further element of distortion. Foreign providers of services are discriminated, but not all to the same extent, what generate rents for the preferred ones, as any preference scheme. Taking into account RTAs and exemptions to the MFN clause allowed us to give a rough estimate of related margins and rents.
The remaining of this paper is organized as follows. Section 2 describes the methodology used to calculate the STRIs and discusses the limitations of the Principal Component Analysis (PCA) method; Section 3 estimates the economic impact of barriers to trade in services using the computed indexes. Section 4 explains how ad valorem equivalents were calculated. Section 5 concludes.
2 Methodology to construct synthetic trade restrictiveness indexes
This section focuses on the computation of aggregate STRIs for fixed telecom, mobile telecom and distribution, for selected emerging economies (Argentina, Brazil, Egypt, India, Indonesia, Malaysia, Morocco, Singapore, Thailand, Philippines and Tunisia). The calculation of STRIs is based in information gathered from the responses to detailed questionnaires provided by the Queen Mary University. Although the data we received was extremely detailed, it does not contain information on separate restrictions related to the four modes of services provisions. Accordingly our restrictiveness indexes, as well as the tariff equivalents, are global indexes instead of modal ones. We applied a multivariate statistical approach, known as PCA, in order to construct STRIs starting from the information contained in the questionnaires.
There is however a drawback to such approach as the usage of the PCA method to derive STRI scores is subject to a series of limitations. Firstly, the ratio of the number of observations to variables must be at least five to one. While this condition on the dimensionality is fulfilled in our data, there is another important restriction which is more general. Using the PCA, there is no guarantee that a variable contributing largely to overall variance will necessarily contribute much to the restrictiveness of the regulations in the considered sector. Hence, attributing a large weight to this variable may be misleading. Lastly the number of ordered eigenvalues is impacting the results (we show that using more than one component is worth and extracts more information from the qualitative data). Against this background, we adopted the following strategy. Firstly, we adopt a different weighting scheme using our data. Secondly, we rely on alternative STRI available in the literature. Our results are overall robust to these changes in qualitative terms.
Even if the magnitude of the tariff equivalents may differ, the hierarchy of countries and sectors is mostly robust to these changes.
These results call for further research on the construction of synthetic indicators, when qualitative information will be more systematically available. The bottom line is indeed that constructing such synthetic indicators summarizing the impact of a myriad of individual regulations necessarily implies a tradeoff between losing information and gaining in comprehension. Our method does not authorize to trace the impact of a single measure but provides with a broad overview of the protective impact of the set of regulations enforces by a country in a given service sector.
2.1 Construction of the STRI
A series of steps is involved in the calculation of STRI. Some important methodological choices are made in this paper, whose discussion requires detailed description of the methodology used. The first step is the collection of qualitative information on different regulations,6 and its coding
on a zero to 1 scale to reflect increasing restrictiveness.7 As shown in Appendix A.1, the scoring
used is common throughout regulations and sector, For instance, in the fixed telecom sector, we will code one a regulation making interconnections to the public switched network illegal. We code zero if such regulation does not exist in the country under consideration. If new entrants are required to use incumbents’ international gateway switch, we code one, and zero otherwise. The same logic applies to every sector and regulation, though we modulate the scoring for more complex cases (e.g. 0 if prices are market prices, 0.5 if the regulator sets a price cap, 1 if the price is administrated. Such scoring embodies expert judgment; this is why it must be kept transparent.
6 Our source of information on trade barriers is Queen Mary University and Development Solutions (2009). 7 See Table in Appendix A-1 as an example for one sector.
We avoid attributing subjective weights to different restrictions;8 weights are derived directly
from data derived using the PCA technique pioneered in the field of economic regulations by the OECD (Gonenc & Nicoletti, 2000; Steiner, 2000) and used extensively thereafter (Copenhagen Economics, 2005; Dihel, 2007; Marouani, 2009). The PCA avoids introducing expert judgment at that stage.
Intuitively PCA is a variable reduction procedure. It is appropriate for measures for a number of observed variables in order to develop a smaller number of artificial variables (or principal components). In particular, as some variables are correlated, it is possible to reduce the number of observed variables into a smaller number of principal components that are able to account for most of the variance in the observed variables.
More formally the STRI is considered to be a variable that is assumed to be linearly dependent on a set of n observable components, which in this case are the various restrictions, plus an error term. The total variation in the STRI then is made up of two orthogonal parts: a) variation due to the original variables; b) variation due to the error.
Starting with the n collected variables on regulations, each is initially normalized by subtracting its mean value and dividing by its standard deviation. Then a correlation matrix C (n x n matrix) is calculated based on the standardized variables, to solve the equation |C – λI| = 0 for λ. This provides a nth degree polynomial equation in λ and hence k ≤ n roots known as the eigenvalues of the correlation matrix C. Next λ is arranged in descending order of magnitude, as λ1 > λβ >… λn. Corresponding to each value of λ, the matrix equation (C- λI)α=0 is solved for the nx1eigenvectors (α1, α2 … αn). We then multiply each of the sets of raw data from the initial matrix containing the normalized information on barriers, by each of the eigen vectors to obtain n principal components variables, which have special statistical properties in terms of variance. In
8In the original work on TRI by a team of researchers from the Australian Productivity Commission and the
University of Adelaide (see e.g. Warren, 2001; Kalirajan, 2000), scores and weights are based on subjective assignments.
fact PCA computes an orthogonal coordinate system such that the greatest variance in the orthogonal projection for the initial data lies in the first coordinate (first principal component), the second greatest variance lies in the second coordinate (second component), and so on. Finally, the STRI is calculated as the weighted average of the retained principal components, where weights are equal to the eigenvalues of the correlation matrix C, which ultimately represents the proportion of variance of each principal component ( e.g. . λ1= var (PC1) , λ2= var (PC2)…. λn= var (PCn) ).
How many components need to be retained is an empirical matter and is impacting the results; most practitioners retain all components with an eigenvalue greater than 1 (considering the component to be as informative as the original data).9 While previous studies calculating STRIs
in services used only the first component (e.g. Dihel and Sheperd, 2007), the first component represents only a part of the original variance (e.g. in our data, in the distribution sectors the first component explains only 32% of the original variance) and much information is excluded.
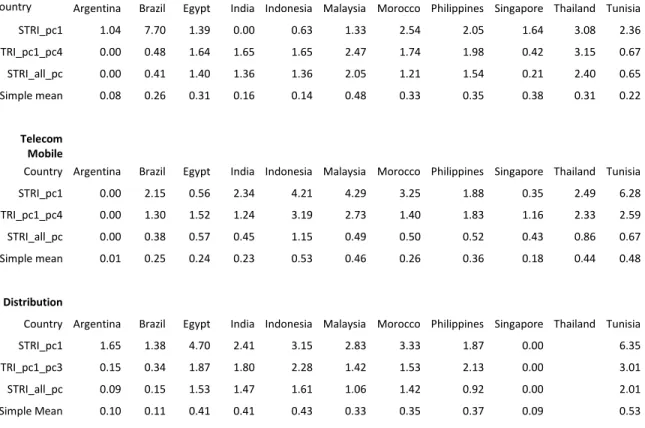
In order to illustrate this, we show in Table 1 the STRI obtained first using only the first component (TRI_pc1), then using all relevant components (e.g. those with an eigenvalue greater than 1: TRI_pc1_pc…), then all components (TRI_all_pc) and finally the simple mean. Based on the different variants, the STRI are scaled so as to assign the value zero to the most liberal country (we calculate the STRI for each country before subtracting the minimum value of the STRI from each country’s STRI). The countries with the lowest STRI scores have the most liberal trade regimes. We can see that considering just one component strongly affects the results not only in terms of size but more importantly in terms of policy. Against this background we can compute a STRI using equal weights for all measures as robustness. We observe that results are overall consistent with our preferred method, though two differences appear. First, the absolute
9 The number of components retained varies from sector to sector; here we use 4 components for each of
value of the STRI is smaller, which will impact the estimated impact of the STRI on price cost margins in the econometric step of the analysis (the estimated coefficient becomes larger). Second, some country-sector pairs move in the overall ranking. The latter outcome is no surprise and actually justifies our use of a more complex method to extract information from the qualitative data. The good news is that our econometric estimations, presented in Section 3, are robust to these changes of methodology, There are also robust to the use of different set of STRI, computed by the Australian Productivity Commission, for the same sectors and countries (though the Australian data covers less sectors). How we calculate the tariff equivalents by sector for the 11 emerging economies is described in Section 4.
3 Measuring the economic impact of barriers to trade in services
The main objective of the paper is to translate the restrictions observed in the services sectors, as measured by the STRIs index, into tariff equivalents, which can be thought of as hypothetical taxes, equivalent to the actual barriers faced by operators.
In order to get tariff equivalents by sector for the emerging economies under analysis, two sets of information are required. First we need the value of the STRI, as calculated in Section 2.1. Second we need to measure how STRI affect the price-cost margin of service provisions. In this section we estimate the average net impact of barriers to service provision on firm`s price-cost margins, for each of the three sectors considered.
For this second step we need a large set of countries. Taking only the eleven emerging economies, we will have a too small number of observations, which will not allow us to perform the estimations needed. We need to introduce in the estimation more countries for the sectors under scrutiny. As the obtained coefficients will be extrapolated to our restricted database, we need to perform our PCA analysis on this extended dataset, in order to keep consistency. Interestingly, the five first ordered eigenvalues are always significant, while our data set leads to consider three to four eigenvalues depending of the country and sector. We are grateful to Nora Dihel for allowing access to her dataset which includes qualitative information about restrictions to recalculate the STRIs for a large set of countries10. It also contains data for more than 90 firms
10 The countries included in the telecommunication sectors are the : a large number of European economies
(Austria, Czech Republic, Denmark, Finland, France, Germany, Greece, Italy, Netherlands, Portugal, Spain, Switzerland, UK), selected countries in Asia (China, India, Japan, Korea, Malaysia, Thailand), Latin American (Argentina, Brazil, Chile, Peru), North America (Canada, USA and Mexico) and Australia and New Zealand. The economies considered in the distribution sector are the same as in the telecommunication sectors plus Honk Kong, Indonesia, Singapore, Sweden and Turkey.
for the two telecommunication sectors and 380 firms for the distribution sector over the period 2002-2004.
It should be pointed out that even if we use the same dataset, as in Dihel and Sheperd, 2007, our work is novel in terms of both the calculation of the STRIs and the applied econometric specifications. STRI are computed with our PCA approach in order to obtain econometric coefficients that can be consistently extrapolated to our data.
3.1 Econometric specification
The pattern of service provision generally requires local presence of the service provider. The exception is mode I trade in services, which represents a minor part of total trade in services within the GATS (General Agreement on Trade in Services) definition. Also, provision of services is generally regulated by a public authority. These regulations are enforced for a series of reasons ranging from the need to ensure that the provider is properly qualified (law, surgery, etc.) to the need to ensure that the service provider is not taking unwarranted risks (banking, finance). Accordingly, the enforcement of regulation depends on a mix of informational asymmetries and potential externalities.
Regulations have been applied at national level in an uncoordinated manner, which has resulted in differences across countries – a patter not specific to services. It requires firms to bear specific fixed costs to adapt their supplies for different destination markets (Kox and Nordas, 2007). In addition to this somewhat classical dimension to differences in domestic regulation, is the risk that in services, domestic and foreign providers may not receive similar treatment, depending on the GATS commitments in the different countries. Regulation generally increases the real resource costs of doing business (e.g. by requiring excessive paperwork) while at the same time limiting competition (creating pure rents for incumbent firms). The two effects impact on prices in the same direction: prices should rise, but what we observe is the net effect on margins. This is
to be recalled when interpreting the results of our estimations and computing the ad valorem equivalents of the presence of regulations.
Lastly, countries discriminate not only between domestic and foreign providers of services, but also among foreign providers as a result of their involvement on Regional Trade Agreements (RTAs) – hence the creation of rents for firms from “preferred” countries.11
Finally, the question that is addressed in this section is to what extent regulations impact on the price-cost margins of firms (domestic or foreign) located in a given country, and in a given industry. The main difficulty lies in disentangling the specific effects of the regulation from the effects of other determinants. Each firm`s profitability is affected by several factor specific to that firm (e.g. the market share of the considered firm, the firm size or the operational efficiency) along with other sectoral or economic-wide variables.12 A classical approach in the Industrial
Organization literature is the Structure-Conduct-Performance paradigm that attributes to market concentration a key role in shaping price-cost margins (see Cowling and Waterson, 1976, for a derivation). Khalilzadeh-Shirazi (1974) is adding the growth of demand and the capital intensity of the firms among determinants plus indeed barriers to entry (the variable we are interested in). The recent literature on heterogeneous firms is pointing to the role of differences in productivity and market shares (Melitz and Ottaviano, 2008): the distribution of margins across firms is actually responding to the number and average productivity of competing firms in the considered market. The same prediction that more productive firms charge higher mark-ups is obtained by Bernard et al. (2004). Based on this extensively documented evidence we introduce the productivity of the firm, its market share, its net sales growth, and its capital intensity as controls in our estimation of the impact of barriers of entry (STRI) on margins. In the distribution sector,
11
The percentage of observations covered by an RTA in our sample ranges from 79% to 85% depending of the sector.
12 Profitability is defined as the sum of the earnings before interest and taxes (EBIT) and depreciation,
we also rely on expert advice and add two variables: the solvency ratio and the efficiency of supply as key elements of competition in this capital intensive sector.
Industry characteristics, such as the capital intensity, may impact on all firms in the same way in a given country, but not necessarily in all countries as market size matters (Melitz and Ottaviano, 2008). Also, the presence of at least one MFN exemption in the considered sector will impact on all local firms in the same way.13
All in all, when econometrically estimating the relationship between mark ups and the barriers to services provisions, the first challenge is to control for the various determinants of the price cost margins while accounting for collinearity among the explanatory variables.
A second empirical challenge is to properly take account of the various dimensions of the data used: firm, sector and country level. In a given industry and a given country, all firms will be affected in the same way by certain sectoral characteristics. As a consequence, when individual price costs margins are regressed on their determinants, sectoral characteristics will be repeated as many times as there are firms in the particular industry in a given country, what imposes to cluster standard errors
In the following, we use a through econometric analysis to measure, for each industry separately, the direct impact of the restrictiveness of national regulations (STRIs) to service provisions, dealing with all the empirical questions mentioned above. The estimations of the average impact of the STRIs, for the fixed telecom, mobile telecom and distribution, will be used in subsection 3.3 to translate the synthetic STRIs computed in sub-section 2.1 into valorem equivalents.
13 However the number of observations covered by an MFN exemption is less frequent in our sample than
3.2 Data and variables
Our objective is to measure the average economic impact of the barriers applied to three services sectors: fixed telecom, mobile telecom and distribution.
For each service sector separately, we estimate the following econometric model: (1) PCMfic = c + α(controls fic) + (controls ic) + STRI ic + εfic
The price-cost margin for each firm (subscript f) in a given sector (subscript i) across countries (subscript c) is explained by a constant, a set of firm and country control variables, the aggregate STRIs representing the restrictiveness of the regulation applied by each country in that sector and a white error term.
Two decisions are central: the set of variables to be included as controls and the type of STRIs (those computed considering the first principal component only, the weighting average of the most relevant components or the weighting average of all the components).
The main interest would be in the magnitude of the coefficient . However, its sign is also important. If is positive we will interpret the barriers as rent-creating. On the contrary if the sign is negative the barriers would be cost increasing. Obviously services restrictions might affect price and costs simultaneously. Kalirajan (2000) interprets the reduction in price-cost margins associated with restrictive regulations in cost-creating terms; more precisely there is a greater increase in costs than in prices. However he provides a series of arguments showing why such interpretation might be risky. The bottom line is that a negative (or positive) sign is difficult to interpret and might only provide indirect evidence of some sort of net effect. To disentangle the two effects we would need data on prices and costs separately at the firm and sectoral level. Unfortunately such data is available for a very limited number of countries, so we have to rely on the information on firm level margins which is relatively easier to get. Accordingly it is very difficult to definitely interpret our results in terms of rent or cost.
All the data necessary to perform econometric estimations is the same as in Dihel and Sheperd (2007). The number of observations varies from one sector to another. The dataset contains yearly data for more than 90 firms for the two telecommunication sectors from 28 countries and 380 firms for the distribution one from 3314 countries, over the period 2002-2004.
As already mentioned, even using the same data, our work differs from the study by Dihel and Sheperd in two ways. First the aggregate trade restrictiveness index is recomputed for each country and industry, relying on a different methodology that is consistent with the one applied in sub-section 2.1. Hence, we consider either the STRI computed via the first principal component or as the weighted average of the most relevant principal components. Second, we use an econometric specification that differs in terms of the variables considered and the econometric technique applied.
For the three services sectors we consider the price-cost margin of each firm, as defined in footnote 10.
Concerning the controls affecting the firm`s profitability, other than the STRIs, the list of available variables is the following:
- The apparent productivity of the firm, defined as log of the ratio of net sales over number of employees;
- The firm market share defined as the log of ratio of net sales over total industry net sales; - The annual (log) growth in the sales of the considered firm;
- The capital intensity of production defined as the log of ratio of total capital over net sales, measured at firm level;
- In the distribution sector, we also control for the solvency ratio (total debt/(total capital + short term debt)) and the efficiency of supply (total inventories/net sales).
- The STRIs for each country, alternatively computed considering the principal component only or as the weighted average of the significant components. Obviously our preferred specification is that which includes the weighted STRI.
- Previous STRI interacted with a dummy variable equal to 1 if the country has signed at least one RTA covering the sector;
- Same STRI interacted with a dummy variable equal to 1 if a country has at least one MFN exemption for the sector;
The list of the available variables raises the problems of potential collinearity between certain of them as net sales appear in the denominator of the right-hand side of the equation taken in logarithm. This specification is imposed by determinants derived from theory. We have run univariate (unreported) regressions to double check that the sign and significance of our explanatory variables were not affected. Finally we performed alternatively regressions with and without the solvency ratio (See Table 4).
As correctly observed by Dihel and Sheperd (2007) the combined presence of firm and country level variables leads to incorrect statistical inference. Clustering the error terms at country level can be preferred to performing two-stage estimations (Woolridge, 2003).
3.3 Results
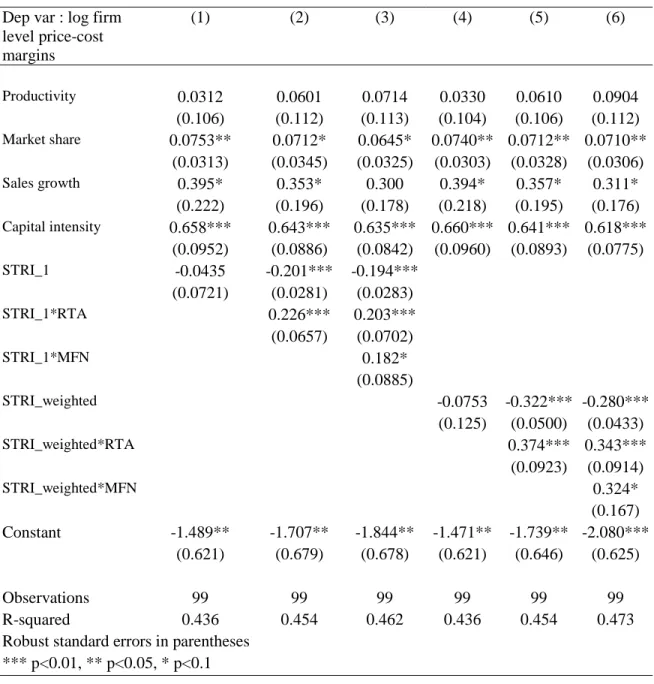
We start by replicating the approach in Dihel and Sheperd (2007) – namely by relying on the STRI calculated using only the first principal component (STRI_1), firstly for the fixed telecom
sector.15 The results are presented in columns (1) to (3) in Table 2, while columns (4) to (6) of
Table 2 use the weighted average of the significant principal components (STRI_weighted) .
-Table 2 about here-
The results are encouraging given the limited number of observations: most selected variables are significant, and roughly half of the variance in individual price cost margins is explained. The only variable that is not significant is firm productivity. Firm’s market share shows an increased price cost margin, consistent with the usual imperfect competition framework already mentioned. The growth of firm sales is also positively related to price cost margin, though with a wider margin of error. More capital intensive firms are also more profitable. We could argue that being more profitable allows higher investment. Accordingly reverse causality is not excluded. Productivity fails to be significant, a result that must be attributed to the poor proxy used. Instead of using the apparent labor productivity, Total Factor Productivity should have been used. However, data was not available to compute this variable.
We next turn to our variables of interest, related to service regulation restrictiveness. First, we can see that the STRI has no significant effect on the price-cost margins of the individual firms in column (1), when it is introduced alone in the equation. This somewhat deceptive result is not altogether surprising however, since what is important is the discriminatory enforcement of these regulations across trading partners. This outcome is the result of an omitted variable, controlling for the fact that certain operators bypass the regulation constraints by being members of RTAS. When the terms are interacted between STRI and RTA or MFN, the STRI are shown to have a significant impact on price cost margins at the 1% confidence level. This impact is negative confirming our hypothesis that the cost-enhancing effect of the regulations dominates the
competitive advantages to incumbent firms. Though, if most regulations are cost increasing but they are less so in RTAs. This explains the sign of the parameter on the interacted variable. Our interpretation is that preferential arrangements in the service sector provide firms located in the partner countries that have signed these agreements, differential advantage over firms located in a third country. An RTA confers exporting advantages on a firm and so could well boost its price-cost margin. This ‘margin of preference’ is exploited in subsection γ.β to compute associated rents accruing to those firms.
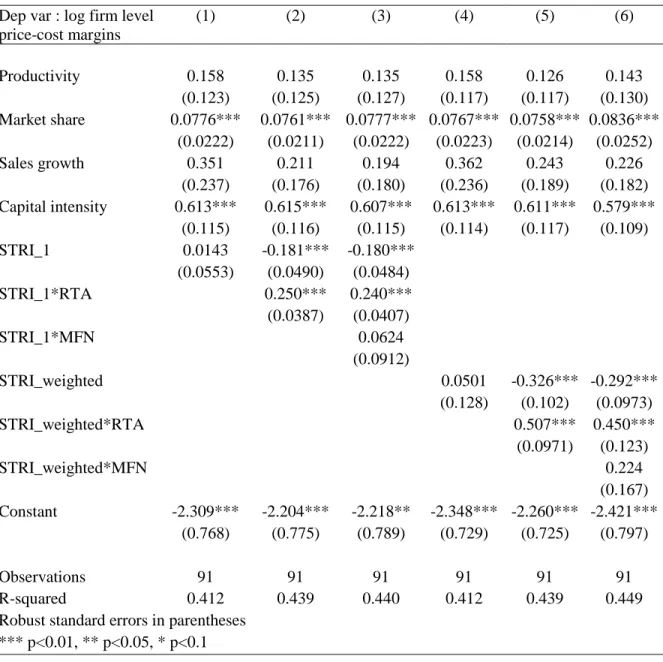
Next, we turn to the mobile telecom sector and proceed as before. The results are reported in Table 3. Compared to the fixed telecom sector, sales growth does not have a significant impact on price cost margin. The reasons for this are associated with the pricing strategies of firms. Sales growth is only achieved at very high cost in this industry, where ‘capturing’ a new client is costly (e.g. in terms of the mobile set provided free to new subscribers). Market share, on the other hand, has a very significant and positive effect on price-cost margin. In addition, MFN exemptions do not have an effect on price cost margins. A tentative explanation for this is that the core issue, of new licenses, is not controlled for here.
-Table 3 about here-
The last sector is distribution – results presented in Table 4. We observe a positive impact of sales growth, while market share is weakly significant. Here, again, capital intensity positively affects price cost margin. Productivity has a negative impact – possibly pointing to the transfer of productivity gains to the consumer in a rather competitive sector. The two variables suggested by microeconomic evidence on competition in the sector (solvency and efficiency) are not significant. We obtain similar results for the other sectors considered in terms of the impact of the regulation, the exception being MFN, which is no longer significant, due to the already high competitive nature of the sector.
Two main concerns can be raised when considering this two-step exercise. Firstly, the outcome is impacted by the calculation of the STRI. Our weighting scheme based on the PCA is crucial here. To address this issue, we performed a robustness test consisting in replicating the whole exercise by using simple means of indicators. The magnitude of the estimated parameters does change as do the STRI values. But our results are overall robust to these changes. A different robustness test consists in using in our econometric estimations the STRI computed by other researchers, for the same countries and sectors. We relied on the Australian Productivity Commission calculations of STRI. Unfortunately, while this is possible for the distribution sector, the comparison is not direct in the case of the two telecom sub-sectors, as the difference is not made between mobile and fixed telecom in the Australian data. We thus aggregated our own indicators (using simple means) before performing estimations with this aggregated data and alternatively with the Australian data. Again our results were robust to these changes, though the precision of estimates for certain covariates (e.g. capital intensity) suffered from the aggregation of quite different sub-sectors.16
- Table 4 about here –
4 Calculating Tariff Equivalents
In this section we use both the value of the STRI for our selected emerging economies, for each of the three service sectors (see Section 2.1) and the average impact of the STRI on the price cost margin (the β coefficient for the STRI estimated above) to compute the ad valorem equivalents. The tariff equivalent applied by a given country c in a particular sector i is simply:
(2) 100 100 * 1 0 0
e
STRI PCM PCM PCM t c c c ic ic where PCM0c refers to the price cost margin related to country c were it to have a STRI of zero,
and all other factors were unchanged. More particularly, we rely on the coefficient estimated on the STRI when interaction with RTA and MFN are introduced and when more than one component is included in the construction of the STRI. In general, we use the coefficient in Column (6) of the tables in subsection 3.2. When the parameter on the MFN exemption is not significantly different from zero we rely on the estimation shown in Column 5.In terms of the value of STRI calculated in Section 2.1, in order to maintain compatibility with the regression results, we use the index calculated using the relevant principal components (results presented in the main text of this section).17
Another novelty of our approach is that we consider the effects of RTAs and, in the case of fixed telecom, the effects of MFN exemptions. We noted in the previous section that trade barriers
17 Alternatively, we tentatively included the results for the tariff equivalents using the STRI constructed
with all principal components. Obviously, in this case, the smaller sizes of the STRI translate into smaller tariff equivalents. Also, the estimated coefficient is associated with a standard error. In order to take this into account, we recalculated the tariff adding and subtracting to the value of the standard error, which gives us lower and upper values respectively for the protection. Indeed, any variation in impacts on the value of the tariff equivalent obtained. Results are available upon request.
combined with RTA, tend to have rent-creating effects. The combination of these coefficients leads to the results shown in Columns 2 and 3 in Table 5.
Before interpreting our results we must stress that the term “rent” is used is a rather loose way. MFN exemptions could lead to an increase in capital intensity, hence higher costs (e.g. an over-investment of incumbents in the network to deter potential future entrants). Our understanding is that the rent created by the policy measure is invested in entry deterrence. Based on this information we calculated what we refer to in Tables 4 to 6 as the “Preferential margin”, that is, the preference granted by the importing country to the countries with which it signed an RTA. In the case of the fixed telecom sector, we can also compute the ad valorem rent provided to local producers through the MFN exemption.
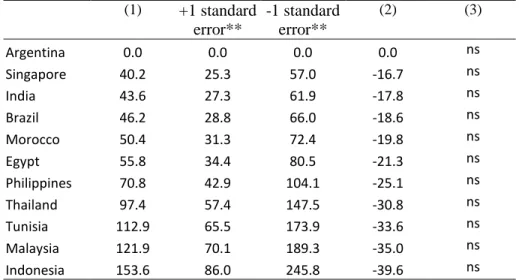
According to our calculations, Argentina, Singapore and Brazil seem to be the least protected economies in all three sectors studied.
The outcome for fixed telecom for Argentina, although in line with previous studies (Dihel and and Sheperd, 2007), is rather surprising bearing in mind the dominant position of historical providers in the sector.18 However, the result can be explained by the lack of information on
restrictive regulation enforced by this Latin American country, or by the way that the qualitative information is coded. Finally, the calculation of STRI index is also affected by the way the PCA weights the various responses.
Columns (2) and (3) in Table 5, provide two complementary pieces of information. Column (2) presents the percentage equivalent of the regulatory preferential margin associated to the presence of an RTA. For the partner countries having signed an RTA comprising clauses concerning the sector, the impact on firms providing services in the considered country is positive. Note that this impact is never large enough to overcome the negative impact of the regulation. But the
18 Information on the market share of the three historical providers (90% in the mid-2000s) in
interesting outcome is that providers of services originating from third countries are excluded from this preferential treatment. In addition, Column (3) presents the percentage equivalent of the sum of the regulatory preferential margin and the rent conceded to domestic producers as a result of MFN exemption. Hence, the difference between Columns (3) and (2) represents the rent accruing to domestic provider of services in the considered country. This rent is quite large for India, Indonesia, Morocco and Philippines.
The rent-creating effect of MFN exemptions is not significant in the regressions for the mobile telecom and distribution sectors, which makes it impossible to compute the rent creating effect of this distortion (Tables 5-6).
-Table 5 about here-
- Table 6 about here -
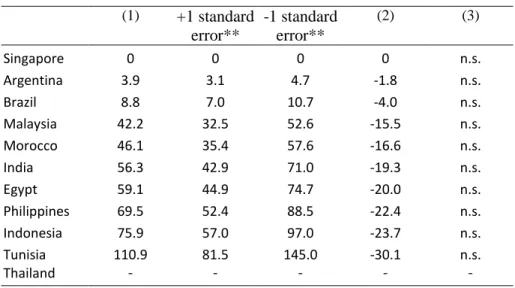
We observe that the level of revealed protection is highly sector specific. For instance, India is quite liberal in the mobile sector, but much stricter in the distribution sector. Tunisia has stricter regulation in distribution than for the fixed telecom sector.
Note that there is no ad valorem equivalent computed for Thailand in the distribution sector, since we could not use the questionnaire responses in this case.
-Table 7 about here –
Our paper is firstly related to works examining the impact of regulations and entries in the service sector on economic performance. Golub (2009) focus restrictions to foreign ownership and operational restrictions in various services industries ranging from Construction to Finance, and covers 73 developed and developing countries. These restrictions are scaled from 0 (open) to 1 (closed) for each sector-country pair. However, no tariff equivalent of these restrictions is provided. Our work concerns distribution services in emerging economies and is thus also related to studies addressing the relation between the provision of retail services and trade in goods.
Nordas et al. (2008) rely on a gravity model integrating a retail sector. It is shown that the entry of international retailers has a positive impact on bilateral trade between investing and host countries.
Finally our paper is even more tightly related to the growing literature on measuring the reforms regarding the provision of services in developing countries. Bottini et al. (2011) consider Egypt, Jordan, Morocco and Lebanon and compute trade restrictiveness indexes for the provision of services in the banking sector and in the fixed and mobile telecommunication sectors. The impact of these regulations on firm performance is used to estimate tax equivalents of service restrictions by sector. They obtain tariff equivalents in the foxed telecom sector ranging from 23% to 89% depending of the country and assumptions and 43% to 356% in the mobile sector. This compares with our values of respectively 0% to 141% and 0% to 153%. For the two countries present in both samples, we obtain 62% and 50% for Morocco (33% and 52% with Bottini et al aggregate measure) and 58% and 55% for Egypt (resp. 101% and 52%). Though reference years, questionnaires and methods differ, these estimates do not differ dramatically. This convergence in the results points to the gains for policy makers and researchers of a more systematic measurement of regulation in services at the detailed level.
5 Conclusion
The objective of this paper was to compute ad valorem equivalents for the regulation in three service sectors (i.e. fixed telecom, mobile telecom, distribution) applied by a group of emerging countries. We start with qualitative information on the restrictions applied by each country in each sector on the basis of which we applied a multivariate statistical approach, PCA, to transform this qualitative data into a synthetic index (STRI).
We extracted as much information as possible from the original data, based on a statistical criterion, weighting the different components based on their contribution to the whole variance. For this first stage we used detailed questionnaire responses provided by the Queen Mary University.
For the second stage, we used a large dataset provided by Dihel and Sheperd (2007) to estimate the average impact of STRI on firms` price-cost margins. The estimated parameters were used to compute ad valorem equivalents, by applying them to the STRIs previously calculated for the Queen Mary University survey. In addition to ad valorem equivalents of the regulation, our method provides ad valorem equivalents of the preferential margins and rents created by MFN exemptions clause.
The value added of our work is accordingly threefold. We provide a series of new tariff equivalents, based on qualitative information; a coding structure to guide future qualitative studies is provided; we propose technical improvements to the estimation of restrictiveness indices and their impact on price cost margins.
References
Bernard A. , Eaton J., Jensen J., Kortum S. (2003), Plants and Productivity in International Trade, American Economic Review, 93(4): 1268–1290.
Bottini, N., Marouani M.A., Munro L. (2011), Service Sector Restrictiveness and Economic Performance: An Estimation for the MENA Region, The World Economy: 1652-1678.
Copenhagen Economics (2005), Economic Assessment of the Barriers of the Internal Market for Services. Final Report, Copenhagen, January.
Cowling K., Waterson M. (1976), Price-Cost Margins and Market Structure, Economica, New Series, 43(171): 267-274
Dihel N., Sheperd B. (2007), Modal estimates of services barriers. OECD, Trade Policy Working Paper, 51.
Golub S. (2009), Openness to Foreign Direct Investment in Services: An International Comparative Analysis, The World Economy: 1245-1268.
Gonenc R. and Nicoletti G. (2000), Regulation Market Structure and Performance in Air Passenger Transport, Working Paper 254, ECO/WKP(2000)27, Economics Department, OECD. Kalirajan K. (2000), Restriction on Trade in Distribution Services, Productivity Commission Staff Research Paper 1638, AusInfo, Camberra, August.
Khalilzadeh-Shirazi J. (1974), Market Structure and Price-Cost Margins in United Kingdom Manufacturing Industries, Review of Economics and Statistics, 56(1): 67-76.
Kox H.L.M., Nordas H.K. (2007), Services trade and domestic regulation, Munich Personal RePEc Archive, http://mpra.ub.uni-muenchen.de/2116/
Marouani, M. and Munro L. (2009), Assessing barriers to trade in Services in the Mena Region, OECD Trade Policy Working Paper, 87.
Melitz M., Ottaviano G. (2008), Market Size, Trade, and Productivity, Review of Economic Studies, 75(1): 295–316.
Nordås, H. K., Geloso-Grosso M., Pinali E. (2008), Market Structure in the Distribution Sector and Merchandise Trade, OECD Trade Policy Working Papers 68, OECD.
Queen Mary University of London and Development Solutions (2009), Study of the existing Level of Liberalisation in Selected Services Sectors, Final Report for the DG Trade.
Steiner F. (2000), Regulation Industry structure and performance in the Electricity Supply Industry, Working Paper 238, ECO/WKP(2000)11, OECD, Paris.
Warren T. (2000) The impact on Output of impediments of Trade in Telecommunications Services, in Findlay, C. and Warren T. (eds.) (2000), Impediments in Trade in Services: Measurement and Policy Implications, Routledge, London.
Woolridge J. (2003), Cluster Sample Methods in Applied Econometrics, American Economic Review, 93(2): 133-138.
Tables
Table 1: STRI with one component, weighted components and simple mean
Telecom Fix
Country Argentina Brazil Egypt India Indonesia Malaysia Morocco Philippines Singapore Thailand Tunisia
STRI_pc1 1.04 7.70 1.39 0.00 0.63 1.33 2.54 2.05 1.64 3.08 2.36 STRI_pc1_pc4 0.00 0.48 1.64 1.65 1.65 2.47 1.74 1.98 0.42 3.15 0.67 STRI_all_pc 0.00 0.41 1.40 1.36 1.36 2.05 1.21 1.54 0.21 2.40 0.65 Simple mean 0.08 0.26 0.31 0.16 0.14 0.48 0.33 0.35 0.38 0.31 0.22 Telecom Mobile
Country Argentina Brazil Egypt India Indonesia Malaysia Morocco Philippines Singapore Thailand Tunisia
STRI_pc1 0.00 2.15 0.56 2.34 4.21 4.29 3.25 1.88 0.35 2.49 6.28
STRI_pc1_pc4 0.00 1.30 1.52 1.24 3.19 2.73 1.40 1.83 1.16 2.33 2.59
STRI_all_pc 0.00 0.38 0.57 0.45 1.15 0.49 0.50 0.52 0.43 0.86 0.67
Simple mean 0.01 0.25 0.24 0.23 0.53 0.46 0.26 0.36 0.18 0.44 0.48
Distribution
Country Argentina Brazil Egypt India Indonesia Malaysia Morocco Philippines Singapore Thailand Tunisia
STRI_pc1 1.65 1.38 4.70 2.41 3.15 2.83 3.33 1.87 0.00 6.35
STRI_pc1_pc3 0.15 0.34 1.87 1.80 2.28 1.42 1.53 2.13 0.00 3.01
STRI_all_pc 0.09 0.15 1.53 1.47 1.61 1.06 1.42 0.92 0.00 2.01
Table 2: Results of estimation for the fixed telecom sector
Dep var : log firm level price-cost margins (1) (2) (3) (4) (5) (6) Productivity 0.0312 0.0601 0.0714 0.0330 0.0610 0.0904 (0.106) (0.112) (0.113) (0.104) (0.106) (0.112) Market share 0.0753** 0.0712* 0.0645* 0.0740** 0.0712** 0.0710** (0.0313) (0.0345) (0.0325) (0.0303) (0.0328) (0.0306) Sales growth 0.395* 0.353* 0.300 0.394* 0.357* 0.311* (0.222) (0.196) (0.178) (0.218) (0.195) (0.176) Capital intensity 0.658*** 0.643*** 0.635*** 0.660*** 0.641*** 0.618*** (0.0952) (0.0886) (0.0842) (0.0960) (0.0893) (0.0775) STRI_1 -0.0435 -0.201*** -0.194*** (0.0721) (0.0281) (0.0283) STRI_1*RTA 0.226*** 0.203*** (0.0657) (0.0702) STRI_1*MFN 0.182* (0.0885) STRI_weighted -0.0753 -0.322*** -0.280*** (0.125) (0.0500) (0.0433) STRI_weighted*RTA 0.374*** 0.343*** (0.0923) (0.0914) STRI_weighted*MFN 0.324* (0.167) Constant -1.489** -1.707** -1.844** -1.471** -1.739** -2.080*** (0.621) (0.679) (0.678) (0.621) (0.646) (0.625) Observations 99 99 99 99 99 99 R-squared 0.436 0.454 0.462 0.436 0.454 0.473
Robust standard errors in parentheses *** p<0.01, ** p<0.05, * p<0.1
Table 3: Results of estimation for the mobile telecom sector
Dep var : log firm level price-cost margins (1) (2) (3) (4) (5) (6) Productivity 0.158 0.135 0.135 0.158 0.126 0.143 (0.123) (0.125) (0.127) (0.117) (0.117) (0.130) Market share 0.0776*** 0.0761*** 0.0777*** 0.0767*** 0.0758*** 0.0836*** (0.0222) (0.0211) (0.0222) (0.0223) (0.0214) (0.0252) Sales growth 0.351 0.211 0.194 0.362 0.243 0.226 (0.237) (0.176) (0.180) (0.236) (0.189) (0.182) Capital intensity 0.613*** 0.615*** 0.607*** 0.613*** 0.611*** 0.579*** (0.115) (0.116) (0.115) (0.114) (0.117) (0.109) STRI_1 0.0143 -0.181*** -0.180*** (0.0553) (0.0490) (0.0484) STRI_1*RTA 0.250*** 0.240*** (0.0387) (0.0407) STRI_1*MFN 0.0624 (0.0912) STRI_weighted 0.0501 -0.326*** -0.292*** (0.128) (0.102) (0.0973) STRI_weighted*RTA 0.507*** 0.450*** (0.0971) (0.123) STRI_weighted*MFN 0.224 (0.167) Constant -2.309*** -2.204*** -2.218** -2.348*** -2.260*** -2.421*** (0.768) (0.775) (0.789) (0.729) (0.725) (0.797) Observations 91 91 91 91 91 91 R-squared 0.412 0.439 0.440 0.412 0.439 0.449
Robust standard errors in parentheses *** p<0.01, ** p<0.05, * p<0.1
Table 4: Results of estimation for the distribution sector
Dep var : log firm level price-cost margins (1) (2) (3) (4) (5) (6) Sales growth 0.184*** 0.205*** 0.194*** 0.186*** 0.194*** 0.176*** (0.0423) (0.0432) (0.0461) (0.0388) (0.0462) (0.0520) Market share 0.000873 0.0161* 0.0175 0.00359 0.0176 0.0172* (0.0107) (0.00837) (0.0124) (0.0119) (0.0112) (0.00886) Capital intensity 0.609*** 0.617*** 0.639*** 0.636*** 0.646*** 0.647*** (0.0342) (0.0264) (0.0319) (0.0428) (0.0317) (0.0246) Productivity -0.144** -0.192*** -0.154*** -0.118** -0.157*** -0.144*** (0.0529) (0.0485) (0.0417) (0.0460) (0.0416) (0.0485) Efficiency -0.0112 -0.0128 -0.0223 -0.0206 -0.0198 -5.66e-05 (0.0336) (0.0319) (0.0313) (0.0279) (0.0295) (0.0297) Solvency -0.0360 -0.0386 -0.0327 -0.0240 -0.0338 (0.0269) (0.0233) (0.0229) (0.0274) (0.0220) STRI_1 -0.0710* -0.141*** -0.139*** (0.0413) (0.0322) (0.0321) STRI_1*RTA 0.131*** 0.0919*** (0.0267) (0.0232) STRI_1*MFN 0.0661* (0.0337) STRI_weighted -0.154** -0.248*** -0.247*** (0.0719) (0.0500) (0.0470) STRI_weighted *RTA 0.129*** 0.116*** (0.0311) (0.0365) STRI_weighted *MFN 0.0665 (0.0422) Constant -0.840** -0.519 -0.735*** -0.969*** -0.606** -0.763** (0.312) (0.304) (0.247) (0.283) (0.260) (0.293) Observations 388 360 360 388 360 390 R-squared 0.499 0.583 0.588 0.506 0.588 0.567
Robust standard errors in parentheses *** p<0.01, ** p<0.05, * p<0.1
Table 5: Tariff equivalents of regulations in the fixed telecom sector (1) +1 standard error** -1 standard error** (2) (3) Argentina 0.0 0.0 0.0 0.0 0.0 Singapore 12.5 10.4 14.5 -2.6 -15.0 Brazil 14.3 11.9 16.7 -3.0 -16.8 Tunisia 20.7 17.2 24.2 -4.1 -22.9 Egypt 58.2 47.3 69.8 -9.8 -46.9 India 58.9 47.9 70.6 -9.9 -47.3 Indonesia 58.9 47.9 70.7 -9.9 -47.3 Morocco 62.7 50.9 75.5 -10.4 -49.0 Philippines 74.2 59.9 89.8 -11.7 -53.6 Malaysia 99.4 79.2 121.9 -14.4 -61.5 Thailand 141.3 110.5 176.5 -18.0 -70.4 Note:
(1): Average impact of regulations applied to countries where there is no RTA (2): Regulatory preferential margin in presence of RTA
(3): Sum of regulatory preferential margin and rent from MFN exemption
**: the tariff equivalent is calculated adding and subtracting to the value of its standard error
Table 6: Tariff equivalents of regulations in the mobile telecom sector
(1) +1 standard error** -1 standard error** (2) (3) Argentina 0.0 0.0 0.0 0.0 ns Singapore 40.2 25.3 57.0 -16.7 ns India 43.6 27.3 61.9 -17.8 ns Brazil 46.2 28.8 66.0 -18.6 ns Morocco 50.4 31.3 72.4 -19.8 ns Egypt 55.8 34.4 80.5 -21.3 ns Philippines 70.8 42.9 104.1 -25.1 ns Thailand 97.4 57.4 147.5 -30.8 ns Tunisia 112.9 65.5 173.9 -33.6 ns Malaysia 121.9 70.1 189.3 -35.0 ns Indonesia 153.6 86.0 245.8 -39.6 ns Note:
(1): Average impact of regulations applied to countries where there is no RTA (2): Regulatory preferential margin in presence of RTA
(3): Sum of regulatory preferential margin and rent from MFN exemption
Table 7: Tariff equivalents of regulations in the distribution sector (1) +1 standard error** -1 standard error** (2) (3) Singapore 0 0 0 0 n.s. Argentina 3.9 3.1 4.7 -1.8 n.s. Brazil 8.8 7.0 10.7 -4.0 n.s. Malaysia 42.2 32.5 52.6 -15.5 n.s. Morocco 46.1 35.4 57.6 -16.6 n.s. India 56.3 42.9 71.0 -19.3 n.s. Egypt 59.1 44.9 74.7 -20.0 n.s. Philippines 69.5 52.4 88.5 -22.4 n.s. Indonesia 75.9 57.0 97.0 -23.7 n.s. Tunisia 110.9 81.5 145.0 -30.1 n.s. Thailand - - - - - Note:
(1): Average impact of regulations applied to countries where there is no RTA (2): Regulatory preferential margin in presence of RTA
(3): Sum of regulatory preferential margin and rent from MFN exemption
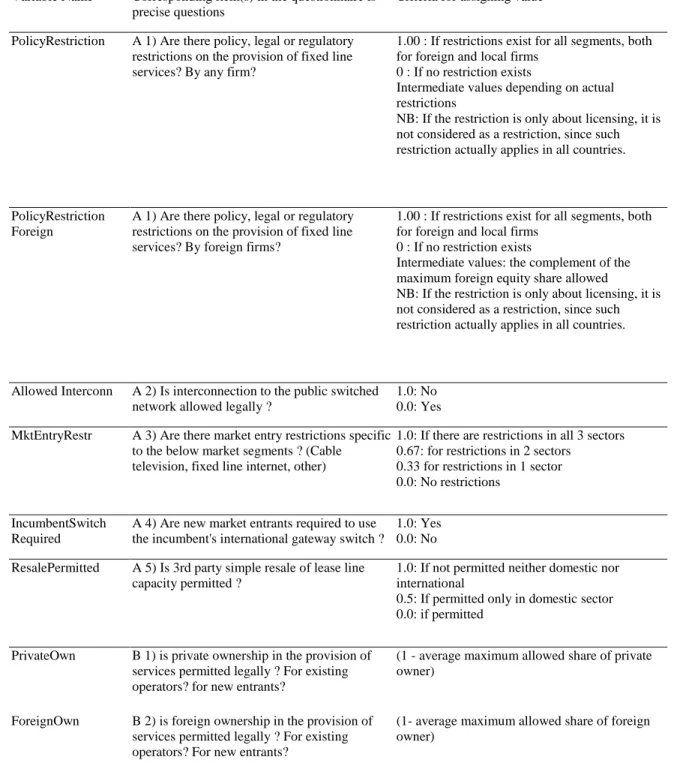
Appendix 1: Components of the restrictiveness indices
Table A-1 Coding scheme for fixed telecom
Variable Name Corresponding item(s) in the questionnaire is precise questions
Criteria for assigning value
PolicyRestriction A 1) Are there policy, legal or regulatory restrictions on the provision of fixed line services? By any firm?
1.00 : If restrictions exist for all segments, both for foreign and local firms
0 : If no restriction exists
Intermediate values depending on actual restrictions
NB: If the restriction is only about licensing, it is not considered as a restriction, since such restriction actually applies in all countries.
PolicyRestriction Foreign
A 1) Are there policy, legal or regulatory restrictions on the provision of fixed line services? By foreign firms?
1.00 : If restrictions exist for all segments, both for foreign and local firms
0 : If no restriction exists
Intermediate values: the complement of the maximum foreign equity share allowed
NB: If the restriction is only about licensing, it is not considered as a restriction, since such restriction actually applies in all countries.
Allowed Interconn A 2) Is interconnection to the public switched network allowed legally ?
1.0: No 0.0: Yes MktEntryRestr A 3) Are there market entry restrictions specific
to the below market segments ? (Cable television, fixed line internet, other)
1.0: If there are restrictions in all 3 sectors 0.67: for restrictions in 2 sectors
0.33 for restrictions in 1 sector 0.0: No restrictions
IncumbentSwitch Required
A 4) Are new market entrants required to use the incumbent's international gateway switch ?
1.0: Yes 0.0: No ResalePermitted A 5) Is 3rd party simple resale of lease line
capacity permitted ?
1.0: If not permitted neither domestic nor international
0.5: If permitted only in domestic sector 0.0: if permitted
PrivateOwn B 1) is private ownership in the provision of services permitted legally ? For existing operators? for new entrants?
(1 - average maximum allowed share of private owner)
ForeignOwn B 2) is foreign ownership in the provision of services permitted legally ? For existing operators? For new entrants?
(1- average maximum allowed share of foreign owner)
ForeignEqRestr B 3) Are there foreign equity restrictions on companies offering services in multiple market segments (local, long distance, international, leased line, internet services) ?
1.0: Yes 0.0: No
WTORefPaper C 2) a) Has the WTO's paper been adopted ? 1.0: No
decrease by 0.1 for each checked item in the list 0.0: Yes
LicensingProcedures C) 4) a)What are the main criteria/procedures new entrants must satisfy to be granted a service license?
0.1: license fee
+0.1: competitive tender +0.2: economic needs test +0.1: submission of information +0.5 discretionary decision by authority
Internet License C 4) b) is there a licensing regime for internet service providers?
1.0: Yes 0.0: No DifferentForeign
Criteria
C 4) d) are foreign firms subject to different licensing criteria than domestic firms?
1.0: Yes 0.0: No Exclusivity C 4) e) Do licenses grant exclusivity periods in
all or some market segments?
1.0: Yes 0.0: No GatewaysOwn C 5) b) are service providers (beside
incumbents) allowed to own or lease their own international data gateways?
1.0: No 0.0: Yes
Tariffs C 6) a) how are end-user tariffs determined? andC 6) b) are end-user tariffs set by
0.0: if market forces alone
0.5: if a price cap is set by regulator, or regulator's approval is required 1.0: if tariffs are set by regulator
Transparency C 7) a) which of the following are consulted in advance of regulatory decisions?
C 7) b) how are regulatory decisions and laws made public ?
1.0: not transparent 0.0: very transparent
UniversalService D 2) what policy instruments are used to ensure universal service?
D 4) How is the universal service provider selected?
0.0: Subsidies to operator, based on competitive tender with publicly available criteria
0.2: Roll-out obligations included in licensing, with subsidies
0.5: roll-out obligations without subsidies 1.0: subsidies to operator, without competition (for example only incumbent operator)

![Crises sanitaires, résilience et refondation des systèmes alimentaires [Editorial]](data:image/gif;base64,R0lGODlhAQABAIAAAP///wAAACH5BAEAAAAALAAAAAABAAEAAAICRAEAOw==)