Abstract.
Abstract.
Recently, new cycles have been observed in air temperature data and proxy series using a wavelet-based methodology. Although many evidences attest the validity of
this method applied to climatic data, no systematic study of its efficiency has been carried out. Here, we estimate the confidence levels for this approach and show that the
observed cycles are significant.
Confidence Levels for the Cycles Found in Air Temperature Data
Confidence Levels for the Cycles Found in Air Temperature Data
G. Mabille (1), X. Fettweis (1), M. Erpicum (1), and S. Nicolay (2)
(1) Dpt. of Geography, Université de Liège, Belgium ([email protected]),
(2) Dpt. of Mathematics, Université de Liège, Belgium ([email protected])
Recently, two cycles of respectively 30 and 42 months have been observed on the whole planet in temperature time series (at least one cycle is observed in either data set, see Nicolay et al (2009), Mabille and Nicolay (2009)). The methodology leading to these observations is a wavelet-based approach, allowing to study non-stationary signals (see Poster XY306).
However, these cycles are still observed in the associated surrogated data. Therefore, they should be observed in the Fourier transform of the original signals as well. The reason why they are not could be the following:
● the data are subject to trends; unlike the wavelet transform, the Fourier transform is affected by such behaviors,
● these low amplitude cycles are hidden by the dominating cycle of 1 year.
In order, to minimize these influences, the signals have been post-treated as follows: ● the linear trends have been removed,
● for each month, the mean temperature has been computed and subtracted to the original signal.
The Fourier transform of the so-obtained series now displays the expected cycles of 30 and 42 months approximatively (see Fig. 1).
To test the significance of these cycles, the following methodology has been used: ● for each grid point, the monthly means of the data are removed, as well
as the linear tendencies.
● the resulting noise is simulated using an AR(1) model:
where ηn is a Gaussian white noise with zero mean and unit variance, ● N=10000 such simulations are computed,
● the distribution of the two highest maxima of the Fourier transform of the data is estimated,
● the probability that a maximum has a higher amplitude than the one observed for the ncep/ncar reanalysis is then computed.
Fig. 3 shows these probability values. Most of the observed cycles are significant. The same methodology can be applied to the wavelet transform. In this case, the monthly means are added to the AR(1) process and the resulting signal is directly compared to the original data. The results are similar.
x
n=
x
n−1
n,
Such a treatment has been applied to each grid point of the ncep/ncar reanalysis temperature data. The Fourier spectrum allows to check that most of these points display a cycle corresponding to either 30 or 42 months (see Fig. 2). Moreover, the results are very close to the ones obtained using a wavelet-based approach (see Poster XY306, Nicolay et al (2009), Mabille and Nicolay (2009)).
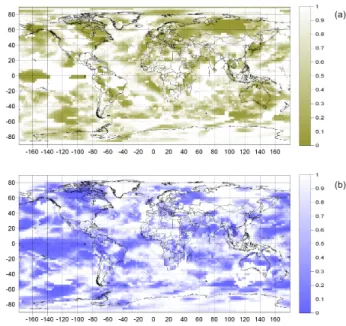
Fig 3. The probability values associated to the cycles of (a) 30 months and (b) 42
months respectively (see text). Cycles observed in zones corresponding to the color white are not significant.
Fig 2. The cycles observed on the planisphere using the Fourier transform
corresponding to the period of (a) 30 months and (b) 42 months. The color palette is going from white if no cycle is observed to khaki (resp. blue) if a cycle of 30 (resp. 42) months is observed.
Fig 1. (a) The Fourier spectrum of the Jakutsk weather station (Siberia). The main
peak corresponds to the period of 1 year, (b) the Fourier spectrum of the same data modified as described in the text. Although the peak corresponding to 1 year is still visible, a second maximum corresponding to approximately 30 months (x=1/30) is also detected.
References.
References.
● S. Nicolay, G. Mabille, X. Fettweis and M. Erpicum, 30 and 43 months period cycles found in air temperature time series using the Morlet wavelet method,
Climate Dynamics, 33, 1117-1129, 2009,
● G. Mabille and S. Nicolay, Multi-year cycles observed in air temperature data and proxy series,
The European Physical Journal Special Topics, 174, 135-145, 2009,
XY 305
Acknowledgements.
Acknowledgements.
The authors would like to thank P. Ditlevsen for providing fruitful discussions.
(a) (b)
(a)
(b)
(a)