CRaTER: The Cosmic Ray Telescope for the Effects of Radiation
Experiment on the Lunar Reconnaissance Orbiter Mission
The MIT Faculty has made this article openly available.
Please share
how this access benefits you. Your story matters.
Citation
Spence, H. E. et al. “CRaTER: The Cosmic Ray Telescope for the
Effects of Radiation Experiment on the Lunar Reconnaissance
Orbiter Mission.” Space Science Reviews 150.1-4 (2010) : 243-284.
As Published
http://dx.doi.org/10.1007/s11214-009-9584-8
Publisher
Springer Netherlands
Version
Author's final manuscript
Citable link
http://hdl.handle.net/1721.1/65889
Terms of Use
Creative Commons Attribution-Noncommercial-Share Alike 3.0
1
CRaTER: The Cosmic Ray Telescope for the Effects of Radiation
Experiment on the Lunar Reconnaissance Orbiter Mission
H. E. SPENCE, A.CASE, M. J. GOLIGHTLY, T. HEINE, B. A. LARSEN
Boston UniversityJ. B. BLAKE, P. CARANZA, W.R. CRAIN, J. GEORGE, M. LALIC,
A. LIN, M. D. LOOPER, J. E. MAZUR, D. SALVAGGIO
The Aerospace Corporation
J. C. KASPER
Harvard-Smithsonian Center for Astrophysics
T. J. STUBBS
University of Maryland, Baltimore County and NASA/Goddard Space Flight Center
M. DOUCETTE, P. FORD, R.FOSTER, R. GOEKE, D. GORDON, B. KLATT, J. O’CONNOR, M. SMITH
Massachusetts Institute of TechnologyT. ONSAGER
NOAA Spaceweather Prediction Center
C. ZEITLIN
Southwest Research Institute
L. TOWNSEND, Y. CHARARA
University of Tennessee, Knoxville2 Abstract.
The Cosmic Ray Telescope for the Effects of Radiation (CRaTER) on the Lunar Reconnaissance Orbiter (LRO) characterizes the radiation environment to be experienced by humans during future lunar missions. CRaTER measures the effects of ionizing energy loss in matter due to penetrating solar energetic protons (SEP) and galactic cosmic rays (GCR), specifically in silicon solid-state detectors and after interactions with tissue-equivalent plastic (TEP), a synthetic analog of human tissue. The CRaTER investigation quantifies the linear energy transfer (LET) spectrum in these materials through direct measurements with the lunar space radiation environment, particularly the interactions of ions with energies above 10 MeV, which penetrate and are detected by CRaTER. Combined with models of radiation transport through materials, CRaTER LET measurements constrain models of the biological effects of ionizing radiation in the lunar environment as well as provide valuable information on radiation effects on electronic systems in deep space. In addition to these human exploration goals, CRaTER measurements also provide new insights on the spatial and temporal variability of the SEP and GCR populations and their interactions with the lunar surface. We present here an overview of the CRaTER science goals and investigation, including: an instrument description; observation strategies; instrument testing, characterization, and calibration; and data analysis, interpretation, and modeling plans.
3
Contents
1 Introduction ... 5
2 Investigation Description ... 6
2.1 Linear Energy Transfer and the LET Spectrometer ... 6
2.2 Measurement Objectives ... 8 2.3 Anticipated Results ... 8 3 Instrument Description ... 9 3.1 Telescope Design ... 11 3.1.1 Overview ... 11 3.1.2 Detectors ... 13
3.1.3 Tissue Equivalent Plastic and Composition of CRaTER materials ... 15
3.1.4 Fields of View and Geometric Factors ... 16
3.2 Electrical Design ... 18
3.2.1 Overview ... 18
3.2.2 Telescope Board ... 18
3.2.3 Analog Processing Board ... 19
3.2.4 Digital Processing Board... 19
3.2.5 Power ... 19
3.3 CRaTER Measurements ... 20
3.3.1 Overview ... 20
3.3.2 Measurement Sequence ... 20
3.3.3 Science Data Products ... 20
3.3.4 Instrument Housekeeping ... 21
3.3.5 Commands ... 22
3.3.6 Observation Strategy ... 22
4 Instrument Testing, Characterization, and Calibration ... 23
4.1 Instrument Characterization ... 24
4.1.1 Linearity of the Pulse Shaping ... 24
4.1.2 Electronics Noise Level ... 25
4.1.3 Stability ... 25
4.1.4 Temperature Dependence ... 25
4
4.3 Calibration ... 26
5 Data Analysis, Interpretation, and Modeling ... 29
6 Discussion and Summary ... 31
6.1 Other Representative Science Goals ... 31
6.1.1 Lunar-Plasma Environment Interactions ... 31
6.1.2 Sources of Galactic Cosmic Ray Variability ... 32
6.1.3 Solar Proton Studies ... 32
6.1.4 Exploring Surface Interactions with Secondaries ... 33
6.1.5 Comparative Studies of Lunar and Martian Radiation Environment ... 33
6.2 Summary ... 34
7 Acknowledgments ... 34
8 References ... 35
9 Tables ... 38
5
1 Introduction
The Lunar Reconnaissance Orbiter (LRO) mission obtains exploration-enabling observations needed to facilitate returning humans safely to the Moon as part of NASA’s longer-term Exploration Initiative. A NASA-established LRO Objectives/Requirements Definition Team (ORDT) identifies the following high-priority objective for this initial robotic mission in the Lunar Exploration Program (LEP): "Characterization of the global lunar radiation environment and its biological impacts and potential mitigation, as well as investigation of shielding capabilities and validation of other deep space radiation mitigation strategies involving materials." This critically-important LRO objective selected by the ORDT traces to earlier NASA planning documents, including the 1998 “Strategic Program Plan for Space Radiation Health Research” (Life Sciences Division, Office of Life and Microgravity Sciences and Applications, National Aeronautics and Space Administration). Appendix H of that document summarizes the most critical questions concerning space radiation and its broad impact on all NASA activities. Strategic questions in the categories of space radiation environment, nuclear interactions, and human effects include:
• For a given mission, what are the fluxes of galactic cosmic rays (GCR) in interplanetary space as a function of particle energy, linear energy transfer (LET), and solar cycle?
• What are the doses related to heavy ions in deep space?
• How is a radiation field transformed as a function of depth in different materials? • What are the optimal ways of calculating the transport of radiation through materials?
• What will the radiation environment be within the space vehicle, and what factors influence the flux, energy, and linear energy transfer spectrum of radiation?
The importance of this LRO objective and related outstanding questions is underscored in more recent NASA planning documents, such as the 2005 "Bioastronautics Roadmap: A Risk Reduction Strategy for Human Space Exploration". That document outlines several key goals including the development of new measurement approaches required for understanding the spectral properties of penetrating space radiation, and validating radiation shielding designs needed to define risk levels on exploratory-class missions and for risk mitigation. To date, these vitally important goals and questions remain open, in part because of limits in our ability to understand and simulate the evolution of radiation in space as it passes through human tissue. We are limited not only by scarce information about the cross sections for nuclear fragmentations at high energies but also by the lack of targeted observational data required to constrain radiation transport models. While much is known and understood about radiation exposure in low earth orbit (c.f., Badhwar et al., 1996; Golightly et al., 1994), comparatively little is known at the Moon and in deep space.
The Cosmic Ray Telescope for the Effects of Radiation (CRaTER) instrument is designed to characterize the global lunar radiation environment and its biological impacts. CRaTER investigates the effects of galactic cosmic rays (GCR), solar energetic protons (SEP), and any secondary radiation produced by interactions between GCRs and SEPs at the lunar surface on tissue equivalent plastic (TEP) as a constraint for models of biological response to radiation in the lunar environment. CRaTER
6
accomplishes this by producing linear energy transfer (LET) spectra over a wide dynamic range behind different areal densities of TEP and under different levels of solar activity and GCR flux. Functionally, CRaTER consists of a stack of circular silicon semiconductor detectors and cylindrical sections of TEP arranged so the ends of the stack have unobscured views of deep space and the lunar surface. Radiation passing through the stack, including ions and electrons, and to a lesser extent neutrons and gamma-rays, loses energy while passing through the silicon detectors. When ionizing radiation passes through a detector a signal is produced that is proportional to the total energy Δ𝐸 lost in the detector. Combined with the thickness Δ𝑥 of the detector, an approximate LET is determined for the single particle as 𝐿𝐸𝑇 = Δ𝐸/Δ𝑥. Detectors are in pairs, with a thin detector connected to a low gain amplifier and a thick detector connected to a high gain amplifier. Together, the detector pairs and associated amplifiers make CRaTER sensitive to a broad range of LET from approximately 0.1 𝑘𝑒𝑉 𝜇𝑚−1 to 2.2 𝑀𝑒𝑉 𝜇𝑚−1. By combining signals from different detectors to identify the path of individual particles, CRaTER can be used to understand how radiation loss evolves in human tissue and how dose rates change during periods of heightened solar activity and ultimately over the course of the solar cycle. Key unique capabilities of CRaTER are the inclusion of the TEP to make biologically relevant radiation measurements and a telemetry rate sufficient to capture high resolution LET values for up to 1,200 events per second. Whereas previous instruments were hampered by the need to reduce LET resolution or the number of events recorded owing to telemetry constraints, CRaTER will be able to produce spectra with high resolution in both LET and time.
This paper is structured as follows. Section 2 describes the CRaTER investigation, from science goals to measurement requirements and data products. We motivate the measurements needed and the resulting instrument design and discuss our anticipated results. Section 3 describes the instrument, from the telescope stack of TEP and silicon detectors that measure LET through the electrical design and the measurement process, our observing strategy, and science and housekeeping data products. Section 4 describes the instrument testing, characterization, and calibration. Section 5 describes the science operations center, as well as the data analysis, interpretation, and modeling. Finally, in Section 6, we summarize briefly several representative science studies made possible by CRaTER's design - a design intended initially for exploration-enabling measurements, but also capable of high quality science measurements of energetic particle phenomena at and near the Moon.
2 Investigation Description
2.1 Linear Energy Transfer and the LET Spectrometer
The measurement goal of CRaTER is to produce linear energy transfer (LET) spectra. LET (Δ𝐸/ Δ𝑥) is the mean energy Δ𝐸 lost locally, per unit path length Δ𝑥, when a charged particle traverses material (LET is expressed in units of 𝑀𝑒𝑉 𝑔−1 𝑐𝑚2, or, in a given system with known areal density, in 𝑀𝑒𝑉 𝜇𝑚−1). An LET spectrometer measures the amount of energy lost in a detector of some known thickness and material property as a high energy particle passes through it, usually without stopping. While LET spectrometers do not (necessarily) resolve mass, LET measurements do include all the
7
species, with the possible exception of neutrons, that are relevant to the energy deposited behind a known amount of spacecraft shielding. Relevant LET spectra are a missing link, currently derived largely by models, and require experimental measurements to provide critical ground truth – CRaTER will provide this essential quantity needed for model closure. Before proceeding further, we comment on the distinction between CRaTER LET measurements and the instantaneous energy loss rate, 𝑑𝐸/𝑑𝑥. We recognize that instruments such as CRaTER typically cannot measure 𝑑𝐸/𝑑𝑥 directly because the detector has a finite thickness and the path length is not fully well-known for each particle detected. However, CRaTER is designed such that pathlength uncertainty is small (<10%). Additionally, by using sufficiently thin detectors, 𝑑𝐸/𝑑𝑥 is approximately constant within each detector. Consequently, as a large number of events are accumulated a spectrum of Δ𝐸/Δ𝑥 converges statistically to 𝑑𝐸/𝑑𝑥 (typically to within ~10%, the pathlength uncertainty).
As the particles comprising the solar and galactic cosmic ray environment penetrate shielding, whether the shielding is provided by spacecraft or habitat structure, or by an overlying atmosphere (such as on the Martian surface), or even by the body’s own tissue that overlays a critical body organ, they lose energy due to the myriad of Coulomb interactions between the charged ions penetrating the material and the atomic electrons attached to the atoms and molecules of the target materials, and their nuclei. As these penetrating ions slow, their rates of energy loss to the target medium begin to increase. Hence their LET increases. On occasion, the nuclei of these penetrating ions undergo nuclear collisions with the nuclei of the target atoms. Occasionally the collisions are elastic, but more often than not, they are highly inelastic resulting in fragmentation (breakup) of the colliding nuclei. These lighter fragments, having lower charge and mass numbers than the parent nucleus, have reduced energy losses per distance traveled in the target medium, i.e. their LET decreases. Thus, the overall effects of the shield materials on the LET spectra are a complicated mixture of competing processes, which tend to significantly alter the LET distribution, making measured LET spectra dependent on the type, quantity, and geometric configuration of shielding that the incident particle spectrum has penetrated as well as on variations in the incident spectrum itself. In general, material shielding tends to reduce the overall fluence of high LET particles and increase the fluence of lower LET particles, for incident solar and GCR spectra.
A variety of LET measurements behind various thicknesses and types of material is of great importance to spacecraft engineers, radiation health specialists, and to modelers who estimate impacts of the penetrating radiation. LET is one of the most important quantitative inputs to models for predicting human health risks and radiation effects in electronic devices. By relaxing the demand to measure the entire parent cosmic ray spectrum to one where only that part of the energy spectrum deposited in a certain thickness of material is needed, the challenging requirements of measuring total incident cosmic ray particle energy is removed. This change in focus greatly simplifies the complexity, cost, and volume of the required instrument. And, in addition to these savings, an LET spectrometer essentially provides the key direct measurement needed to bridge the gap between well measured cosmic ray intensities that will be available from other spacecraft and specific energy deposition behind shielding materials, vital exploration-enabling knowledge needed for the safety of future astronauts working in the harsh space radiation environment.
8
2.2 Measurement Objectives
The first high level LRO measurement objective relevant to CRaTER is that "The LRO shall characterize the deep space radiation environment at energies in excess of 10 MeV in lunar orbit, including neutron albedo". CRaTER is designed to measure the LET spectra of energetic particles across a range in charge and energy of biological relevance. One significant gap in knowledge of the deep space radiation environment is the uncertain LET spectra produced by the highest-energy, high-Z particles from both the Sun and the galaxy. While composition and variability of galactic cosmic rays above 10 MeV are fairly well defined, the spectra of the energetic component during intense solar energetic particle events is not well understood, demonstrates significant variability, and needs to be better specified. The current gap in understanding of this energetic component (> 10 MeV) is critically important. Thus, we aim to target > 10 MeV energies by virtue of their known damaging effects to man and machine and by virtue of their unpredictable time variability. CRaTER will provide measurements of the deep space radiation environment above 10 MeV with a primary focus on charged particles. The LEND instrument on LRO is designed specifically to characterize the radiation effects of neutrons, the remaining aspect of the first LRO measurement objective (Mitrofanov et al, 2009).
The second LRO objective relevant to CRaTER is: “The LRO shall measure the deposition of deep space radiation on human equivalent tissue while in the lunar orbit environment”. CRaTER will provide LET spectra behind different amounts and types of areal density, including tissue equivalent plastic. TEP is an inert solid substance that has radiation absorption characteristics similar to human tissue and has been used extensively in laboratory and space-based studies of radiation effects on humans. Understanding the evolution of the LET spectrum as it passes through human tissue is an important step in predicting, and possibly mitigating the effects of radiation on human bodies and spacecraft components. The pathlength through CRaTER's TEP represents the characteristic depth of radiation penetration to blood forming organs.
2.3 Anticipated Results
The exploration goal of CRaTER is to provide the first deep space validation of radiation transport models. CRaTER will do so by producing LET spectra for comparison with simulation predictions. This validation is critical for transport models that are used to design shielding and estimate astronaut radiation risks.
Radiation transport models that take solar and galactic energetic particle spectra and produce predictions of evolving LET spectra within materials serve a critical role in risk reduction for the manned space program. For example, Kim et al. [1994] evaluated shield designs by calculating LET spectra using the 1977 solar minimum GCR spectrum as input into the “HZETRN” code. This simulation showed that LET curves decreased with increased shield thickness for high LET values but that for low LET values, the LET distributions increased, rather than decreased, with increasing shield thickness. Predicted LET spectra are strong functions of both the materials used and uncertainties in nuclear processes. These
9
uncertainties are due to a lack of experimental data and to simplifications introduced into the models to speed up calculations. Simplified code is necessary to make the transport problem tractable and to permit exploration of a large number of possible configurations, but the simplifications also potentially limit model accuracy. The ability of these codes to accurately handle, for instance, spallation of heavy ions into lighter fragments and propagation through complex geometries and materials awaits experimental confirmation.
Once LET spectra data begin to be taken by CRaTER, the data can be used to aid in transport code validation for the lunar space radiation environment. Instruments on several NASA spacecraft such as ACE (Stone et al., 1998) and STEREO (Luhmann et al., 2007) as well as spacecraft from other agencies (e.g., NOAA–GOES) will be used to record the primary galactic and solar particle spectra contemporaneously. The populations measured at these high-altitude locations will serve as excellent proxies for the population of cosmic rays present at the lunar orbit at the same time (or at some easily calculated propagation time delay in the case of SEP events). Galactic cosmic rays are not considerably localized in space, so that measurements anywhere within several hundred Earth radii of the Moon will be sufficient. Transport models such as the HZETRN code developed at NASA Langley (J. W. Wilson et al., 1995) or the Monte Carlo code HETC-HEDS (Townsend et al., 2005), will then be used to predict the LET distributions seen by CRaTER. The comparison of our observed LET spectra with these predictions will allow us to provide closure between key measurements and models for understanding radiation effects.
To illustrate how CRaTER observations will be used to validate radiation transport models, Figure 1 shows a representative example of an LET spectrum. We created this spectrum using the Cosmic Ray Effects on MicroElectronics (CREME86) model with an input GCR spectrum based on the last solar minimum in 1996. The figure shows the LET spectrum in silicon expected behind 1mm of aluminum plotted in the same flux and LET units as planned for the CRaTER data products. Peaks in the spectrum are the result of major ion species (e.g., He) or ion groups (e.g., CNO). With such GCR rates, particularly for the heaviest ions that produce the largest and rarest response, LET spectra must be integrated over days, weeks, or months in order to resolve spectral features, intervals consistent with the one-year prime mapping duration of LRO. In later sections, we will show how CRaTER’s design, in particular the ability to process and return unprecedented volumes of particle energy deposits, enables the construction of accurate LET spectra also over short time intervals, including during intense SEP events.
3 Instrument Description
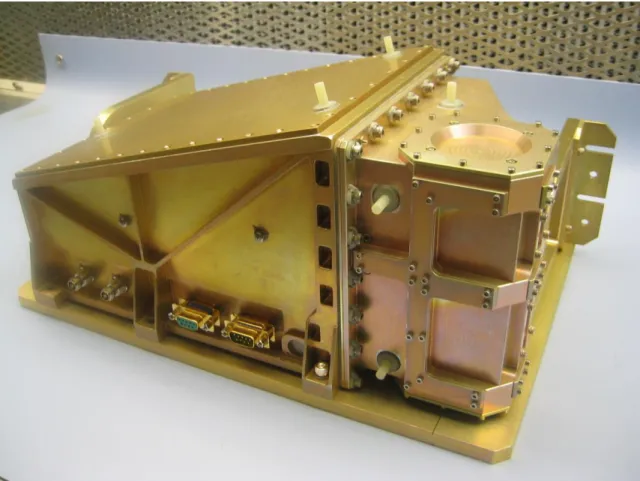
Figure 2 illustrates the overall mechanical design of CRaTER, which physically consists of an electronics box and a telescope assembly. The instrument consists of a rectangular electronics box (approximately 24.1 cm long by 23.0 cm wide by 15.9 cm tall) with a slanted top cover. The electronics box bolts to the spacecraft through six feet along the base. The CRaTER telescope assembly attaches to the electronics box (see right portion of Figure 2). The telescope assembly and the electronics box are assembled separately and then integrated into the flight configuration as shown. The nadir, or
lunar-10
viewing, aperture of the telescope is delineated by the circular area on top of the telescope assembly in Figure 2. A normal to the circular aperture defines the telescope axis, which remains aligned along the nadir-zenith line during regular in-flight operations while LRO is in lunar polar orbit.
The electronics box houses a digital processing board (DPB) and an analog processing board (APB). The DPB interfaces with the spacecraft through the four connecters seen near the lower edge of the electronics box in Figure 2. These connectors serve to relay commands and telemetry, to provide power, and to provide a timing signal to CRaTER.
Figure 3 illustrates in cross-section the elements internal to the telescope assembly. The telescope assembly holds the telescope stack and the telescope electronics board (TEB). The TEB (green area) connects the telescope to the electronics box, delivers bias voltages to the detectors, and sends detector signals and calibration pulses through preamplifiers back to the APB. The preamplifiers are highly sensitive and so it is desirable to limit electrical interference near the detectors. Therefore the telescope assembly is electrically isolated from the electronics box, and grounded on the same path as the signals from the preamplifiers to the APB. The telescope stack consists of aluminum caps on the nadir (top end cap in Figure 3) and zenith (bottom end cap) sides to shield the telescope detectors from low energy particles, followed by three pairs of thin and thick silicon detector pairs surrounding two sections of A-150 Tissue Equivalent Plastic (TEP) of different length (dark grey areas).
Figure 4 shows a functional block diagram of the entire CRaTER instrument, from detectors to the spacecraft bus; data flows from left to right in this block diagram. It shows the most critical components necessary for reliable functioning of the instrument. As described above, the telescope assembly houses the telescope stack of detectors and TEP, and the telescope board. The electronics box assembly houses the APB and the DPB. The APB shapes the pulses from each of the detector preamplifiers, further amplifies the signals, and generates calibration pulses for testing the response of each signal path. The DPB identifies and processes particle events and generates scientific measurements, controls power distribution within the instrument, records housekeeping data, and receives commands and sends telemetry to the spacecraft.
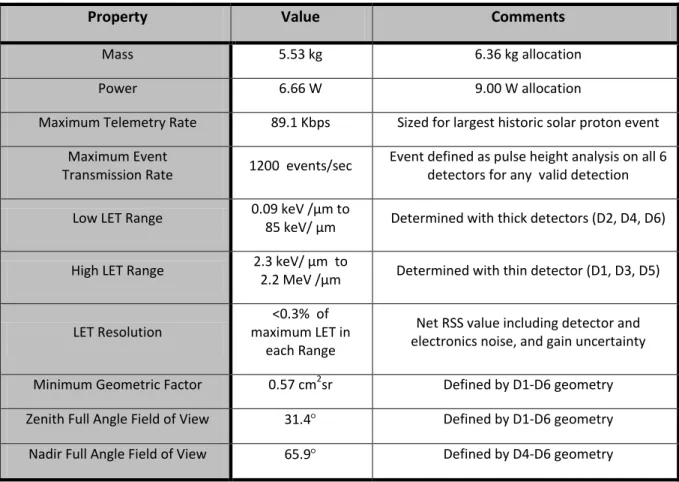
Table 1 summarizes the main properties of the CRaTER instrument, including physical resources, key design values, and measurement performance metrics. These quantities of the as-delivered flight model represent the optimal values resulting from science and engineering trade studies completed throughout the instrument development. The remainder of Section 3 describes details of the design which drive and determine the high-level values shown in Table 1.
3.1 Telescope Design
3.1.1 OverviewIn this section, we summarize the physical construction of CRaTER, with a focus on the sensing portion of the instrument, or the telescope assembly. As described in the instrument overview, CRaTER consists of two physical parts, the telescope assembly and the electronics box. The telescope is
11
mechanically mounted to the electronics box, but the two structures are electrically isolated from one another. The entire telescope assembly is instead grounded to the analog signal ground. This is done to reduce noise on the spacecraft chassis ground reaching the sensitive detectors and their preamplifiers.
As illustrated and identified in Figure 5, the CRaTER telescope stack consists of three pairs of thin and thick detectors surrounding two pieces of TEP. From the zenith side of the stack the components are the zenith shield (S1), the first pair of thin (D1) and thick (D2) detectors, the first TEP absorber (A1), the second pair of thin (D3) and thick (D4) detectors, the second TEP absorber (A2), the third pair of thin (D5) and thick (D6) detectors, and the final nadir shield (S2). We shall use these shorthand designations henceforth. With this configuration, paired thin and thick silicon detectors thereby measure the LET spectrum at three depths through the telescope stack. Section 3.1.2 reviews the detectors selected for CRaTER and discusses the need for the pairs of thin and thick detectors to cover the full range of LET possible in silicon. The three pairs of detectors cover the range in LET expected by SEP and GCR ions in silicon and after evolving through the telescope assembly, including passage through the dominant component, the TEP. Section 3.1.3 describes the A-150 Tissue Equivalent Plastic used as the human tissue analog and primary absorber. Section 3.1.4 describes the optimization of the location of components in the telescope stack.
Key factors guiding our design of the telescope stack were the total pathlength through TEP desired, the sizes of the different pieces of TEP, and the geometric factor and resulting sensitivity of the entire telescope. By requiring that the minimum energy of protons that can just exit the TEP be ~100 MeV and that the TEP rather than the silicon in the detectors dominates the areal density of the telescope stack, we identified a goal pathlength through the total amount of TEP in the telescope of ~60 mm. Our design divides the total TEP pathlength into two components of different length, 1/3 and 2/3 the total length of the TEP. If the total TEP is 71 mm in length, then the TEP section closest to deep space will have a length of approximately 54 mm and the second section of TEP will have a length of approximately 27 mm. A variety of LET measurements behind various thicknesses and types of material is of great importance to spacecraft engineers, radiation health specialists, and to modelers who estimate impacts of the penetrating radiation. Simulations suggested that splitting the TEP into two asymmetric components that are 1/3 and 2/3 the total length provides a useful combination of lengths, also similar to typical thicknesses through human tissue to depths of blood forming organs.
Statistically significant LET spectra should be accumulated over short enough time intervals to resolve dynamical features in the galactic cosmic ray (GCR) and solar energetic particle (SEP) flux. During quiescent intervals, the counting rate will be dominated by the slowly varying GCR light ions. With typical GCR fluxes expected for solar minimum conditions (Webber and Lezniak, 1974), a minimum geometric factor of 0.57 cm2sr (shown later to be the as-designed value) will yield LET rates of ~ 0.3 events/second from protons with incident energy sufficient to pass through the entire telescope. In one hour, a statistically significant sampling of ~1000 events would permit construction of longer-term average spectra; this one-hour interval is still short compared to typical GCR modulation timescales.
The geometric factor of a cylindrical telescope of this type is a function of both the distance between the detectors and the diameter of the detectors. We conducted a trade study to select the
12
diameter of the CRaTER detectors. Our study focused on the benefit of a larger diameter detector in the form of larger collecting areas and geometric factors, versus the risk of unacceptably high single particle fluxes during major solar energetic particle (SEP) events. While both protons and heavy ions are enhanced during SEP events, the flux of hydrogen is many orders of magnitude larger and their detection dominates the counting rates. The hydrogen therefore was the focus of this trade study.
The first thick detector in the zenith (deep space) direction, D2, is designed to detect protons and is therefore most susceptible to enhanced fluxes during SEP events. The other thick detectors lie behind shielding in the form of the TEP and telescope mass and ultimately the Moon below, and are therefore expected to have lower rates. The concern is not that the D2 detector could be damaged by the high flux, but rather that it could experience electronic pulse pileup, in which multiple protons pass through the detector within a detection interval and corrupt the signal. The predicted worst-case singles count rate for D2 is shown in Figure 6, estimated from the >10 MeV proton channel on the GOES spacecraft during the 225 most extreme SEP events over the last 33 years.. Peak, instantaneous (5 minute average) proton rates are combined with the D2 single-detector geometric factor (~30 cm2-sr) for this analysis We find that CRaTER’s normal operation mode is sufficient to robustly measure all particles for ~90% of the peak rates encountered during extreme SEP events. To recover the remaining 10%, CRaTER is deliberately designed to reconfigure in response to such especially high rates. If the D2 signal saturates and thereby would otherwise overwhelm event processing with low energy protons, CRaTER has additional features to avoid any decrease in the utility of the measurements returned to the ground; this rate event mode switching is described fully at the end of Section 3.3.6.
3.1.2 Detectors
CRaTER uses silicon semiconductor detectors to characterize the rate of energy loss of charged particles passing through the telescope. In this section we motivate our choice of detector thicknesses and the LET ranges the detectors are used to measure. We begin by reviewing the operating principles of semiconductor detectors. Figure 7 depicts a simplified detector cross-section illustrating the key components of the CRaTER detectors. At energies of interest to CRaTER, silicon semiconductor detectors are useful for characterizing the energy loss of ionizing radiation as it passes through or stops in it. In the CRaTER detectors, silicon is doped to make it a semiconductor, with electron-hole pairs in valance levels with energy levels much smaller than the first ionizing potential of an atom, making the detector much more sensitive than a proportional counter. The silicon is composed of both an N-type and a P-type substrate, making it a large diode that can be biased at a relatively high voltage with little leakage current.
When an energetic charged particle passes through the silicon, it liberates electron-hole pairs, which rapidly drift to either end of the detector in the electric field established by the bias voltage. The resulting signal from the drifting electron-hole pairs is linearly proportional to the total energy deposited. An analog circuit is then used to amplify these signals when they occur, and to stably and
13
accurately determine the height of each pulse in multiple detectors. Both detector types are ion-implanted, totally-depleted structures formed from an type substrate. The Phosphorous-implanted N-type substrate is the ohmic side of the detector and the Boron-implanted P-side is the junction. These impurities generally require lower implantation energies and thus result in low implant depths of about 0.3μm. Both detector areas are circular, have thin junction and ohmic windows, and have relatively fast timing capability, meaning that the electron hole pairs rapidly diffuse to the surfaces and provide a sharp signal to the electronics. Although fast timing is not critical for CRaTER, it is desired to have the metallization made in such a fashion as to reduce surface resistivity. There is a guard ring (indicated by the region labeled Guard) around the active junction to improve edge uniformity and a neighboring field plate ring to aid discharge of oxide stray charge. Each thin and thick detector mounts to its own small passive printed circuit board and connects to the telescope electronics board by a flexible cable.
Thin and thick detector pairs are used to span the entire range of LET and to provide a system that is less sensitive to low energy protons in the event of intense SEPs associated with solar flares and coronal mass ejections. The thickness of the thin detectors is approximately 150 microns while the thick detectors are approximately 1000 microns. The need for pairs of detectors arises from the large range in LET that ions can produce in silicon through ionizing radiation and from the different amplitudes of energy loss expected from light and heavy cosmic ray ions. In order to understand the range of LET expected in the detectors, we review the common modes of energy loss by a moderately relativistic particle.
A moderately relativistic proton or heavier charged ion passing through a medium such as human tissue, TEP, or the silicon detectors will lose energy through electromagnetic interactions with electrons in the medium and through weak and strong interactions with nucleons. Generally the nuclear interactions are less common, but they become more important for the heavier ions above 20 𝑀𝑒𝑉/ 𝑛𝑢𝑐 and are a major source of uncertainty in predicting LET. Nuclear interactions are also a mode whereby neutrons can produce a signal in the CRaTER detectors, although this process is also uncommon. For the purposes of optimizing CRaTER, we focus on electromagnetic energy loss. The average rate of energy loss, or stopping power, of energetic but not ultra-relativistic charged particles other than electrons is given by the Bethe-Bloch equation. The energy loss 𝑑𝐸/𝑑𝑥 of a particle with charge 𝑧, energy 𝐸, and speed 𝛽 = 𝑣/𝑐 passing through a medium with atomic number 𝑍 and atomic mass 𝐴 is given by,
−𝑑𝐸 𝑑𝑥 = 𝐾𝑧2 𝑍 𝐴 1 𝛽2 1 2ln 2𝑚𝑒𝑐2𝛽2𝛾2𝑇 𝑚𝑎𝑥 𝐼2 − 𝛽2 𝑀𝑒𝑉 𝑔−1𝑐𝑚2
where 𝐾 = 0.307075 𝑀𝑒𝑉 𝑔−1𝑐𝑚2, 𝑚𝑒 is the electron mass, 𝑐 is the speed of light, 𝛾2= 1/(1 − 𝛽2), 𝑇𝑚𝑎𝑥 is the maximum energy that the ionizing particle can impart in a single collision, and 𝐼 is the minimum energy required to excite the medium (Yao et al., 2006). There is a strong dependence of the stopping power on the charge of the incident particle, and a weaker dependence on the mass of the particle through 𝑇𝑚𝑎𝑥. Corrections exist at both high energies, where polarization and shielding effects become more difficult to treat, and at low energies where assumptions about the adiabaticity of the collisions become invalid. Additionally, an ion will experience multiple Coulomb scatterings, leading to a
14
trajectory that deviates from a straight line. This leads to a statistical distribution in the path length that a given species of particles will traverse in passing through or stopping in the detector, even with identical initial energies. This results in the phenomenon of "straggling", which will manifest itself as a finite width in the range of energy deposited by a single type and energy of particle, no matter how fine the energy resolution of the detector or how low the noise level. This “noise” in the signal due to straggling places a lower limit on the energy resolution needed to distinguish events. Three implications of the Bethe-Bloch equation are that the energy deposited in the detectors increases with the square of the charge of the ionizing particle (so iron will deposit much more energy than hydrogen), that the peak of the energy deposition occurs as the particle is just stopping in the detector, and that the minimum-ionizing radiation rate occurs at ~2 Gev/nuc. Consequently, we set the minimum measurable LET to that of minimum-ionizing protons in silicon. The maximum LET is set by the energy that an iron nucleus will deposit when it just stops in a thin detector. Figure 8 shows projected range and LET of iron in silicon using SRIM (Ziegler et al., 1984). SRIM (The Stopping and Range of Ions in Matter) is a group of programs which calculates the stopping and range of ions (10 eV - 2 GeV/nuc) into matter using a full quantum mechanical treatment of ion-atom collisions.
The CRaTER telescope uses pairs of thin (~150 micron) and thick (~1000 micron) detectors. As discussed in the electronics section, the thin detectors are connected to a low gain amplifier, while the thick detectors are operated with a high gain. This design makes the thick detectors sensitive to particles with very low LET, while a very high LET is required to produce a measurable signal in the thin detectors. This use of high and low gain thin and thick detectors is motivated by the range of LET we need to measure at each point in the telescope stack and in the infeasibility of doing that broad an LET range with a single detector. Within the limits of the noise level of the detectors, it is desirable to detect high energy particles with the minimum ionizing deposition rate, so each point in the telescope where the LET spectrum is to be observed, the minimum LET measured shall be no greater than 0.25 keV/ micron in the silicon. Practical considerations effectively constrain the high end of the LET energy range. Slow moving, high-Z ions that give up much of their energy upon interaction will by definition yield large LET events. Therefore, the instrument should be able to measure such high-Z particles. On the other hand, the probability of a high energy heavy ion just stopping in a detector and depositing the maximum signal is small. Models and observations of heavy ions with prototype instruments show that these particles will produce signals commensurate with a deposition of 2 MeV/micron, so at each point in the telescope where the LET spectrum is to be observed, the maximum LET measured shall be no less than 2 MeV/ micron in the silicon.
3.1.3 Tissue Equivalent Plastic and Composition of CRaTER materials
As discussed in the previous section, the evolution of LET spectra is determined both by the composition of the incident high energy radiation and by the composition of the material being encountered. This is especially significant when considering biological effects. For example, one study has shown that as radiation travels through organic matter, the contribution to biological change
15
(gauged by the neoplastic transformation of C3H101T/2 mouse cells, a well studied cell line) from light ions increases, while the importance of heavy ions (such as iron) decreases (Kim et al., 1994). At equivalent depths of approximately 5 g/cm2, hydrogen and helium are the dominant contributors to the measured biological change. Since the LET spectrum is such a sensitive function of the absorbing medium, the bulk of the material within CRaTER must be similar to human tissue in order to produce results related to biological effects. Furthermore, the volume of TEP employed must be sufficient to cover the range in depths where the dominant species is expected to change from heavy to light ions.
The muscle equivalent tissue equivalent plastic (TEP) A-150 is the most popular material used today in the construction of instruments that measure the evolution of ionizing radiation in the presence of materials similar to human tissue. A150 is an Exradin proprietary plastic blend designed to be tissue equivalent. It is also known as Shonka tissue equivalent plastic after its original creator, Francis Shonka. By material, A-150 TEP is a combination of Polyethylene, Polyamide, Carbon black, and Calcium fluoride. TEP has the appearance of a black crayon but is very stiff and is easily machined. The TEP is slightly hydroscopic, and will absorb up to ~3% water by weight in a 50% humidity environment. Our tests showed that other than the water, little material outgassed from TEP samples after they were baked out in a vacuum. The composition and thicknesses of the TEP used in CRaTER is given in Table 2; the detailed TEP composition and dimensions are important as inputs to radiation transport code models.
The two pieces of TEP used in the telescope stack have a 2:1 length ratio, with the longer component on the deep space side of the telescope. The pieces are right cylinders and are held firmly in place at each end. The three thick-thin detector pairs sandwich the two pieces of TEP. The different lengths produce an asymmetric geometry. This configuration serves several purposes. The initial LET spectrum is measured at D1/D2 after first passing through the thin aluminum zenith cap. (Since the aluminum end caps are part of the material traversed by detected particles, and because the material properties of this matter is important also for a robust model comparison, we include Table 3 which shows the detailed composition and thicknesses of the end cap aluminum. In addition, a thin single layer of thermal blanket material covers each end cap on the exterior of the telescope.) After passing through D2 the LET spectrum is representative of the corresponding spectrum that would be present just on the inside of a manned space vehicle. The particles then traverse the longer piece of TEP whose length of several inches is similar to the depth to blood-forming organs in a human body. D3/D4 measure and quantify the evolution of the LET spectrum after passing through this first length of TEP. Those particles with enough energy then traverse the second, shorter TEP segment simulating a longer pathlength to a blood-forming organ. D5/D6 measures the fully evolved LET spectrum resulting from passage of particles through the entire length of the telescope.
16
Motivated by the need for sensor simplicity and in keeping with the primary measurement requirement, CRaTER does not determine the vector trajectory of individual particles (through position sensing strips, for example). Additionally, no means are employed to identify particles that pass through the side of the instrument and are detected (using a scintillator shroud surrounding the entire telescope stack coupled to a photo-multiplier tube, for example). Such techniques are often used to constrain the pathlength traversed by particles in a cosmic ray telescope and to reject events consisting of multiple particles or which scatter out of the instrument volume. Since we are interested in studying the spectrum of all particles within the telescope, including those that scatter at large angles, and because the techniques described above introduce a great deal of complexity, telemetry, and mass, we instead define the fields of view of the instrument (and hence statistically well-constrained path lengths) through n-fold detector coincidences.
The CRaTER measurement requirements place constraints on the field of view of the instrument only indirectly, through restrictions on the uncertainty in the pathlength traversed through the TEP and the detectors, and through lower limits on geometric factors, for example. While large fields of view are not a requirement, they are desirable in that they increase the geometric factor and therefore the statistical accuracy of the LET spectral measurements, particularly of the low intensity GCR population. In addition, since it is possible that SEPs and GCRs reflecting off the lunar surface – especially at small grazing angles of incidence – could provide significant diagnostics of the composition of the Moon and of secondary radiation from the surface, it is desirable that the nadir end of the telescope have as large a field of view as possible (owing to the presumed lower flux of cosmic ray albedo). This is another driver for having the shorter piece of TEP on the nadir end of the telescope as the D3/D4 and D5/D6 coincidences define a relatively larger opening angle than do D1/D2 and D3/D4.
The optimization of the CRaTER fields of view is discussed in the following section. Here we note the fields of regard that the spacecraft is able to support for the instrument. It is essential that the fields of view of CRaTER are not obstructed by components of the spacecraft, as CRaTER will not be able to distinguish between the primary spectrum of GCRs and SEPs and the secondary spectrum produced by interactions with spacecraft components.
The final spacing between the components of the telescope stack was determined by conducting a trade study that identified the configuration which optimized the parameters captured in the design requirements. The instrument requirements that are affected by the telescope stack are the following: ‘the minimum pathlength through the TEP should be >60 mm’ and ‘the two pieces of TEP should be different lengths (herein chosen to be 1/3 and 2/3 of the total length)’. In order to have sufficient counting rates of the most energetic particles during normal times CRaTER should have a minimum, full telescope geometric factor of ~ 0.1 cm2sr. In order to yield a sufficiently small uncertainty on the inferred LET, a geometry which produces <10% variation in path length between D1 and D6 is required. We constrained both the zenith and nadir field of view to be within their fields-of-regard (35 and 85 degrees, respectively). Owing to the proximity of CRaTER to the spacecraft, some fields-of-view defined by detector coincidences intercept part of the spacecraft. However, the required fields-of-regard assure unobstructed views of deep space for particles producing six-fold detector coincidences
17
and for those producing a D4-D6 coincidence from the nadir direction. Furthermore, these two important view geometries are also unobstructed by the instrument itself.
We found that the telescope stack optimization could be expressed by varying two free parameters, which we called L1 and L2. L1 is the length between the top of detector D2 and the top of detector D4, and L2 is the length between the top of detector D2 and the top of detector D6. We considered other heights less important. For example, the spacing between the thin and thick detectors in each pair is set by the natural value of the printed circuit boards the detectors are mounted on. We found that placing the zenith and nadir shields further away from the closest detector pair only increased the necessary diameter of the shield needed to provide a uniform thickness over the field of view. Therefore the shields are simply best put close to the adjacent detectors, as limited solely by sensible design practices. Since the TEP sections have a sufficiently larger diameter than the detectors, it did not make a practical difference where the TEP was mounted relative to the detector pairs. Thus, L1 and L2 summarize the two unique parameters varied in the trade study.
From this trade study the optimal values set a D1-D6 geometric factor of 0.57 cm2sr with a zenith or nadir field of view of 31.4o , well within the zenith and nadir fields of regard. In addition, the D4-D6 coincidence provides a geometric factor of 2.564 cm2sr and a field of view of 65.9o, again within the nadir field of regard. In the nominal LRO orbit (polar inclination, 30-50 km lunar altitude) this nadir field of view is completely filled by the lunar surface, thus maximizing the probability of detecting albedo particles.
Table 4 contains the critical linear dimensions of telescope elements along the resulting optical path. The detector diameters are each 35 mm and all other components have diameters slightly greater than 35 mm. Table 5 contains the resultant fields of view for key representative detector coincidences along with their geometric factors. The final column shows the threshold proton energy needed to create the coincidence from the indicated direction of incidence (“z” for zenith and “n” for nadir). Finally, Figure 9 shows the minimum energy required of ions (hydrogen to iron, using each ion's most common isotope) normally-incident from zenith to reach D2, D4, and D6.
The geometric factors presented in Table 5 are based purely on geometry and coincidence requirements. For particles passing through the sides of the instrument, detectors will have a complex and energy-dependent geometric factor. It is important to understand and limit the sensitivity of the detectors to such side penetrators, in order to limit false coincidences and to maximize performance during high flux intervals. To this end, reserve mass was placed in a thick ring around each detector pair (see Figure 2). We used GEANT4 to show that this extra shielding mass, along with the instrument housing, provides effective shielding of side penetrating protons up to typically ~50 MeV.
18
3.2 Electrical Design
3.2.1 Overview
In this section we cover the flow of electrical signals from the detectors through the telescope board to the analog processing board and finally the digital processing board. A key electrical aspect of the overall design of CRaTER is that the telescope housing is connected to the analog ground inside the telescope assembly, and nowhere else. The telescope housing is electrically isolated from the electronics box in order to prevent noise coupling from the spacecraft into the detector front-end. The electronics box housing is connected to the digital ground inside the electronics box.
A high-resolution measurement of the energy deposited is required to characterize the LET spectrum and to distinguish between the effects of the primary radiation and secondaries produced through interactions. The pulse height analysis of the energy deposited in each detector shall have an energy resolution better than 1/200 the maximum energy measured by that detector.
3.2.2 Telescope Board
The purpose of the telescope board is to bias each of the detectors, and to provide for an initial pre-amplification of the signals in close proximity to the detectors in order to reduce noise as the small initial signal is transported. Figure 10 is a block diagram of the components of the telescope board for a single detector.
3.2.3 Analog Processing Board
The Analog Processing Board (APB) provides a linear transfer function of output signal amplitude to detector energy deposit for three thin detectors and three thick detectors. A functional block diagram of a single amplifier string is shown in Figure 11. The signal from the preamplifier is passed through a system to remove constant offsets and give the signal a symmetric Gaussian profile. The thin and thick detector signals are Gaussian shaped pulses with a peaking time of ~1𝜇𝑠. This pulse shaping time was optimized by a consideration of the noise level of the thick detectors at 20C as a function of the shaping time. The design architecture for the APB is drawn from significant flight heritage such as in the Imaging Proton Spectrometer instrument on the NASA Polar spacecraft (Blake et al., 1995).
3.2.4 Digital Processing Board
The purpose of the Digital Processing Board (DPB) is to identify events that are valid for pulse height analysis, digitize the pulse-heights of the APB output signals, provide control of APB test pulser, supply power and detector bias, and provide the command and telemetry interface to the spacecraft. Figure 12 is a block diagram of the functions of the field-programmable gate array (FPGA) and the DPB. Test Pulse Generator
An internal pulse generator is used during ground test phases and in orbit to monitor the stability of the pulse forming network with time and to perform instrument aliveness tests. The test pulse generator injects a known charge into the front of each preamplifier with two gain settings, an
8-19
bit resolution amplitude, and low (8 Hz) and high (2 kHz) frequency rates. A connection is available for each detector for the injection of externally generated pulses. This external option was used on the ground to distinguish between noise and variation in the APB and in the test pulse generator and is not available in flight.
Low Level Discriminator
Two Low Level Discriminator (LLD) threshold voltages are generated by converting Pulse Width Modulated FPGA outputs to DC voltages. The discriminator amplitude, set via the 8-bit command interface registers, ranges from -0.047 to 0.141 V-DC. The thin detector discriminator setting drives the D1, D3 and D5 comparators; the thick detector discriminator setting drives the D2, D4 and D6 comparators. The instrument does not perform a pulse height analysis for an event unless the energy deposited in at least one detector produces a signal stronger than its corresponding LLD threshold. 3.2.5 Power
The DPB monitors and enables low voltage DC-DC converters that changes the 28VDC provided by the spacecraft into +/- 5V for use by the analog electronics, and a separate +5V for use by the digital electronics and bias supplies. The bias voltages were designed to be about 30 volts higher than the full depletion voltage of the detectors over a large range of leakage currents. The thin detector bias is approximately +75V and the thick detector bias is approximately +225V.
3.3 CRaTER Measurements
3.3.1 OverviewIf a particle deposits enough energy in a detector, then a primary science measurement will be
triggered. The measurement is of the energy deposited separately in each of the six detectors. It should be noted that regardless of which detector(s) cross their respective LLD thresholds, all six detectors are analyzed and reported in the data.
3.3.2 Measurement Sequence
The primary science measurements consist of the amplitudes of pulses detected from each of the detectors. The six signals from the pulse-forming and amplification networks on the APB are sent to the digital board, where the signals from the thin and thick detectors are separately compared to a low level discriminator (LLD) reference voltage. If any of the six signals crosses the corresponding LLD threshold, then a pulse height analysis (PHA) of all six signals is triggered.
After the PHA is complete, the list of triggered detectors is compared with a programmable mask that encodes the sets of detector coincidences that correspond to events of interest for
subsequent analysis on the ground. If an event falls within the mask set, it is added to a telemetry buffer within the FPGA (a "good" event), otherwise it is discarded (a "reject" event). With the exception of extreme high rate events, CRaTER shall operate with a coincidence mask that accepts all possible detector coincidences (i.e., virtually all particle detections are telemetered to the ground).
20
Figure 13 provides a schematic illustration of the pulse height analysis. At some time T<0μs a current pulse produced by either migrating electron-hole pairs in the detector or a test pulse from the digital board passes through the preamplifier in the telescope board and arrives at the analog board. At T=0μs the signal from the preamplifier crosses the low level discriminator (LLD) and triggers the PHA. At T=2μs the peak detect is set to hold and the analog-to-digital converter (ADC) is commanded to power up. At T=4μs the ADC is powered up and does a sample and hold in the following two clock cycles. The ADC then performs a serial conversion over the next 12 clock cycles, clocking the results out to the digital board. About 1/3 of the way through the ADC the peak detector is reset. The ADC and the measurement process is complete at T=12μs, defining the fixed measurement dead time.
3.3.3 Science Data Products
Primary Science Data Products
The event data for a single event in the primary science packet consists of a 9-byte block containing the six 12-bit numbers corresponding to the pulse height analysis of the six detectors. The FPGA contains two buffers. While primary science data are being written to one buffer during a given one second interval, the FPGA reads out the data stored in the previous second from the other buffer. Secondary Science Data Products
Secondary science telemetry packets are read during every 1-second data interval in which primary science data are being collected. These secondary science values set the time resolution that the state of the instrument (calibration commands, bias supply status, and disabling of detector processing) can be tracked on the ground. Parameters included in the secondary science data stream include: whether or not the calibration system is enabled, the calibration system rate, whether or not the thin and thick detectors are biased, whether or not each detector processing is enabled, and information on
commanding.
A critical second component of this data stream is the reject event and good event counters, which are used to determine the deadtime of the instrument and convert the primary science data into absolute fluxes during periods of intense SEP radiation. Event counters, detailed below, are all 16-bit counters that “freeze” at the maximum count until reset. Every second the current-count value is transferred to a holding register (which is inserted into the secondary science telemetry) and the counter is cleared.
• The reject event counter is a 16-bit counter that is clocked every time an event is rejected by the discriminator accept mask test.
• The good event counter is a 16-bit counter that is clocked every time a qualifying event is processed. This counter is clocked for all events, even if they are not written into static random access memory (SRAM), due to buffer overflow, or read-out of SRAM the following second (telemetry overflow).
21
• The total event counter is simply the sum of the reject and good event counters; it is provided for data processing convenience.
• The singles counters for each detector is a 16-bit counter that is clocked by the “Singles Count” signals received from the analog electronics subsystem. Since these inputs are asynchronous, they are sampled and filtered. Singles “incidents” with pulse widths <~ 200ns may not be recognized. Threshold energies for the singles counters are approximately 110 keV for the thin detectors and approximately 35 keV for the thick detectors.
3.3.4 Instrument Housekeeping
Instrument housekeeping packets are read every 16 seconds whenever 28VDC power is supplied to the instrument. The following describes the variables monitored in the housekeeping data stream.
Variables Monitored
Bias Voltages: The thin and thick detector bias voltages are recorded.
Temperatures: Temperatures recorded include the telescope electronics board, instrument chassis
bulkhead, the APB, the DPB, and the DC/DC converters.
Total Dose: The APB board will contain a device for measuring the total radiation dose experienced by
the electronics on the APB board. The device provides three analog outputs which are converted by the DPB into a 24-bit counter, the minimum step size of which is 0.020 mRad, and full scale reading of 335 Rad. The counter wraps after reaching full scale.
Currents: The detector leakage currents will be monitored for each individual thin and thick detector.
For the thin detectors the monitor will cover the current range from 0-0.24 μA. For the thick detectors the monitor will cover the range from 0-0.12 μA.
3.3.5 Commands
The spacecraft provides a time-of-next interval command every second which is used to uniquely time-tag each telemetry packet. Commands available via ground command include:
LLD levels (described above)
Internal pulser calibration signal amplitude and rate
Detector bias enable
Individual detector processing enable/disable inputs
Coincidence mask settings to define "good" events 3.3.6 Observation Strategy
Due to CRaTER’s immovable mounting to the spacecraft (see Figures 14 and 15), telescope orientation is determined by the pointing of the LRO spacecraft. CRaTER is aligned, along with most other instruments on the spacecraft, with its telescope axis along the nadir/zenith line. As such, one of CRaTER's apertures (D6 end) will nominally be pointing towards the Moon, and the other towards deep
22
space (D1 end). Some excursions from this pointing, including limb sounding yaws in the +/- y-axis directions, are expected for brief periods for calibration and secondary science activities.
CRaTER’s nominal measurement configuration will be to accept any detector coincidences as valid events, and, both the thin and thick detector LLD settings will be placed just above the noise. With the usual expected flux of particles that are measurable by CRaTER, this will allow us to analyze every valid detected event. In periods of high particle flux, the LLD settings will be adjusted to suppress the more dominant proton population in order to devote a higher percentage of our telemetry to the higher LET heavy ion population.
Section 3.1.2 examined the maximum fluxes expected in the D2 detector (Figure 6) due to the largest SEP events of the previous solar cycles. During these large events, the effects of the enhanced heavy ion spectrum may be more important scientifically than just measuring primarily the proton spectrum. Several features have been incorporated into the CRaTER signal processing design to allow for a reduction in the sensitivity of the instrument to SEP protons in favor of the rarer heavy ions. First, the thickness and LET ranges of the thin and thick detectors have been optimized such that the thin detectors that measure high LET events do not see many of the protons. Furthermore, the FPGA is designed to be able to deactivate one or more of the detector signals for triggering a PHA by exceeding the LLD value. The LRO spacecraft monitors CRaTER secondary science event rates in real-time and is designed to reconfigure instrument settings accordingly within seconds.
The following describes the automated process that configures the instrument into three different operating modes depending on detection rates: low, elevated, and extreme. In the default “low rate” operating mode all events are sent to the ground; all detectors are in operation and the LLD thresholds for the thin and thick detectors are set just sufficiently high to avoid detector noise levels but otherwise are low. Once the event rate exceeds a certain value, the instrument switches automatically into an “elevated rate” mode, requiring at least two detectors to have detected a signal to record and telemeter a valid event. In the “extreme rate” case, the zenith-facing thick detector is disabled, the thin detector thresholds are raised above the signal level produced by protons, and detection is required by at least two of the enabled detectors. Mode switching can occur at a 60-second cadence and the mode is recorded in the telemetry stream.
This process will help ensure continued measurement of higher energy protons and all heavy-ion particles during the infrequent periods when the instrument response would otherwise become saturated by lower energy protons in its nominal configuration. During these times, the lowest LET portion of the spectrum (less than a few keV/micron) dominated by the protons is sacrificed in favor of the higher LET portions contributed by the heavy ions. The threshold event rates for mode transitions are reconfigurable through ground command.
23
4 Instrument Testing, Characterization, and Calibration
The purpose of this section is to describe the testing, characterization, and calibration of the CRaTER Flight Models (FM), based on lessons learned from experiences with the extremely high-fidelity Engineering Model (EM). In brief, considerable bench testing demonstrates that there is a desirable linear relationship between the digital value returned by the PHA and the original energy deposited in the detector. Gains and offsets for each detector are determined with high precision by calibrating the instrument with a beam of high energy protons produced by the Northeast Proton Therapy Center (NPTC) of Massachusetts General Hospital (MGH). A 230 MeV proton beam at the MGH NPTC (Cascio et al., 2003) is degraded in energy using sheets of plastic (Cascio et al., 2004) until a beam is produced with large energy dispersion and a peak energy tuned to the response of a pair of thin and thick detectors. The dispersed beam produces a characteristic track in energy deposition in the pair of detectors. The gains and offsets for each of the detectors is then determined by iteratively varying the free parameters of the instrument response until the measurements match the predictions of GEANT numerical
simulations of the energy loss.
4.1 Instrument Characterization
4.1.1 Linearity of the Pulse ShapingThe most significant concern in instrument characterization is quantitatively understanding the relationship between the value of the energy deposited in the i-th detector and the resulting value produced by the ADC of the PHA. This relationship is demonstrated to be linear with an RMS residual of less than 0.1% using a stable external pulse generator. The external pulse generator is capable of generating stable, linear, and repeatable test pulses. A coaxial cable connects the pulse generator to any of the detector measurement chains before pre-amplification through a set of six connectors mounted directly on the telescope electronics board. An absolute scale for the external pulse generator is set using a series of attenuators and a coarse gain. Once the absolute scale is set a dial is used to generate pulse amplitudes with fractional amplitude variability of 0.01%.
We measured the height of the pulses generated by the external pulser and the best fit of a line to these data has an offset of 0.001 V, or approximately 0.03% of the peak value. The RMS of the residual to the linear fit is on the order 0.1%. It is important to note that both the small offset of 0.03% and the RMS residual from a linear relationship of 0.1% are upper limits imposed by the resolution of the sampling technique, and it is likely that the external pulse generator has even better performance. Nonetheless, these extremely low values are sufficient for our calibration needs.
Once we verified that the external pulse generator was linear, we connected it to each of the analog measurement circuits of the FM. The absolute amplitude of the external pulser was then set so that when the pulser amplitude dial was set to 1000 the resulting pulses just saturated the PHA. We then collected two minutes of data running at 100 events/second at each of nine input pulse amplitudes