VALIDATION OF THE CANADIAN REGIONAL CLIMATE MODEL (CRCM) SNOW
COVER SIMULATIONS USING REMOTE SENSING DATA
K. Chokmani
1, M. Wirtensohn
1,2& M. Bernier
11
Institut National de la Recherche Scientifique (INRS) – Centre Eau Terre Environnement (ETE), 490
rue de la Couronne, Québec, Qc, G1K9A9 Canada
2
Université Paris IV Sorbonne, 1 rue Victor Cousin, 75005 Paris, France
ABSTRACTDue to their spatially consistent large scale cover, with good spatial resolution and long observation period, satellite data constitute an alternative source to snow observations ground-based network that could be used to validate simulations of climate models such as the Canadian Regional Climate Model (CRCM). This paper presents the validation results of snow cover simulations made by the CRCM over the Quebec Province (Canada) during the period 1988-1999, using reference data provided by the snow historical mapping derived form the merging procedure of AVHRR and SSM/I mappings
Index Terms— Snow mapping, CRCM, AVHRR, SSM/I, Climate change
1. INTRODUCTION
This study is part of a project aiming to validate snow cover simulations made by the Canadian Regional Climate Model (CRCM) over the province of Quebec (Canada). Snow cover is a fundamental element in modeling of water balance, meteorological phenomena, atmospheric circulation and climate change. Because of its low density and non-optimal spatial distribution, snow observations ground-based network can not provide enough accurate data series suitable for climate change studies i.e. spatially consistent large scale snow cover maps, with good spatial resolution and long observation period. Satellite data constitute alternative sources of information and can therefore be used for the validation of the CRCM simulations. In order to validate the “snow” component of the CRCM, this study aims to compare snow cover extent mappings and estimation of the end of snow melting period, simulated by the CRCM to satellite-base data.
2. METHODS 2.1. Data
2.1.1. CRCM simulations
The CRCM was developed by Canadian Centre for Climate Modelling and Analysis (CCCma) [1]. It is based on physical and thermodynamic equations capable of producing the main features of the climate system (temperature, precipitation, evapotranspiration, soil moisture, runoff...). It is a circulation model indented to understand its climate processes and study its change and variability at a regional scale. Several version of the CRCM are being developed and tested.
CRCM simulations were produced by the simulation version called "aft”. It consists in the CRCM version 4.2.3 run on the regional domain centered on Quebec (QC 111x87 tiles) with a horizontal resolution of 45km (60 degrees North). Lateral boundaries were controlled by the global reanalysis ERA40 ([2], 2.5 x 2.5 degrees) and run over the 1961-2002 period (heating period of three years and calculation time step of 15 mn). The CRCM was coupled to the surface scheme multilayered model CLASS 2.7 (Canadian Land Surface Scheme) in order to reproduce a more realistic exchange of energy and water between the Earth's surface and atmosphere [3, 4].
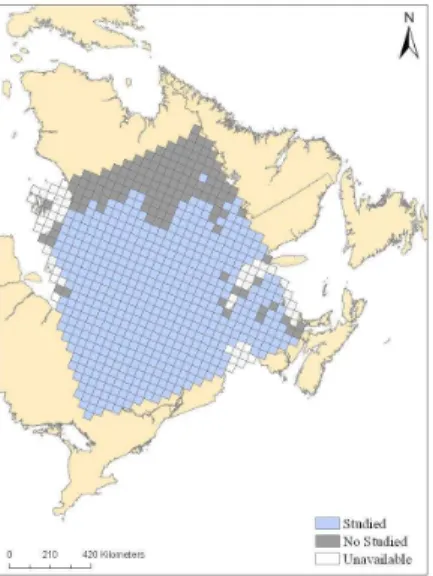
The study was conducted on a sub-domain of 734 tiles covering central and southern Quebec and western Labrador, part of New Brunswick, Prince Edward Island and Ontario (Fig. 1).
In this study, we focused in the variable “snow fraction” (FN) which gives the percentage of snow cover over the simulation tile. It was calculated at a daily time step for the period 1988 to 1999, from April 1st to June 30th, each year.
2023
Fig. 1: The CRCM simulation domain used in this study 2.1.2. Remote Sensing Data
Snow cover mapping was obtained by means of an algorithm that combines snow maps derived from optical and passive microwave satellite data (AVHRR and SSM/I) [5-7]. This merging algorithm takes advantage of the characteristics of the two sensors while minimizing the limitations to their application. The mapping results (referred to in the remaining of the paper as AVHRR-SSM/I) are used here as reference data for validation of CRCM simulations. They cover the period of snow melting i.e. from April 1st to May 31st of each year of the study period (1988-1999). The overall accuracy of the algorithm was estimated at 86%, when compared to snow depth observations at meteorological stations). AVHRR-SSM/I snow cover maps have been compiled on the CRCM simulation tiles of 45km x 45km size. Since AVHRR-SSM/I data have a resolution of 1km x 1km, each CRCM tile covers then approximately 1800 AVHRR-SSM/I pixels.
2.2. Analysis
2.2.1. Snow cover extent
First, we compared the snow cover extent simulated by the CRCM to remote sensing data over the melting period. For our analysis, only tiles within the AVHRR-SSMI snow cover maps domain were considered, which represents 678 tiles out of 734 for which CRCM simulations were initially available (Fig. 1).
For each tile and for each day from April 1st to May 31st, we calculated the FN mean value over the 12 years study period from remote sensing data and from CRCM
simulation. Therefore, we have a temporal monitoring of the snow cover extent for each tile (61 days of monitoring). Finally, we calculated the mean of all 678 tiles in order to obtain an CRCM and AVHRR-SSM/I overview of the snow cover extent at Quebec scale.
2.2.2 End of the snow season
Every year, from 1988 to 1999, we determinated the date of the end of the melting season, estimated by AVHRR-SSM/I and simulated by the CRCM for each tile. For a given year, we defined the end of the melt period from the CRCM simulations as the last day when the percentage of snow cover estimated by the model (given by FN parameter) reaches and remains a threshold value equal to 0%. This means that the end of the melting period is the day where snow has completely disappeared from the tile. Regarding remote sensing data, the threshold was determined by calculating the minimum number of pixels for which the results of mapping snow using the algorithm remain significant, with a statistical significance level of 95%. After calculation, we obtain a value of 92 pixels minimum, thus corresponding to a percentage of snow cover in the tile about 5% or less. Therefore, if there were, for a given tile, 92 pixels or less classified as snow, this tile can then be declared without snow.
Then, the mean value of the day of the end of the melting season was calculated from remote sensing and CRCM data over all 12 years. The mean was only calculated on the tiles for which we have information on the end of the season over more than 3 years. For certain years, the endof the season occurs after May 31st (for remote sensing data) or after June 30th (for CRCM data), or because data are missing. In total, the average was calculated of 536 tiles, shown in blue on Fig. 2.
Fig. 2: Tiles for which the mean value of the end day of the melting season was determined
On the other hand, we conducted an analysis on the difference between the dates of the end of the melting period as indicated by AVHRR-SSM/I and CRCM by subtracting the last day of the season estimated by the model from the last day of the season calculated by the remote sensing data. When the result is negative, this means that the CRCM overestimates the length of snow season. On the contrary, if the result is positive, so the CRCM underestimates the snow period. Then, the mean difference over the 12 study period was calculated for each studied tiles from the annual AVHRR-SSM/I and CRCM data.
3. RESULTS 3.1. Snow cover extent
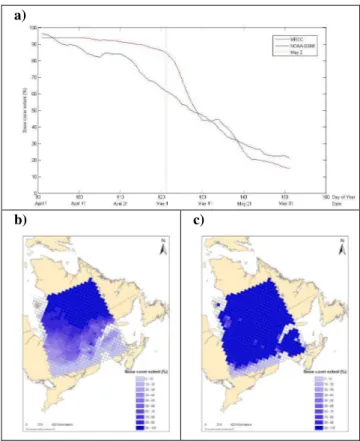
Fig. 3 a) shows the daily mean of snow cover extent over 12 years, from April 1st to May 31st over the 678 considered tiles. The red curve corresponds to CRCM data and the blue one to AVHRR-SSM/I data. At the beginning of the melting season around the day of year 90th (April 1st), the average snow cover simulated by the CRCM is approximately 93%. The model simulates well the snow cover extent at this date, since remote sensing data indicate a mean percentage of snow equivalents to approximately 97%. However, the CRCM exhibits a different behavior after this date. While AVHRR-SSM/I data show a gradual snow melt over the studied territory during April and May, the CRCM maintains a snow cover average percentage superior to 85% along April. Then, the CRCM curve decreases sharply to reach at the 130th day, a mean snow cover extent of 45%. This means that according to the CRCM, the snow disappeared in 40% of the territory over a period of just 10 days. For instance, while the CRCM simulates a snow percentage about 85% for May 2nd, AVHRR-SSM/I data indicates at 62% coverage for the same date.
According to Fig. 3 b) and c), the model produces be at May 2nd a snow cover much more important than that it would according to AVHRR-SSM/I data. The largest contrasts are mainly in the central Quebec and New Brunswick. These are transition zones between a region, at the North, where snow cover remains in place later in the season and melts slowly and a zone, in the extreme south, where the melt season occurs sooner and does not last long. At the South and North of the studied site, the snow percentage given by AVHRR-SSM/I data is approximately the same as simulated by the CRCM (between 0% and 10% for the South and between 90% and 100% for the North). The CRCM thus overestimates for this period of of the melting season, the snow presence over central Quebec and New Brunswick. Around May 10th (130th day), the difference is then reduced. At the end of May, the model catches up with satellite data, with a snow cover percentage of about 15% for the CRCM and 20% for AVHRR-SSM/I.
a)
b) c)
Fig. 3: 12 years mean snow cover extent: over 12 years: a) Daily values; b) Mean of snow cover extent on May 2nd according to AVHRR-SSM/I data. c) Mean of snow
cover extent on May according to CRCM simulations 3.1. End of the snow season
The histogram on Fig. 4 a) represents the mean difference between the end of the season day provided by AVHRR-SSM/I and CRCM. According to the model, the mean ending date occurs 21 days later than the effective date determined using AVHRR-SSM/I. The average difference values range from -37 to -5 days for 95% of the tiles, which indicates that the CRCM overestimates significantly the length of the snow presence period for almost the entire territory.
The map on Fig. 4 b) shows spatially representation of the data given in the histogram above. It appears clearly that the CRCM established the end of the melting season later than it actually is. We observe mean differences ranging between 15 and 40 days over a large part of Quebec territory.
a)
b)
Fig. 4: mean difference between the end of the season day provided by AVHRR-SSM/I and CRCM: a)
histogram; b) map 4. CONCLUSIONS
In this study, results of snow cover simulations made by the CRCM over the Eastern Canada during the period 1988-1999, were validated against reference data provided by historical remote sensing snow mapping.
Results demonstrated that on average, the CRCM simulates correctly snow cover extent at the start of the melting period. However, the model overestimates the presence of snow during April. Then, CRCM data catches up with satellite data the second half of May. The model simulates the end of the melt period later than it would be according to AVHRR-SSM/I data.
5. ACKNOWLEDGEMENT
The authors acknowledge the Consortium OURANOS for providing CRCM simulations.
6. REFERENCES
[1] D. Caya and R. Laprise, "A semi-implicit semi-lagrangian regional climate model: The Canadian RCM," Monthly Weather Review, vol. 127, pp. 341-362, 1999.
[2] Uppala S. M. & al., "The ERA-40 re-analysis," Quarterly Journal of the Royal Meteorological Society, vol. 131, pp. 2961-3012, 2005.
[3] D. L. Verseghy, "CLASS - A Canadian Land Surface Scheme for GCMS. I. Soil Model," International Journal of Climatology, vol. 11, pp. 111-113, 1991.
[4] D. L. Verseghy, N. A. McFarlane, and M. Lazare, "A Canadian Land Surface Scheme for GCMs:II. Vegetation model and coupled runs," International Journal of Climatology, vol. 13, pp. 347-370, 1993.
[5] K. Chokmani, M. Bernier, L. M. Pâquet, K. Dever, Y. Gauthier, and A. Royer, "Snow mapping over Eastern Canada for climate change studies purpose using historical NOAA-AVHRR and SSM/I data," in IEEE Geoscience and Remote Sensing Symposium, IGARSS 2006, Denver, CO, USA, 2006, pp. 747-750. [6] K. Chokmani, M. Bernier, L. M. Pâquet, K. Goïta, A. Roy, F. Comtois-Boutet, M. Turcotte, Y. Zhang, and L.-C. Forcier, "Développement d’algorithmes pour le suivi par satellite de la couverture de neige au sol à l’échelle du bassin versant," Institut National de la Recherche Scientifique-Eau, Terre et Environnement, Québec, Canada R-904, janvier 2007 2007.
[7] K. Chokmani, K. Dever, M. Bernier, Y. Gauthier, and L. M. Pâquet, "Adaptation of the SNOWMAP algorithm for snow mapping over Eastern Canada using Landsat-TM imagery," Hydrological Sciences Journal, vol. 55, pp. 649 - 660, 2010.