HAL Id: hal-02050187
https://hal.archives-ouvertes.fr/hal-02050187
Submitted on 3 Aug 2020
HAL is a multi-disciplinary open access
archive for the deposit and dissemination of
sci-entific research documents, whether they are
pub-lished or not. The documents may come from
teaching and research institutions in France or
abroad, or from public or private research centers.
L’archive ouverte pluridisciplinaire HAL, est
destinée au dépôt et à la diffusion de documents
scientifiques de niveau recherche, publiés ou non,
émanant des établissements d’enseignement et de
recherche français ou étrangers, des laboratoires
publics ou privés.
Tracing the transport of colored dissolved organic
matter in water masses of the Southern Beaufort Sea:
relationship with hydrographic characteristics
Hideki Matsuoka, Anncik Bricaud, Ronald Benner, Richard Sempere, Julien
Para, Louis Prieur, Simon Bélanger, Marcel Babin
To cite this version:
Hideki Matsuoka, Anncik Bricaud, Ronald Benner, Richard Sempere, Julien Para, et al.. Tracing
the transport of colored dissolved organic matter in water masses of the Southern Beaufort Sea:
relationship with hydrographic characteristics. Biogeosciences, European Geosciences Union, 2012, 9
(3), pp.925-940. �10.5194/bg-9-925-2012�. �hal-02050187�
www.biogeosciences.net/9/925/2012/ doi:10.5194/bg-9-925-2012
© Author(s) 2012. CC Attribution 3.0 License.
Biogeosciences
Tracing the transport of colored dissolved organic matter in water
masses of the Southern Beaufort Sea: relationship with
hydrographic characteristics
A. Matsuoka1,2, A. Bricaud1, R. Benner3, J. Para4,5,6, R. Semp´er´e4,5,6, L. Prieur1, S. B´elanger7, and M. Babin1,2
1Laboratoire d’Oc´eanographie de Villefranche, UMR 7093, Universit´e Pierre et Marie Curie (Paris 6)/Centre National de la
Recherche Scientifique (CNRS), B.P. 08, Port de la Darse, Villefranche-sur-Mer Cedex, 06230, France
2Takuvik Joint International Laboratory, Universit´e Laval (Canada) – CNRS (France), D´epartement de Biologie
and Qu´ebec-Oc´ean, Universit´e Laval, Pavillon Alexandre-Vachon 1045, avenue de la M´edecine, Local 2078, G1V 0A6, Canada
3Department of Biological Sciences, University of South Carolina, Columbia, SC 29208, USA
4Aix-Marseille University, Mediterranean Institute of Oceanography (MIO), 13288, Marseille, Cedex 09, France 5Universit´e du Sud Toulon-Var, MIO, 83957, La Garde Cedex, France
6CNRS/INSU, MIO UMR 7294; IRD, MIO UMR 235, France
7Universit´e du Qu´ebec `a Rimouski, D´epartement de Biologie, Chimie et G´eographie, 300 all´ee des Ursulines, Rimouski,
Qu´ebec, G5L 3A1, Canada
Correspondence to: A. Matsuoka ([email protected])
Received: 27 October 2011 – Published in Biogeosciences Discuss.: 11 November 2011 Revised: 7 February 2012 – Accepted: 7 February 2012 – Published: 6 March 2012
Abstract. Light absorption by colored dissolved organic
matter (CDOM) [aCDOM(λ)] plays an important role in the
heat budget of the Arctic Ocean, contributing to the re-cent decline in sea ice, as well as in biogeochemical pro-cesses. We investigated aCDOM(λ)in the Southern Beaufort
Sea where a significant amount of CDOM is delivered by the Mackenzie River. In the surface layer, aCDOM(440) showed
a strong and negative correlation with salinity, indicating strong river influence and conservative transport in the river plume. Below the mixed layer, a weak but positive correla-tion between aCDOM(440) and salinity was observed above
the upper halocline, resulting from the effect of removal of CDOM due to brine rejection and lateral intrusion of Pacific summer waters into these layers. In contrast, the relationship was negative in the upper and the lower haloclines, suggest-ing these waters originated from Arctic coastal waters. DOC concentrations in the surface layer were strongly correlated with aCDOM(440) (r2=0.97), suggesting that this value can
be estimated in this area, using aCDOM(440) that is retrieved
using satellite ocean color data. Implications for estimation of DOC concentrations in surface waters using ocean color remote sensing are discussed.
1 Introduction
The Southern Beaufort Sea (Fig. 1) is one of the regions where a significant reduction of sea ice cover has been recorded over the last three decades (Stroeve et al., 2008). In the south, the continental shelf receives a flow of freshwa-ter from the Mackenzie River (330 km3yr−1: Aagaard and Carmack, 1989). The freshwater includes a large amount of nutrients, suspended sediments, and dissolved organic matter (DOM) originating from soils that include thawing of the per-mafrost (Holmes et al., 2002; Carmack et al., 2004; Camill, 2005; Emmerton et al., 2008). A series of papers have sug-gested that the freshwater discharge into the Arctic rivers has increased since the middle of the 20th century (e.g., Peter-son et al., 2002; McClelland et al., 2006). While the ex-pected increase in nutrients delivered by rivers into the Arctic Ocean may enhance phytoplankton growth, both particulate and dissolved materials can reduce the light propagating into the water column, preventing phytoplankton from harvest-ing sufficient light for their growth. How the biogeochemical processes in the Arctic coastal region will respond to climate change is unclear.
926 A. Matsuoka et al.: Tracing CDOM for Arctic waters
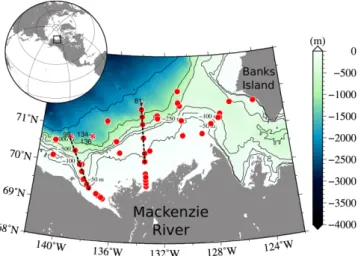
Fig. 1. Location of sampling stations for the MALINA cruise in the Southern Beaufort Sea, Canadian Arctic. Three deep stations (bottom depth >1000 m) were selected to show typical hydrography of the Arctic Ocean (stars). One profile at station 310 (cast # 81) and 620 (cast # 99) each and three profiles at station 540 (cast # 134– 136) are shown in Fig. 3. Two black and dashed lines represent west and east channels of the Mackenzie river. Vertical sections along those lines are shown in Fig. 6.
Light-absorbing colored DOM (CDOM) plays various roles in physical and biogeochemical processes in the South-ern Beaufort Sea. As a physical role, light absorption of CDOM is likely responsible for a significant part of the heat storage of the upper layer of the Arctic Ocean (Hill, 2008), which amplified the recent decline in sea ice extent in this re-gion (Shimada et al., 2006). This result is consistent with the fact that the relative contribution of this material to the total non-water light absorption is remarkably high in the Arctic Ocean (66 ± 17 % at 440 nm) throughout the ice-free sea-sons compared to that at lower latitudes (Matsuoka et al., 2011). With regard to biogeochemistry, exposure of CDOM in seawater to solar radiation at all latitudes produces inor-ganic carbon-based gases such as carbon dioxide (CO2)and
carbon monoxide (CO) , suggesting that this process may af-fect the organic carbon cycle in the Arctic Ocean (Xie and Gosselin, 2005; B´elanger et al., 2006; Xie et al., 2009). In addition, relatively refractory DOM can be transformed into a labile and biologically available DOM resulting from pho-todegradation processes (Miller and Zepp, 1995; Miller and Moran, 1997). The labile DOM can stimulate microbial ac-tivities and hence the biological pump (Miller et al., 2002).
CDOM is inversely correlated with salinity in estuaries, indicating a terrigenous source of CDOM in coastal waters. In contrast, there is a significant and positive correlation between this absorption and chlorophyll-a (chl-a) concen-tration in oceanic waters, suggesting phytoplankton-derived components contribute to CDOM (e.g., Bricaud et al., 2010). In addition, the spectral slope of CDOM absorption can give insights about sources and the bulk chemical properties of
CDOM (Carder et al., 1989; Helms et al., 2008; Fichot and Benner, 2011), which are possibly influenced by photochem-ical and/or biologphotochem-ical processes (e.g., Twardowski and Don-aghay., 2002; Bricaud et al., 2010). Thus, CDOM absorp-tion properties provide insights about source and physico-chemical and biological processes.
In the Arctic Ocean, several sources of CDOM are consid-ered. A significant amount of CDOM in the Arctic surface layer originates from land by river discharge (B´elanger et al., 2006; Retamal et al., 2007; Matsuoka et al., 2009). In the Po-lar Mixed Layer (PML), previous papers showed that DOM can be removed due to brine rejection (Amon, 2004; Dittmar, 2004), therefore a fraction of CDOM can also be removed due to brine rejection when sea ice is formed. Matsuoka et al. (2011) suggested that CDOM could be transported into the Pacific Summer Water (PSW) layer, which is located just below the PML, by the intrusion of waters from the Bering Sea during summer. In addition to photochemical and mi-crobial processes, these findings suggest that CDOM vari-ability is also related to physical processes, but relationships between CDOM absorption properties and hydrographic fea-tures are still not sufficiently understood in the Arctic Ocean. The objective of this study is therefore to examine char-acteristics of CDOM absorption and its transport in the Southern Beaufort Sea using both optical and hydrographic datasets. The linkage between CDOM absorption and dis-solved organic carbon (DOC) concentration is also examined at the end of this paper in view of ocean color remote sensing applications.
2 Materials and methods
The France-Canada-USA joint Arctic campaign, MALINA, was conducted in the Southern Beaufort Sea in the area from approximately latitudes 69◦to 72◦N and longitudes 125◦to 145◦W (Fig. 1). Data were collected from 30th July to 27th August 2009 aboard the Icebreaker CCGS Amundsen, and 37 stations were visited. Temperature and salinity profiles were obtained using a SBE-911 plus (SeaBird) conductivity-temperature-depth (CTD) probe. Nitrate and oxygen concen-trations, chlorophyll fluorescence, and CDOM fluorescence were also obtained using MIBARI-ISUS (Satlantic), SBE-43 (SeaBird), Seapoint (Seapoint), and Backscat 1 (Haadrt Optic and Mikroelectonic) sensors, respectively. All sensors were attached to the CTD probe. Discrete water samples were collected using CTD/Niskin bottles. A barge and/or zodiac were also deployed at 32 stations out of 37 stations during the same time periods of the CTD deployment to ob-tain surface water samples. Those deployments were con-ducted to collect samples close to the surface (0–0.5 m us-ing a clean plastic container), which are difficult to obtain using a CTD/Niskin (“Surface” waters using a CTD/Niskin are usually taken from 2 to 4 m depth depending on the sea state), and to minimize the effect of the contamination by
the icebreaker. Differences in CDOM absorption of surface waters between samples from the CTD/Niskin and from the barge/zodiac are discussed in Appendix A1.
2.1 CDOM absorption
The detailed methodology to determine light absorbance of CDOM using an UltraPath (World Precision Instruments, Inc.) is documented in Bricaud et al. (2010). Briefly, a sam-ple was collected from a CTD/Niskin bottle (or from a plas-tic container when using the barge or zodiac) into pre-rinsed glass bottles covered with aluminium foil. Those samples were filtered immediately after sampling, in dim light, using 0.2 µm GHP filters (Acrodisc Inc.) pre-rinsed with 200 ml of Milli-Q water. Filtered samples were then pumped into the sample cell of the Ultrapath instrument using a peri-staltic pump. Absorbance spectra were measured from 200 to 735 nm with 1 nm increments with reference to a salt solu-tion (the salinity of the reference was adjusted to that of the sample ±2 salinity unit), prepared with Milli-Q water and granular NaCl precombusted in an oven (at 450◦C for 4 h). The sample tube was cleaned between measurements with di-luted solutions of detergent, high reagent grade MeOH, 0.1 N HCl, and with Milli-Q water. The cleanliness of the tube was checked by measuring the absorption spectrum of the refer-ence water between each sample.
Temperature differences between reference and sample were minimized as far as possible, but could not be always avoided. As absorbance of pure water depends on temper-ature, this sometimes resulted in an underestimate of ab-sorbance mostly beyond 700 nm for some samples. No tem-perature correction was applied to absorbance spectra in the data. To minimize the temperature and salinity effects on the absorbance among samples, the averages of the measured values of ODCDOM(λ) over a 5-nm interval around 685 nm
(ODnull, CDOM) was assumed to be 0 and the ODCDOM(λ)
spectrum was shifted accordingly (Pegau et al., 1997; Babin et al., 2003):
aCDOM(λ) =2.303
[ODCDOM(λ)−ODnull,CDOM]
l , (1)
where 2.303 is a factor for converting base e to base 10 log-arithms, and l is the optical pathlength (m). In most cases, a 2 m optical pathlength was used for the measurement, ex-cept for coastal waters at the Mackenzie River mouth where a 0.1 m optical pathlength was used. The presence of mi-crobubbles in the sample tube was minimized by using a peristaltic pump. When not totally removed, microbubbles induced a significant (and artificial) absorption detectable in the infrared, and the corresponding absorption spectra were discarded.
Spectra of aCDOM(λ) can be expressed as exponential
functions as follows (e.g., Bricaud et al., 1981; Babin et al., 2003):
aCDOM(λ) = aCDOM(λr)e(−SCDOM(λ−λr)), (2)
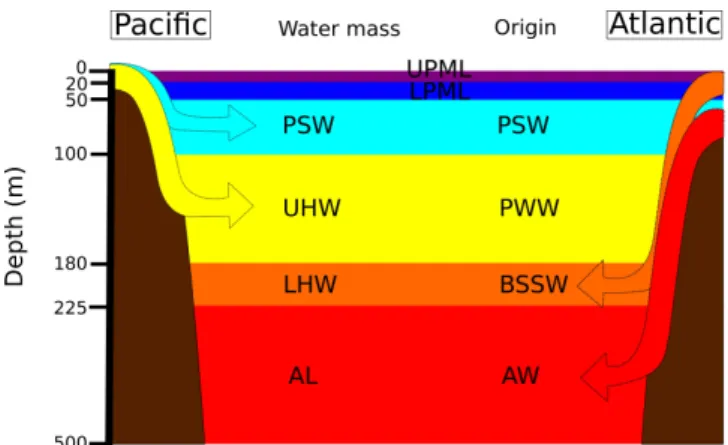
Fig. 2. A schematic image of water masses of the Arctic Ocean. The different water masses correspond to different colors as in Figs. 5 and 7–10.
where λr is a reference wavelength (440 nm in this study), and SCDOMdenotes the spectral slope of CDOM. SCDOMwas
calculated by fitting a non-linear regression to the data from 350 to 500 nm (Babin et al., 2003). In total, 373 samples were collected for CDOM absorption analyses at 37 stations.
2.2 DOC determination
Dissolved organic carbon (DOC) was measured using the high-temperature combustion method and either a TOC-V or TOC-5000 analyzer (Shimadzu) (Benner and Strom, 1993; Sohrin and Semp´er´e, 2005). Filtered water samples were stored frozen until analysis in laboratory. In total, 256 sam-ples were collected for DOC analyses at 29 stations.
3 Background: Hydrography of the Arctic Ocean
Because we examined CDOM absorption properties for each water mass present in the Southern Beaufort Sea, the ma-jor hydrographical features are presented first and discussed. The vertical structure of the Arctic Ocean is unique and de-termined by river discharge/ice melt, vertical mixing, and lateral intrusion of both Pacific and Atlantic waters (e.g., Coachman and Aagaard, 1975; Aagaard, 1989; see Fig. 2). The surface layer can be separated into two water masses: the upper (UPML) and lower (LPML) parts of the PML. The UPML includes Mackenzie river water and/or sea ice melt water in summer and is characterized by relatively fresh water (salinity <28). It is typically found from the surface to 20 m (Macdonald et al., 1989). Below the UPML, the LPML is found from 20 to 50 m and is characterized by a temperature minimum around a salinity of 30.5. The tem-perature minimum indicates that waters from the previous winter stay at those depths (Carmack et al., 1989; Macdon-ald et al., 1989). Below the LPML, Pacific summer waters (PSW; salinity centered at 31.5) from the Bering Sea enter
928 A. Matsuoka et al.: Tracing CDOM for Arctic waters
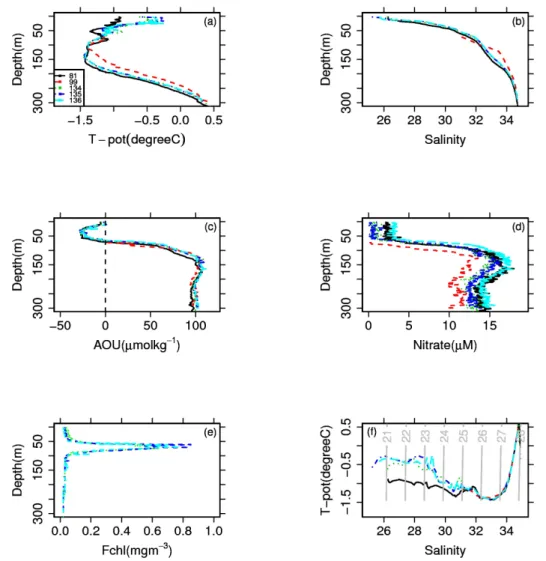
Fig. 3. Observed hydrography of the Arctic Ocean during the MALINA cruise. (a) Potential temperature (in◦C), (b) Salinity, (c) Apparent dissolved oxygen utilization (AOU) concentration (in µmol kg−1), (d) Nitrate concentration (in µM), (e) chlorophyll fluorescence, Fchl (in mg m−3), and (f) T-S diagram. These profiles were obtained at deep stations (bottom depth >1000 m; see Fig. 1 for location) as representatives of typical hydrography of the Western Arctic Ocean. Fchlat stations 81 and 99 were not obtained.
the Chukchi Sea during summer, and are then located from approximately 50 m to 100 m depth (Carmack et al., 1989; Macdonald et al., 1989; Shimada et al., 2001). This wa-ter is characwa-terized by a temperature maximum around the centered salinity (Shimada et al., 2001). Below the PSW, Pacific winter waters (PWW: salinity centered at 33.1) form upper halocline waters (UHW) from 100 m to 180 m depth (Carmack et al., 1989; Macdonald et al., 1989; Shimada et al., 2005). This water mass has a temperature minimum (≈–1.4◦C) and clear maxima of nitrate and silicate con-centrations (Codispoti et al., 2005; Shimada et al., 2005). The lower halocline water (LHW) located around 180 to 225 m originates from the Barents Sea shelf water (BSSW; Eastern Arctic) when sea ice is formed (e.g., Shauer et al., 1997). This water has salinities ranging from 33.9 to 34.7, and is characterized by relatively high oxygen concentra-tions compared to that in the layers above (Shimada et al., 2005). Atlantic-origin waters (AW) with salinities >34.7 are
warmer (>0◦C) and form the Atlantic layer (AL) located from 225 m to 800 m (Shauer et al., 1997; Shimada et al., 2005). Below those layers, cold and dense Arctic bottom waters (ABW) are present (e.g., Aagaard, 1989).
Based on the physical properties of the water masses (Car-mack et al., 1989; Macdonald et al., 1989; Shimada et al., 2001, 2005) and two chemical variables, nitrate and oxygen concentrations (Codispoti et al., 2005; Shimada et al., 2005), we grouped water masses into 6 categories (see Table 1).
UPML (1) was defined as waters <20 m and salinity <28. During our observations, temperatures in the UPML ranged from –1.0 to –0.2◦C and salinities were low (salinity <28; Fig. 3a and b). This layer was influenced by sea ice melt and/or river discharge. LPML (2) had salinities ranging from 28 to 30.7. A minimum of apparent oxygen utilization (AOU) was observed from 20 to 50 m depth where salinity increased sharply (Fig. 3c). It appears that the net produc-tion of oxygen by photosynthesis in these waters led to the
Table 1. Definition of water masses in this study.
Water mass Depth (m) Origin Definition
UPML <20 River discharge, melting sea ice, or both Salinity <28
LPML 20–50 Arctic-origin Water 28≤Salinity<30.7
PSW 50–100 Pacific Summer Water 30.7≤Salinity<32.3 PWW/UHW 100–180 Pacific Winter Water 32.3≤Salinity<33.9 LHW 180–225 Barents Sea Shelf Water 33.9≤Salinity<34.7
AL >225 Atlantic Water Salinity≥34.7
trapping of oxygen in the pycnocline, which prevented out-gasing to the atmosphere. Solar heating can also change the saturation of oxygen and induce a negative AOU. The nega-tive values of AOU are thus explained by either production of oxygen by phytoplankton, solar heating of winter mixed water, or both. Assuming temperature and salinity from the previous winter of –1.8◦C and 31, respectively, we obtained AOU value of –24 ± 2 (µmol kg−1). This value was higher than the observed value (i.e., –30 ± 2 µmol kg−1). The
dif-ference between those two values suggests that production of oxygen by phytoplankton explained on average 20 % of the negative AOU value in this water mass. Solar heating was thus more important compared to production by phyto-plankton for the negative AOU in relatively clear waters. A peak of chlorophyll fluorescence was observed around 70 m (Fig. 3e). This peak contributed to production of oxygen at those depths since AOU values were relatively low, but not as much as in LPML (Fig. 3c).
PSW (3) had salinity ranging from 30.7 to 32.3. A small but clear temperature maximum centered around salinity 31.5 was found from approximately 50 to 100 m (Fig. 3a, b, and f), suggesting the presence of the PSW (Carmack et al., 1989; Shimada et al., 2001). PWW/UHW (4) had a salin-ity ranging from 32.3 to 33.9. The thick and cold halocline water had a broad temperature minimum from 100 to 180 m (Fig. 3a, b, and f). The clear maximum of nitrate concentra-tion in this layer (Fig. 3d) was centered at salinity 33.1, which indicates this water mass was formed in the Western Arctic Ocean during winter (Codispoti et al., 2005; Shimada et al., 2005). LHW (5) had a salinity ranging from 33.9 to 34.7 and was found from 180 to 225 m. Water temperatures increased strongly with depth in this salinity range, and oxygen con-centrations were higher than in the layer above (not shown; Shimada et al., 2005). Those results suggest the presence of the LHW (Shauer et al., 1998; Shimada et al., 2005) that originates in the BSSW (Eastern Arctic). AL (6) had salini-ties >34.7 and temperatures >0◦C (Fig. 3a). The relatively high temperature and salinity (>34.7) indicated an intrusion of AW.
Water samples were obtained at CTD casts above 500 m depth. The percentages of total samples collected in each water mass were 20 % (UPML), 22 % (LPML), 41 % (PSW), 11 % (PWW/UHW), 4 % (LHW), and 2 % (AL).
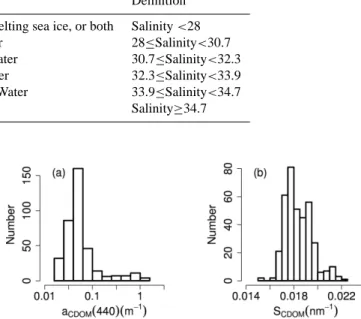
Fig. 4. Histograms of (a) the absorption coefficients of CDOM at 440 nm, aCDOM(440) and (b) the spectral slope, SCDOM.
4 Results
4.1 Variability in CDOM absorption properties and their relationships with hydrography
Values of aCDOM(440) varied widely in Southern Beaufort
Sea waters (0.018 m−1<aCDOM(440) <1.08 m−1; Fig. 4a).
Those values mostly fell within the range observed in both the western part of the Southern Beaufort Sea (Matsuoka et al., 2011) and various coastal waters at moderate latitudes (Kirk, 1994; Vodacek et al., 1997; Babin et al., 2003), with some high aCDOM(440) values (up to 1.08 m−1)which were
observed near the mouth of the Mackenzie River. Values of the spectral slope of CDOM absorption, SCDOM, fell within
a narrower range (0.015 nm−1<SCDOM(440) <0.023 nm−1;
Fig. 4b) compared to the western part of the Southern Beau-fort Sea (Matsuoka et al., 2011), but were similar to values in coastal waters around Europe (Babin et al., 2003).
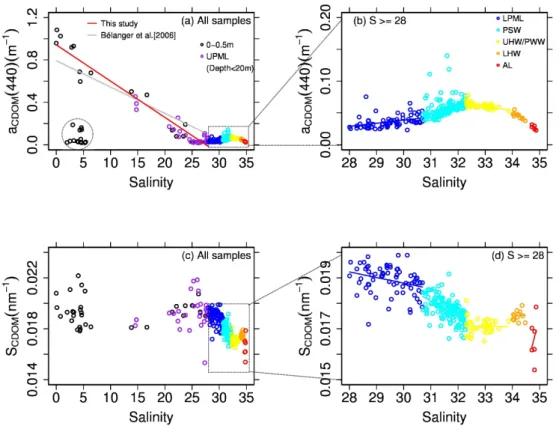
At salinity <28 (in the UPML), aCDOM(440) values
showed a strong and negative correlation with salinity (r2=
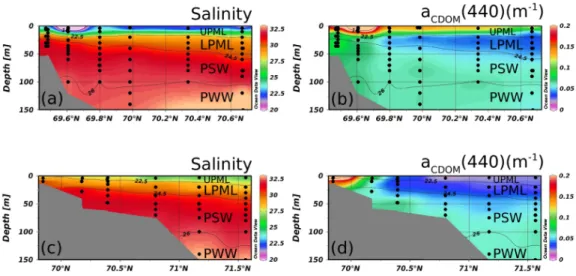
0.95, p < 0.0001) except for some stations where waters were influenced by sea ice melt (dotted circle in Fig. 5a; 21 % of our samples in the UPML). This negative correla-tion was observed previously in the same study area dur-ing summer (B´elanger et al., 2006) and elsewhere in coastal zones at lower latitudes (see Nieke et al., 1997 and references therein). During MALINA, the river plume extended farther offshore in the western channel than in the eastern channel, which was reflected in the spatial distribution of high CDOM absorption in the UPML (Fig. 6).
930 A. Matsuoka et al.: Tracing CDOM for Arctic waters
Fig. 5. Upper panels: aCDOM(440) as a function of salinity (S) for (a) the whole range and (b) S ≥ 28 (below the UPML). A linear fit provides the following relationship: aCDOM(440) = 0.943–0.034* S, N = 52; p < 0.0001. Data points which were influenced by sea ice melt are marked as a dotted circle. Lower panels: SCDOMas a function of S for (c) whole range and (d) S ≥ 28 (below the UPML).
For the LPML, aCDOM(440) values showed a weak but
positive correlation with salinity (r2=0.14, p < 0.001; dark blue points in Fig. 5b). Among the lowest aCDOM(440)
val-ues (0.036 ± 0.010 S.D. m−1)were observed in the low salin-ity range of this layer (i.e., 28≤salinsalin-ity <30.7). The low aCDOM(440) values in the LPML compared to those in the
layer below (i.e., PSW) were found in vertical section of the two channels of the Mackenzie River mouth (Fig. 6b and d). The similar positive correlation between aCDOM(440) and
salinity was found in the PSW (r2=0.10, p < 0.001; light blue points in Fig. 5b).
In contrast, the relationship turned to be negative in the PWW/UHW (yellow points in Fig. 5b). The coeffi-cient of determination in this layer was higher (r2=0.36,
p <0.0001) than in the LPML and the PSW. Below the PWW/UHW, we found that aCDOM(440) values were well
correlated with salinity in the LHW (r2=0.63, p < 0.01; or-ange points in Fig. 5b). In the AL, the negative correlation was not significant (p = 0.06; red points in Fig. 5b).
The spectral slope of CDOM absorption, SCDOM, is
plot-ted as a function of salinity in Fig. 5c and d. At salinity <28 (in the UPML), SCDOMvalues revealed no trend with
increas-ing salinity values (mean value of 0.0192 ± 0.0011 nm−1). Values of SCDOM for river waters (0.018–0.021 nm−1)fell
within the range for sea ice melt waters (0.018–0.022 nm−1).
We found, however, that SCDOMvalues were negatively
cor-related with salinity in both the LPML and the PSW lay-ers (p < 0.01 and 0.001, respectively; Fig. 5d). Those negative trends of SCDOM versus salinity were opposite to
the trend in the aCDOM(440) versus salinity relationship
for those layers (Fig. 5b). No clear trend was observed in SCDOM versus salinity relationship in the PWW/UHW,
the LHW, and the AL layers. Values of SCDOM varied in
each water mass: 0.0189 ± 0.0006 S.D. (nm−1)for LPML,
0.0177 ± 0.0006 S.D. (nm−1) for PSW, 0.0171 ± 0.0003
S.D. (nm−1)for PWW/UHW, 0.0175 ± 0.0002 S.D. (nm−1)
for LHW, and 0.0166 ± 0.0009 S.D. (nm−1)for AL. Those values were significantly different among the LPML, the PSW, the PWW/UHW, the LHW, and the AL (p < 0.0001 for the three neighbor water masses and p < 0.05 for the dif-ference between the LHW and the AL).
4.2 Relationship between CDOM absorption and its spectral slope
The relationship between SCDOMand aCDOM(440) varied
de-pending on water masses (Fig. 7). As in the SCDOMversus
salinity relationship, SCDOMvalues revealed no trend with
in-creasing aCDOM(440) values in the UPML (Fig. 7a), which is
latitudes (Vodacek et al., 1997; Babin et al., 2003).
At salinity ≥28 (below the UPML), in contrast,
SCDOM showed a significant and negative correlation with
aCDOM(440) for all water masses except for the LHW
(Fig. 7b). For the LPML, the slope of the SCDOM
ver-sus aCDOM(440) relationship was –0.0351 (r2=0.37, p <
0.0001). Relatively similar and negative slopes for that re-lationship were observed in the PSW and the PWW/UHW (slope = –0.0231 and –0.0582, r2=0.36 and 0.59, respec-tively; p < 0.0001 for both water masses). Those slopes were not significantly different among the LPML, the PSW, and the PWW/UHW (p = 0.9 and 0.06 for the two neighbor water masses, respectively). While there was no relation-ship between SCDOMand aCDOM(440) in the LHW, a negative
correlation was again observed in the AL (slope = –0.1888,
r2=0.41).
4.3 Variability in DOC concentration and its relationship with hydrography
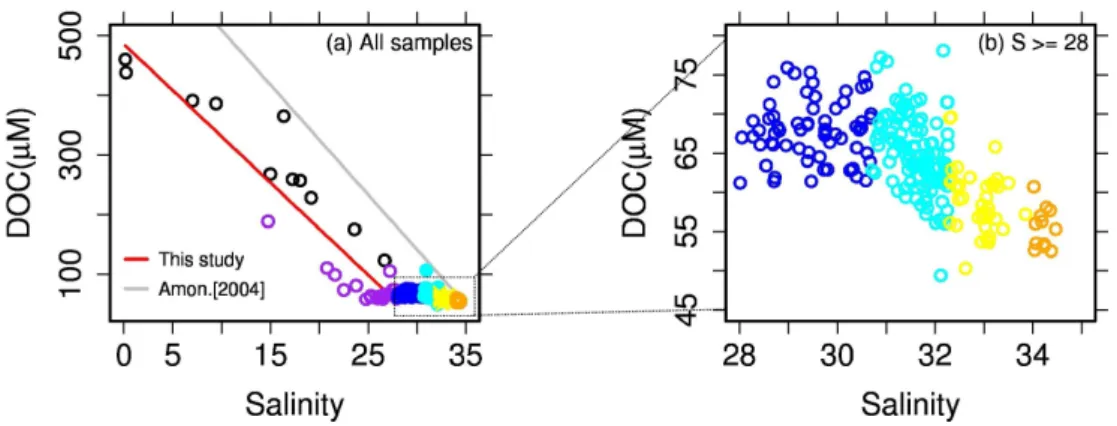
DOC concentrations varied widely in the Southern Beaufort Sea (49 µM<DOC<460 µM; Fig. 8a). These values mostly fell within the range observed in various environments of the Arctic Ocean (Amon, 2004; Benner et al., 2005). Similarly to aCDOM(440) versus salinity relationship, DOC
concentra-tions showed a strong and negative correlation with salinity in the UPML (r2=0.89; Fig. 8a). Note that because DOC concentrations for sea ice melt waters were not obtained in this study, these data points were not used to obtain this re-gression. Our zero-salinity DOC concentrations were signif-icantly lower than in the Eastern Arctic Ocean (p < 0.0001; Amon, 2004).
At salinities ≥28 (below the UPML), DOC concentra-tions tended to decrease gradually with increasing salin-ity (Fig. 8b), which was a different trend compared to aCDOM(440) or SCDOM versus salinity relationship (Fig. 5b
and d). The DOC concentrations in these layers were much lower (65 ± 6 µM) than in the layer above (i.e., UPML).
4.4 Relationship between CDOM absorption properties and DOC concentrations
To examine the relationship between DOC and aCDOM(440),
DOC is plotted as a function of aCDOM(440) at all depths
(Fig. 9a). We found that aCDOM(440) showed an excellent
correlation with DOC in the UPML (r2=0.97; Fig. 9a),
in-dicating that 97 % of DOC variability is explained by that in the colored fraction of DOM, namely CDOM, in the sur-face layer of the Southern Beaufort Sea. However, at salin-ities ≥28 (below the UPML), no correlation was observed (Fig. 9b). DOC concentrations for all water masses below the UPML were much lower and the mean value of 66 ± 11 µM was obtained.
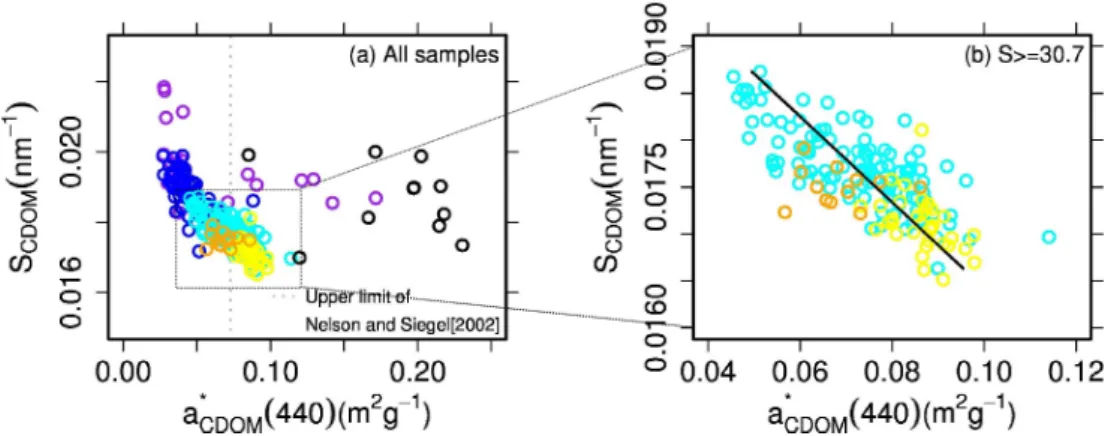
To examine general properties of CDOM absorption in Arctic waters compared to those at lower latitudes,
SCDOM is plotted as a function of a∗CDOM(440) (m2g−1)
(i.e., aCDOM(440) normalized to DOC; Fig. 10). The
a∗CDOM (440) values were high in the UPML and variable (0.10 ± 0.07 m2g−1). The mean value in the UPML was above the upper limit of oceanic waters (0.07 m2g−1; Nel-son and Siegel, 2002). In contrast, a∗CDOM(440) values were low and less variable in the LPML (0.043 ± 0.010 m2g−1).
Below the LPML a significant negative correlation was found between SCDOM and a∗CDOM(440) (r2=0.56; p <
0.0001; Fig. 10b). SCDOM values in the PWW/UHW were
significantly lower than in the LHW (p < 0.0001), while both
SCDOMand a∗CDOM(440) values in the PSW varied widely.
5 Discussion
5.1 Linkages among CDOM absorption, DOC concentrations, and hydrography of the Arctic Ocean
During the MALINA cruise, we observed large variabil-ity in hydrographical conditions and CDOM absorption from coastal to open ocean waters (0≤Salinity<35 and 0.018<aCDOM(440)<1.08 m−1). Although SCDOM values
were similar, aCDOM(440) values in sea ice melt water were
very low and were well discriminated from those in sur-rounding waters, and by excluding these data a strong nega-tive correlation between aCDOM(440) and salinity was found
in the UPML (<20 m). This result indicates a strong river in-fluence and near-conservative behavior of CDOM in the river plume, which is consistent with previous studies in this re-gion (B´elanger et al., 2006; Matsuoka et al., 2009). Accord-ing to our observations, the river plume extended far from the western channel of the river mouth to the northwest direction over 150 km. This result is consistent with that reported by Macdonald et al. (1999).
The slope of aCDOM(440) versus salinity in the present
study was significantly different from that of B´elanger et al. (2006) (p < 0.0001; Fig. 5a). A 10 cm optical pathlength with a traditional spectrophotometer Lambda 35 (Perkin-Elmer) was used to obtain CDOM absorption coefficients in B´elanger et al. (2006), while we used the same optical path-length (i.e., 10 cm) with an UltraPath. Comparison of the results between a similar spectrophotometer (Perkin-Elmer Lambda 19) and the UltraPath showed a reasonable agree-ment (see Appendix A2). While CDOM absorption was measured onboard immediately after water sampling in this study, the measurements were achieved a few months after sampling in B´elanger et al. (2006) on frozen water samples. The difference in the slope for aCDOM(440) versus salinity
relationship could partly result from change in CDOM ab-sorption properties over time or as a result of freezing.
932 A. Matsuoka et al.: Tracing CDOM for Arctic waters
Fig. 6. Vertical section of the two channels of the Mackenzie River (see Fig. 1). (a) Salinity and (b) aCDOM(440) in the western transect and (c) Salinity and (d) aCDOM(440) in the eastern transect. Potential density contours of 22.5, 24.5, and 26 (in kg m−3), which correspond to salinity of 28, 30.7, and 32.3, respectively, are depicted.
Fig. 7. SCDOM as a function of aCDOM(440) for (a) the whole salinity range and (b) salinity ≥ 28 (below the UPML). See Fig. 5 for symbols. Data from previous campaigns in the Western Arctic Ocean are also shown: Western Shelf-Basins Interactions (SBI) cruises for spring (SBI spr: grey open circles) and summer (SBI sum: grey closed circles) and Japanese Arctic campaign for autumn (MR aut: grey crosses) (Matsuoka et al., 2011).
The negative correlation between aCDOM(440) and salinity
was not observed in the LPML, indicating optical properties between the UPML and the LPML were different. Rather, a weak but significant and positive correlation was observed in the LPML. aCDOM(440) values in this layer were
signifi-cantly lower than in the layer below, the PSW (p < 0.0001). The lower values might be explained by the removal of CDOM from the water mass due to brine rejection during fall. This phenomenon was demonstrated in laboratory ex-periments (Amon, 2004), and observed over Russian shelves in autumn as a significant mechanism for the export of ter-rigenous dissolved organic nitrogen (Dittmar, 2004). The similar positive correlation between aCDOM(440) and
salin-ity was also found in the PSW. The higher aCDOM(440)
val-ues in this water mass compared to that in the layer above is likely attributed to the transport of CDOM by the lateral
intrusion of waters into the PSW layer from the Bering Sea during summer (Matsuoka et al., 2011).
In the Arctic Ocean, phytoplankton blooms occur in near surface waters in early spring, and a deep chlorophyll maxi-mum is developed around 60–80 m depth (defined as PSW in this study) in summer in our study area (e.g., Fig. 3e; Trem-blay et al., 2008). During our observations, there was a sig-nificant and positive correlation between aCDOM(440) and chl
aconcentration (r2=0.35 and 0.32 for surface and PSW, re-spectively; p < 0.05 and <0.001, respectively). This result suggests that autochthonous CDOM could be produced as a result of phytoplankton degradation in these layers, and con-tribute to the CDOM pool.
Fig. 8. Relationship between DOC and salinity (S) for (a) the whole range and (b) S ≥ 28 (below the UPML). See Fig. 5 for symbols. A linear fit provides the DOC vs. salinity relationship: DOC = 486–16* S (r2=0.89; p < 0.0001).
Fig. 9. Relationship between DOC and aCDOM(440) for (a) the whole salinity range and (b) salinity ≥ 28 (below the UPML). See Fig. 5 for symbols. A linear fit provides the following relationship: DOC = 55 + 357*aCDOM(440) (r2=0.97; p < 0.0001).
The relationship between aCDOM(440) and salinity was
significantly negative in the PWW/UHW and LHW, suggest-ing the waters originated from Arctic coastal areas. This as-sumption is partly supported by the fact that the PWW/UHW is formed in the Alaskan coastal regions and/or coastal polynyas (Winsor and Chapman, 2002), whereas the LHW is formed in the Barents Sea during sea ice formation (Aa-gaard et al., 1989). It is noted that the coefficient of de-termination was significant and relatively high in the LHW (r2=0.63, p < 0.01). If this negative correlation were ex-trapolated to zero-salinity, aCDOM(440) value at zero-salinity
(0.93 m−1)would be close to the one reported for Kara Sea (1.3 m−1: Aas et al., 2002), which is adjacent to the Bar-ents Sea (aCDOM(440) values for the Barents Sea are not
available). Although the coefficient of determination was not so high, this result suggests that the observed CDOM could partly originate in coastal areas receiving riverine discharge. The SCDOMvalues were significantly different among the
LPML, the PSW, PWW/UHW, and the LHW (p < 0.0001 for the three neighbor water masses). Carder et al. (1989) and Blough and Del Vecchio. (2002) showed the magnitude of SCDOMvalue varies due to bulk sources and/or local
pro-cesses of CDOM. General properties of SCDOM are further
discussed at the end of this section with a∗
CDOM(440) values.
No trends between SCDOMand aCDOM(440) were evident
in the UPML, which is consistent with observations in sur-face coastal waters at moderate latitudes (Vodacek et al., 1997; Babin et al., 2003). SCDOMand aCDOM(440) were
in-versely related in several deeper water masses (except the LHW) as reported previously in polar waters (e.g., Matsuoka et al., 2011). Relationships between SCDOMand aCDOM(440)
are influenced by sources, transformations, or both (Carder et al., 1989; Twardowski and Donaghay, 2002). The negative correlations observed in this study were not very strong, so it is difficult to determine the relative contributions of sources and transformations on CDOM absorption properties.
We observed highly variable DOC concentrations in the southern Beaufort Sea, which is consistent with observations in other Arctic waters (e.g. Guay et al., 1999; Benner et al., 2005). A negative relationship between DOC concentration and salinity was observed in the UPML (r2=0.89), indi-cating the influence of the Mackenzie River on surface water DOC concentrations in the Southern Beaufort Sea. Below the UPML, the concentrations of DOC (65 ± 6 µM) were much
934 A. Matsuoka et al.: Tracing CDOM for Arctic waters
Fig. 10. Variations of SCDOMvs. a∗CDOM(440) for (a) the whole salinity range and (b) salinity ≥ 30.7. The upper limit from Nelson and Siegel (2002) is depicted as a dotted line. To obtain those values, aCDOM(440) was estimated from aCDOM(325) by assuming SCDOM= 0.015 nm−1. See Fig. 5 for symbols. A linear fit provides the following relationship: SCDOM=0.021 − 0.046* a∗CDOM(440) (r2=0.56; p <0.0001).
lower, indicating different sources of DOC in these water masses. The differences in optical characteristics between surface and subsurface water masses also indicated differ-ences in the composition of DOC. At zero-salinity, DOC concentrations at the mouth of the Mackenzie River were lower than those measured in major Siberian Rivers (Amon, 2004; Raymond et al., 2007). The lower zero-salinity DOC concentrations in the Western Arctic Ocean (486 µM ob-tained from this study) relative to that in the Eastern Arc-tic Ocean (694 µM obtained from Amon, 2004) is likely due to lower DOC concentrations in high latitude watersheds of North America compared to those in Siberia (Raymond et al., 2007).
The peak DOC flux from the Mackenzie River, which oc-curs during ice melt in the early spring (e.g., Carmack et al., 2004; Holmes et al., 2008), was prior to the MALINA cruise. The contribution of DOC during the freshet is likely important in terms of the DOC budget and should be taken into account (Holmes et al., 2008). In addition, some of the DOC delivered by river discharge during that time pe-riod is bioavailable, thereby stimulating microbial processes (Moran and Zepp, 1997). Thus, more detailed observation of DOC concentrations, especially in this time period, is re-quired to understand biogeochemical processes.
Our mean value of a∗
CDOM(440) was 0.10 ± 0.07 in the
UPML, which was higher than the upper limit of this value for oceanic waters (0.07 m2g−1; Nelson and Siegel,
2002). Our mean value of a∗CDOM(440) in the LPML was 0.043 ± 0.010, which was much lower and less variable com-pared to that in the UPML. This suggests that river influence is greatest in surface waters (<20 m depth: within UPML), which is consistent with previous findings in this region (e.g., Macdonald et al., 1989; Carmack et al., 2004).
Below the LPML, there was a negative correlation be-tween SCDOM and a∗CDOM(440). From laboratory
experi-ments, Moran et al. (2000) and Helms et al. (2008)
demon-strated that microbial activities are associated with a de-crease in SCDOM over time, which is opposite to the
ef-fect of photobleaching by solar irradiation (Moran et al., 2000; Blough and Del Vecchio, 2002; Twardowski and Don-aghay, 2002; Helms et al., 2008). Our lower SCDOM (or
higher a∗
CDOM(440)) values in the PWW/UHW compared
to those in the LHW could result from microbial activi-ties. A slightly but significantly higher value of AOU in the PWW/UHW (90 ± 1 µM) than in the LHW (75 ± 1 µM) could partly support more biological consumption over time in the PWW/UHW than in the LHW (p < 0.0001). These water masses also have different sources, which could con-tribute to the observed differences in SCDOM. While
trans-port of CDOM for Arctic waters is mainly explained by hy-drography, CDOM absorption properties such as SCDOMfor
each water mass seem to be partly influenced by local micro-bial processes especially in the PWW/UHW and the LHW. More detailed knowledge about the differences in sources of CDOM between Western and Eastern Arctic Ocean are needed to investigate this further.
5.2 Implications for estimating DOC concentrations in the surface layer of the Southern Beaufort Sea using satellite ocean color remote sensing
In this study, we found that DOC concentrations were highly correlated with aCDOM(440) in the UPML (r2=0.97), which
is consistent with recent papers (e.g., Mannino et al., 2008; Fichot and Benner, 2011). In particular, our regression was similar with that obtained in the U.S. Middle Atlantic Bight (Mannino et al., 2008; DOC vs. aCDOM(440) relationship
was obtained assuming a SCDOMof 0.018 nm−1 to convert
aCDOM(412) to aCDOM(440)). This result suggests that a
sim-ilar positive correlation can be applied to both areas to esti-mate DOC concentrations using aCDOM(440) values.
The strong correlation between DOC concentrations and aCDOM(440) in the UPML obtained in this study suggests
that when aCDOM(440) values are obtained using ocean color
remote sensing, DOC concentrations can be also estimated from satellite. Recently, B´elanger et al. (2008) developed an empirical ocean color algorithm to derive the ratio of aCDOM(λ)to at(λ)at 412 nm for coastal water environments using global datasets that include samples from the South-ern Beaufort Sea. In addition, previous papers indicated that at(λ) can be estimated accurately for Arctic waters using an inversion model such as Lee’s quasi-analytical algorithm (QAA) (Lee et al., 2002, 2009; B´elanger et al., 2006; Mat-suoka et al., 2007). Combining those two algorithms together with DOC versus aCDOM(440) relationship, it is now
possi-ble to estimate DOC concentrations in the surface layer (i.e., UPML) of the Southern Beaufort Sea using satellite ocean color data. This kind of semi-analytical method is further useful for estimating DOC budgets for Arctic coastal waters. Note that the relationship between aCDOM(440) and DOC
might be influenced by changes in the fraction of freshwa-ter due to ice-melt conditions. Thus, estimates of DOC con-centrations could be biased in these waters and should be considered with caution.
6 Conclusions
Our results show that aCDOM(440) is a useful seawater
prop-erty to distinguish water masses when combined with other readily measured properties such as salinity. It allowed us to better describe the local distribution of water masses in the Southern Beaufort Sea. For extensive surveys, CDOM absorption can be determined using its fluorescence sig-nal (fCDOM)once the relationship between aCDOM(440) and
fCDOM is established (see Appendix A3). On few
occa-sions, fCDOMmeasurements have been combined with CTD
deployments in the frame of large-scale surveys in Arctic Ocean (Amon, 2004). The use of new sampling platforms such as profiling floats and underwater gliders in the Arctic Ocean is developing. Measurements of fCDOMon those
plat-forms together with measurements of temperature, salinity, oxygen using an optode, and nitrate using a miniaturized in situ UV spectrophotometer (Johnson et al., 2009) may soon allow describing the pan-arctic distribution of water masses. While transport of CDOM in Arctic waters is mainly driven by hydrography, CDOM absorption properties such as SCDOM for each water mass seem to partly reflect local
microbial activities, especially in the PWW/UHW and the LHW, which is consistent with previous results (Nelson et al., 1998). More detailed analyses are necessary to better un-derstand the linkages.
In terms of ocean color applications, a tight relationship between CDOM absorption and DOC is useful to estimate DOC concentrations in the surface layer using satellite ocean color data, especially in southern Beaufort Sea waters. As-suming that DOC concentrations in the surface layer de-crease linearly to the bottom of the mixed layer, where DOC
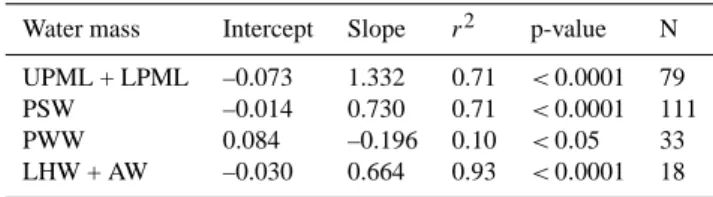
Table A1. Coefficients of the aCDOM(440) versus fCDOM relation-ship for each water mass of the Southern Beaufort Sea.
Water mass Intercept Slope r2 p-value N UPML + LPML –0.073 1.332 0.71 <0.0001 79 PSW –0.014 0.730 0.71 <0.0001 111 PWW 0.084 –0.196 0.10 <0.05 33 LHW + AW –0.030 0.664 0.93 <0.0001 18
concentrations are relatively constant, it is possible to esti-mate DOC budget in the water column. This work is required to understand modification in DOC budget for Arctic waters in the context of ongoing global warming.
Appendix A
Variability in CDOM absorption for difference waters
A1 Difference in CDOM absorption between
water samples from the CTD/Niskin and from the barge/zodiac
We examined the difference in aCDOM(440) values between
samples collected from the CTD/Niskin and those collected from the barge or zodiac in Arctic waters (Fig. A1). When all data points were analyzed (except one outlier, dotted circle in Figure A1a), aCDOM(440) values were significantly higher
for samples collected from the barge or zodiac (Fig. A1a;
p <0.0001). This still hold true when considering only the low aCDOM(440) values (<0.2 m−1; Fig. A1b; p < 0.0001).
These results suggest that a thin layer (i.e., 0 to 0.5 m depth) exists at the surface of the Arctic Ocean, in which aCDOM(440) value is significantly higher than in the deeper
layers. The thin layer of the Arctic Ocean seems to be formed by freshwater input of river discharge, sea ice melt, or both (see Fig. 6 for example). This fact could have important im-plications for satellite ocean color remote sensing applied to Arctic waters.
A2 Comparison of CDOM absorption between a liquid waveguide system and a traditional spectrophotometer
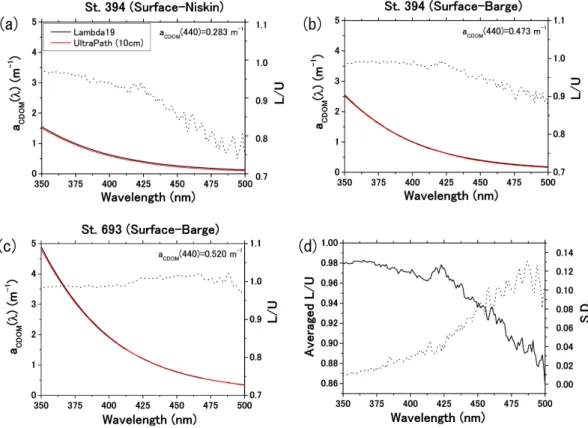
We examined the differences in aCDOM(440) values between
a liquid waveguide system (UltraPath) and a traditional spec-trophotometer (Perkin-Elmer Lambda 19) (Fig. A2) for three samples. For this comparison, a 10 cm optical pathlength was used for both instruments. The ratio of aCDOM(440) values
measured using a Lambda 19 (L) and using an UltraPath (U) varied from 0.74 to 1.02 (Fig. A2a–c), but the correspond-ing coefficient of determination varied on average between
936 A. Matsuoka et al.: Tracing CDOM for Arctic waters
Fig. A1. Comparison of aCDOM(440) values between samples from a CTD/Niskin and from a barge. (a) aCDOM(440)-Barge vs. aCDOM(440)-CTD/Niskin at aCDOM(440)<0.5 m−1 (all data points included, N = 22) and (b) aCDOM(440)-Barge vs. aCDOM (440)-CTD/Niskin at aCDOM(440)<0.20 m−1 (N = 20). In both cases, the slope of aCDOM(440)-Barge vs. aCDOM(440) -Niskin relationship was found to be significantly different from 1 (p < 0.0001 for both figures a and b).
Fig. A2. Comparison of CDOM absorption spectra between a liquid waveguide system (UltraPath) and a traditional spectrophotometer (Lambda 19) at (a) station 394 (water from Niskin), (b) station 394 (water from barge), and (c) station 693 (water from barge). (d) average value of the ratio (L/U) between values measured with the Lambda 19 spectrophotometer (L) and with the Ultrapath (U) and its standard deviation (dotted curve) within the spectral range from 350 to 500 nm (where the spectral slope of CDOM absorption is calculated).
Fig. A3. Relationship between aCDOM(440) and CDOM fluores-cence, fCDOM, for water masses of the Southern Beaufort Sea. Data points for UPML + LPML, PSW, PWW, and LHW + AW are shown as blue, cyan, yellow, and orange open circles, respectively.
0.98 (at 350 nm) and 0.86 (at 500 nm) in the spectral domain from 350 to 500 nm where SCDOMwas calculated. This
re-sult suggests that aCDOM(440) values measured using both
instruments agree reasonably well.
A3 Relationships between CDOM absorption and fluorescence for water masses of the Southern Beaufort Sea
While CDOM absorption is a useful seawater property to distinguish water masses when combined with other read-ily measured properties such as salinity, continuous field measurements at high spatial resolution are impractical. In-stead, a CDOM fluorometer can be easily combined with autonomous instruments such as profiling floats and under-water gliders, therefore allowing fCDOMmeasurements to be
conducted for extensive surveys. In addition, high resolution in situ measurements of fCDOMusing a WetStar fluorometer
have been found to be an excellent predictor of aCDOM(λ)in
various aquatic systems (Belzile et al., 2006).
By exciting light in the wavelength ranging from λ1 to
λ2nm to a target, fCDOM captures the emitted light at the
wavelength λ3within an acceptance angle using a Backscat
1 fluorometer (350, 460, and 550 for λ1, λ2, and λ3nm,
re-spectively in this study). Instead, CDOM absorption is a bulk measurement of total light absorbed by a water sample in a spectral range (e.g., 200 to 700 nm in this study). Since both fCDOM and aCDOM(λ) are related to the optical fraction of
DOM, they usually covary in natural waters, but the ratio between fCDOM and aCDOM(λ)depends on the fluorescence
quantum yield of the various fluorophores present in the wa-ter masses (Zepp et al., 2004; Belzile et al., 2006).
In this study, we examined the relationship between dis-crete aCDOM(440) (filtered through 0.2 µm membrane) and
in situ fCDOM(unfiltered) for water masses of the Southern
Beaufort Sea (Fig. A3 and Table A1). At salinity <30.7 (i.e., UPML + LPML), aCDOM(440) was significantly and
positively correlated with fCDOM (r2=0.71, p < 0.0001;
Fig. A3). A similar strong positive correlation was observed for PSW (r2=0.71, p < 0.0001), but with a lower slope. For PWW, there was a weak but significant correlation be-tween aCDOM(440) and fCDOM (r2=0.10, p < 0.05).
Al-though more detailed analyses are required, this negative cor-relation could result from a microbial production (uptake) of light absorbing material together with the uptake (pro-duction) of a fluorophore substance. At salinity ≥33.9 (i.e., LHW + AW), a positive correlation was again observed (r2=
0.93, p < 0.0001). Slopes and intercepts for aCDOM(440)
versus fCDOMrelationships are summarized in Table A1. As
expected, if aCDOM(λk) (with λknm = 380 nm within the wavelengths of excited light) is used instead of aCDOM(440),
the correlation for each water mass is higher, except for PSW (r2=0.74, 0.62, 0.17, and 0.96 for UPML + LPML, PSW, PWW, and LHW + AW, respectively). Using those coeffi-cients, aCDOM(440) can be derived from the fCDOM value
alone in different water masses, as measured in the field, which gives access to estimates of aCDOM(440) at high
spa-tial resolution.
Acknowledgements. We are grateful to the captain and crews of the
Canadian Icebreaker CCGS Amundsen. We also thank S. Hooker, and J. Ehn for their assistance in the collection of data for this study. Comments by three anonymous reviewers are appreciated. This research was funded by the Centre National d’ ´Etudes Spatiales (CNES) for MALINA Arctic expedition. R. Benner acknowledges funding from the U.S. National Science Foundation (0713915). Edited by: E.Boss
938 A. Matsuoka et al.: Tracing CDOM for Arctic waters References
Aagaard, K.: A synthesis of the Arctic Ocean circulation, Cons. Int. Explor. Mer., 188, 11–22, 1989.
Aagaard, K. and Carmack, E. C.: The role of sea ice and other fresh water in the Arctic circulation, J. Geophys. Res., 94, 14485– 14498, 1989.
Aas, E., Hokedal, J., Hojerslev, N. H., Sandvik, R., and Sakshaug, E.: Spectral properties and UV-attenuation in Arctic marine wa-ters, in: UV radiation and Arctic ecosystems, edited by: Hessen D. O., Springer, Berlin, 2002.
Amon, R.: The role of dissolved organic matter for the organic carbon cycle in the Arctic Ocean, in: The organic carbon cy-cle in the Arctic Ocean, edited by: Stein R. and Macdonald R. W., Springer, New York, 2004.
Babin, M., Stramski, D., Ferrari, G. M., Claustre, H., Bricaud, A., Obolensky, G., and Hoepffner, N.: Variations in the light absorp-tion coefficients of phytoplankton, nonalgal particles, and dis-solved organic matter in coastal waters around Europe, J. Geo-phys. Res., 108, doi:10.1029/2001JC000882, 2003.
B´elanger, S., Xie, H., Krotkov, N., Larouche, P., Vincent, W. F., and Babin, M.: Photomineralization of terrigenous dissolved or-ganic matter in Arctic coastal waters from 1979 to 2003: Interan-nual variability and implications of climate change, Global Bio-geochem. Cycles, 20, doi:10.1029/2006GB002708, 2006. B´elanger, S., Babin, M., and Larouche, P.: An empirical ocean color
algorithm for estimating the contribution of chromophoric dis-solved organic matter to total light absorption in optically com-plex waters, J. Geophys. Res., 113, doi:10.1029/2007JC004436, 2008.
Belzile, C., Roesler, C. S., Christensen, J. P., Shakhova, N., and Semiletov, I.: Fluorescence measured using the WETStar DOM fluorometer as a proxy for dissolved organic absorption, Estuar. Coast. Shelf Sci., 67, 441–449, 2006.
Benner, R. and Strom, M.: A critical evaluation of the analytical blank associated with DOC measurements by high-temperature catalytic oxidation, Mar. Chem., 41, 153–160, 1993.
Benner, R., Louchouarn, P., and Amon, R. M. W.: Terrigenous dis-solved organic matter in the Arctic Ocean and its transport to sur-face and deep waters of the North Atlantic, Global. Biogeochem. Cycles., 19, GB2025, doi:10.1029/2004GB002398, 2005. Blough, N. V. and Del Vecchio, R.: Chromophoric DOM in the
coastal environment, in: Biogeochemistry of marine dissolved organic matter, edited by: Hansell D. A. and Carlson C. A., Aca-demic press, California, 2002.
Bricaud, A., Morel, A., and Prieur, L.: Absorption by dissolved organic matter of the sea (yellow substance) in the UV and visible domains, Limnol. Oceanogr., 26(1), 43–53, 1981.
Bricaud, A., Babin, M., Claustre, H., Ras, J., and Ti`eche, F.: Light absorption properties and absorption budget of Southeast Pa-cific waters, J. Geophys. Res., 115, doi:10.1029/2009JC005517, 2010.
Camill, P.: Permafrost thaw accelerates in boreal peatlands during late-20th century climate warming, Climatic Change, 68, 135– 152, 2005.
Carder, K. L., Steward, R. G., Harvey, G. H., and Ortner, P. B.: Marine humic and fulvic acids: Their effects on remote sensing of ocean chlorophyll, Limnol. Oceanogr., 34, 68–81, 1989.
Carmack, E. C., Macdonald, R. W., and Papadakis, J. E.: Water mass structure and boundaries in the Mackenzie shelf estuary, J. Geophys. Res., 94, 18043–18055, 1989.
Carmack, E., Macdonald, R. W., and Jasper, S.: Phytoplankton pro-ductivity on the Canadian Shelf of the Beaufort Sea, Mar. Ecol. Prog. Ser., 277, 37–50, 2004.
Coachman, L. K., Aagaard, K., and Tripp, R. B.: Bering strait, The university of Washington press, 172 pp., 1975.
Codispoti, L. A., Flagg, C., Kelly, V., and Swift, J. H.: Hydro-graphic conditions during the 2002 SBI process experiments, Deep Sea Res. Pt. 2, 52, 3199–3226, 2005.
Dittmar, T.: Evidence for terrigenous dissolved organic nitrogen in the Arctic deep Sea, Limnol. Oceanogr., 49, 148–156, 2004. Emmerton, C. A., Lesack, L. F. W., and Vincent, W. F.: Nutrient
and organic matter patters across the Mackenzie river, estuary and shelf during the seasonal recession of sea-ice, J. Mar. Sys., 74, 741–755, 2008.
Fichot, C. G., and Benner, R.: A novel method to estimate DOC cocentrations from CDOM absorption coefficients in coastal wa-ters, Geophys. Res. Lett. 38, doi:10.1029/2010GL046152, 2011. Guay, C. K., Klinkhammer, G. P., Falkner, K. K., Benner, R., Coble, P. G., Whitledge, T. E., Black, B., Bussell, F. J., and Wagner, T. A.: High-resolution measurements of dissolved organic carbon in the Arctic Ocean by in-situ fiber- optic spectrometry. Geophys. Res. Lett. 26, 1007–1010, 1999.
Helms, J. R., Stubbins, A., Ritchie, J. D., and Minor, E. C.: Absorp-tion spectral slopes and slope ratios as indicators of molecular weight, sources, and photobleaching of chromophoric dissolved organic matter, Limnol. Oceangr., 53, 955–969, 2008.
Hill, V.: Impacts of chromophoric dissolved organic material on surface ocean heating in the Chukchi Sea, J. Geophys. Res., 113, doi:10.1029/2007JC004119, 2008.
Holmes, R. M., McClelland, J. W., Peterson, B. J., Shiklomanov, I. A., Shiklomanov, A. I., Zhulidov, A. V., Gordeev, V. V., and Bobrovitskaya, N. N.: A circumpolar perspective on fluvial sed-iment flux to the Arctic Ocean, Global Biogeochem. Cycles, 16(4), doi:10.1029/2001GB001849, 2002.
Holmes, R. M., McClelland, J. W., Raymond, P. A., Franzer, B. B., Peterson, B. J., and Stieglitz, M.: Lability of DOC transported by Alaskan rivers to the Arctic Ocean, Geophys. Res. Lettr., 35, L03402, doi:10.1029/2007GL032837, 2008.
Johnson K. S., Berelson, W. M., Boss, E. S., Chase, Z., Claustre, H., Emerson, S. R., Gruber, N., K¨ortzinger, A., Perry, M. J. and Riser, S. C.: Observing biogeochemical cycles at global scales with profiling floats and gliders: prospects for a global array. Oceanography, 22(3), 216–225, 2009.
Kirk, J. T. O.: Light and Photosynthesis in Aquatic Ecosystems, 2 Edn., Cambridge Univ. Press, New York, 1994.
Lee, Z. P., Carder, K. L., and Arnone, R. A.: Deriving inherent optical properties from water color: a multiband quasi-analytical algorithm for optically deep waters, Appl. Opt., 41, 5755–5772, 2002.
Lee, Z. P., Lubac, B., Werdell, J., and Arnone, R.: An update of the Quasi-Analytical Algorithm (QAA v5), available at http://www. ioccg.org/groups/Software OCA/QAA v5.pdf, 2009.
Macdonald, R. W., Carmack, E. C., McLaughlin, F. A., Iseki, K., Macdonald, D. M., and O’Brien, M. C.: Composition and modi-fication of water masses in the Mackenzie shelf estuary, J. Geo-phys. Res., 94, 18057–18070, 1989.
Macdonald, R. W., Carmack, E. C., McLaughlin, F. A., Falkner, K. K., and Swift, J. H.: Connections among ice, runoff and atmo-spheric forcing in the Beaufort Gyre, Geophys. Res. Lett., 26, 2223–2226, 1999.
Mannino, A., Russ, M. E., and Hooker, S. B.: Algorithm devel-opment and validation for satellite-derived distributions of DOC and CDOM in the U.S. Middle Atlantic Bight, J. Geophys. Res., 113, C07051, doi:10.1029/2007JC004493, 2008.
Matsuoka, A., Larouche, P., Poulin, M., Vincent, W., and Hattori, H.: Phytoplankton community adaptation to changing light lev-els in the southern Beaufort Sea, Canadian Arctic, Estuar. Coast. Shelf Sci., 82, 537–546, 2009.
Matsuoka, A., Hill, V., Huot, Y., Bricaud, A., and Babin, M.: Sea-sonal variability in the light absorption properties of western Arctic waters: parameterization of the individual components of absorption for ocean color applications, J. Geophys. Res., 116, doi:10.1029/2009JC005594, 2011.
Matsuoka, A., Huot, Y., Shimada, K., Saitoh, S., and Babin, M.: Bio-optical characteristics of the Western Arctic Ocean: Impli-cations for ocean color algorithms, Can. J. Remote Sen., 33, 503– 518, 2007.
McClleland, J. W., Dery, S. J., Peterson, B. J., Holmes, R. M., and Wood, E. F.: A pan-arctic evaluation of changes in river dis-charge during the latter half of the 20th century, Geophys. Res. Lettr., 33, L06715, doi:10.1029/2006GL025753, 2006.
Miller, W. L. and Moran, M. A.: Interaction of photochemical and microbial processes in the degradation of refractory dis-solved organic matter from a coastal marine environment, Lim-nol. Oceanogr., 42, 1317–1324, 1997.
Miller, W. L. and Zepp, R. G.: Photochemical production of dis-solved inorganic carbon from terrestrial organic matter: signifi-cance to the oceanic organic carbon cycle, Geophys. Res. Lett., 22, 417–420, 1995.
Miller, W. L., Moran, M. A., Sheldon, W. M., Zepp, R. G., and Opsahl, S.: Determination of apparent quantum yield spectra for the formation of biologically labile photoproducts, Limnol. Oceanogr., 47, 343–352, 2002.
Moran, M. A. and Zepp, R. G.: Role of photoreactions in the for-mation of biologically labile compounds from dissolved organic matter, Limnol. Oceanogr., 42, 1307–1316, 1997.
Moran, M. A., Sheldon Jr, W. M., and Zepp, R. G.: Carbon loss and optical property changes during long-term photochemical and bi-ological degradation of estuarine dissolved organic matter, Lim-nol. Oceanogr., 45, 1254–1264, 2000.
Nelson, N. B. and Siegel, D. A.: Chromophoric DOM in the Open Ocean, in: Biogeochemistry of marine dissolved organic matter, edited by: Hansell D. A. and Carlson C. A., Academic press, San Diego, 2002.
Nieke, B., Reuter, R., Heuermann, R., Wang, H., Babin, M., and Therriault, J. C.: Light absorption and fluorescence properties of chromophoric dissolved organic matter (CDOM), in the St. Lawrence Estuary (Case 2 waters), Cont. Shelf Res., 17, 235– 252, 1997.
Opsahl, S., Benner, R., and Amon, R. W.: Major flux of terrige-nous dissolved organic matter through the Arctic Ocean, Limnol. Oceanogr., 44, 2017–2023, 1999.
Pegau, W. S., Gray, D., and Zaneveld, J. R. V.: Absorption and at-tenuation of visible and near-infrared light in water: dependence on temperature and salinity, Appl. Opt., 36, 6035–6046, 1997.
Peterson, B. J., R, Holmes, M., McClelland, J. W., Vorosmarty, C. J., Lammers, R. B., Shiklomanov, A. I., Shiklomanov, I. A., and Rahmstorf, S.: Increasing river discharge to the Arctic Ocean, Science, 298, 2171–2173, 2002.
Raymond, P.A., McClelland, J. W., Holmes, R. M., Zhulidov, A. V., Mull, K., Peterson, B. J., Striegl, R. G., Aiken, G. R., and Gurtovaya, T. Y.: Flux and age of dissolved organic carbon ex-ported to the Arctic Ocean: A carbon isotopic study of the five largest arctic rivers, Global. Biogeochem. Cycles., 21, GB4011, doi:10.1029/2007GB002934, 2007.
Retamal, L., Vincent, W. F., Martineau, C., and Osburn, C. L.: Com-parison of the optical properties of dissolved organic matter in two river-influenced coastal regions of the Canadian Arctic, Es-tuar. Coast. Shelf Sci., 72, 261–272, 2007.
Schauer, U. Muench, R. D., Rudels, B., and Timokhov, L.: Impact of eastern Arctic shelf waters on he Nansen Basin intermediate layers, J. Geophys. Res., 102, 3371–3382, 1997.
Shimada, K., Carmack, E. C., Hatakeyama, K., and Takizawa, T.: Varieties of Shallow Temperature Maximum Waters in the West-ern Canadian Basin of the Arctic Ocean, Geophys. Res. Lettr., 28(18), 3441–3444, 2001.
Shimada, K., Itoh, M., Nishino, S., McLaughlin, F., Carmack, E., and Proshutinsky, A.: Halocline structure in the Canada Basin of the Arctic Ocean, Geophys. Res. Lett., 32, L03605, doi:10.1029/2004GL021358, 2005.
Shimada, K., Kamoshida, T., Itoh, M., Nishino, S., Carmack, E., McLaughlin, F., Zimmermann, S., and Proshutinsky, A.: Pacific Ocean inflow: Influence on catastrophic reduction of sea ice cover in the Arctic Ocean, Geophys. Res. Lett., 33, doi:10.1029/2005GL025624, 2006.
Sohrin, R., and Semp´er´e, R.: Seasonal variation in total organic carbon in the northeast Atlantic in 2000–2001, J. Geophys. Res., 110, C10S90, doi:10.1029/2004JC002731, 2005.
Stroeve, J., Serreze, M., Drobot, S., Gearheard, S., Holland, M. , Maslanik, J., Meier, W., and Scambos, T.: Arctic sea ice extent plummets in 2008, EOS Trans., AGU, 89(2), 13–14, 2008. Tremblay, J.- ´E., Simpson, K., Martin, J. Miller, L. Gratton, Y.,
Barbar, D., and Price, N. M.: Vertical stability and the an-nual dynamics of nutrients and chlorophyll fluorescence in the coastal, southern Beaufort Sea, J. Geophys. Res., 113, C07S90, doi:10.1029/2007JC004547, 2008.
Twardowski, M., and Donaghay, P. L.: Photobleaching of aquatic dissolved materials: Absorption removal, spectral al-teration, and their interrelationship, J. Geophys. Res., 107, doi:10.1029/1999JC000281, 2002.
Vodacek, A., Blough, N. V., DeGranpre, M. D., Peltzer, E. T., and Nelson, R. K.: Seasonal variations of CDOM and DOC in the Middle Atlantic Bight: Terrestrial inputs and photooxidation, Limnol. Oceanogr., 42, 674–686, 1997.
Winsor, P., and Chapman, D. C.: Distribution and interannual variability of dense water production from coastal polynyas on the Chukchi Shelf, J. Geophys. Res., 107(C7), 3079, doi:10.1029/2001JC000984, 2002.
Xie, H. and Gosselin, M.: Photoproduction of carbon monoxide in first-year sea ice in Franklin Bay, southeastern Beaufort Sea, Geophys. Res. Lett., 32, L12606, doi:10.1029/2005GL022803, 2005.
940 A. Matsuoka et al.: Tracing CDOM for Arctic waters
Xie, H., B´elanger, S., Demers, S., Vincent, W. F., and Papakyriakou, T. N.: Photobiogeochemical cycling of carbon monoxide in the southern Beaufort Sea in spring and autumn, Limonl. Oceanogr., 54, 234–249, 2009.
Zepp, R. G., Sheldon, W. M., and Moran, M. Ann.: Dissolved or-ganic fluorophores in southeastern US coastal waters: correction method for eliminating Rayleigh and Raman scattering peaks in excitation-emission matrices, Mar. Chem., 89, 15–36, 2004.