UNIVERSITÉ DU QUÉBEC
MÉMOIRE PRÉSENTÉ À
L'UNIVERSITÉ DU QUÉBEC À TROIS-RIVIÈRES
COMME EXIGENCE PARTIELLE DE LA MAÎTRISE EN SCIENCES DE L'ÉNERGIE ET DES MATÉRIAUX
OFFERT EN EXTENSION
PAR L'INSTITUT NATIONAL DE LA RECHERCHE SCIENTIFIQUE
PAR
AMALA MARY JOSE
ALKALINE AQUEOUS REFORMING OF CELLULOSE TO PRODUCE HIGH PUR 1 fY HYDROGEN WITHOUT COx
Université du Québec à Trois-Rivières
Service de la bibliothèque
Avertissement
L’auteur de ce mémoire ou de cette thèse a autorisé l’Université du Québec
à Trois-Rivières à diffuser, à des fins non lucratives, une copie de son
mémoire ou de sa thèse.
Cette diffusion n’entraîne pas une renonciation de la part de l’auteur à ses
droits de propriété intellectuelle, incluant le droit d’auteur, sur ce mémoire
ou cette thèse. Notamment, la reproduction ou la publication de la totalité
ou d’une partie importante de ce mémoire ou de cette thèse requiert son
autorisation.
Résumé
Notre objectif est de développer un dispositif expérimental pour produire de l'hydrogène à partir de biomasse cellulosique sans aucune émission de C02 par une technologie de reformage en milieu alcalin aqueux. Le principe du procédé est essentiellement de recombiner la teneur en carbone de la biomasse via une réaction chimique pour former des carbonates et donc de libérer l'hydrogène dans a forme pure. L'hydrogène produit est pur à ~95 % et peut être utilisé directement dans certaines applications. La teneur en humidité de la biomasse ne modifie pas le procédé puisque de l'eau est nécessaire pendant le processus de conversion, évitant ainsi le besoin de sécher la biomasse. La réaction chimique décrivant ce procédé est :
Ni/Al-Si
(C6HIOOS) n + 12n NaOH + n H20
--->
6n Na2C03 + 12n H20 (1)Cette réaction est optiinum à des températures entre 300 et 350 oC. Le processus a été réalisé en présence de Ni pure (~ 0,3 micron, 99%) et supporté (Ni/Al-Si) comme catalyseur avec différentes concentrations alcalines afin de comparer la production d'hydrogène dans sous différentes conditions. Une étude du bilan de masse est également menée et le nombre de moles d'hydrogène produit est calculé en utilisant l'équation des gaz parfaits. Les sous-produits obtenus après la gazéification ont été analysés quantitativement et qualitativement par diffraction des rayons X (XRD), spectroscopie Raman et par titrage à double indicateur du sel. Afin de minimiser le coût des catalyseurs et apporter une valeur ajoutée aux produits dérivés, le catalyseur doit être récupéré et activé pour des réactions consécutives. L'étude de la récupération du catalyseur (Ni) a été effectuée et nous concluons que la sédimentation et la séparation magnétique se sont avérées des méthodes efficaces pour la séparation du Ni supporté et pur. Notre solution à base de 10 % de NaOH et de 90 % de Na2C03 nous apporte un rendement de catalyse de 95 % à partir d'une solution à base de 10 % de NaOH et de 90 % de Na2C03 à l'aide de méthodes de séparation du Ni.
de problèmes occasionnés par la fragilisation caustique et le
«
stress corrosion cracking » causé par l'hydrogène. Nous avons choisi l'INCONEL®600 (nickel-chrome-fer) comme matériau de fabrication pour le troisième réacteur. Ce matériel résiste à la corrosion avec des solutions caustiques à haute température et au phénomène de«
stress corrosion cracking » causé par l'hydrogène.Une production de gaz correspondant à une élévation de la pression [male de 1 0 psig, qui constitue 95% d'hydrogène, est obtenue à partir de 1 g de biomasse cellulosique et l'efficacité du système est esti~ée à 52,30 %. L'analyse quantitative par l'utilisation de titrage à double indicateur montre une présence de 2,67 g de carbonate de sodium et 0,62 g de soude dans la solution sous-produit, et donc le rendement de conversion de l'hydroxyde de sodium en carbonate de sodium est de 68,10%. La solution de sel est qualitativement analysée par diffraction des rayons X et spectroscopie Raman et identifie la présence de carbonates. Le sous-produit de la gazéification, la soude, est largement utilisé dans les industries du verre, dans la fabrication de produits chimiques tels que le bicarbonate de soude et d'autres composés contenant du sodium, la désulfuration de gaz et en blanchiment des pâtes dans l'industrie du papier.
Abstract
Hydrogen is produced from cellulosic biomass without any COX emissions using a novel aqueous alkaline reforming (AAR) technology. The principal advantage of this process is that theoreticaIly, aIl the carbon in the biomass is converted into sodium carbonate (Na2C03), a product of commercial value. The moisture content in the biomass feedstock does not affect the process, as water is needed during the conversion process, thus avoiding the need to dry the biomass. The runs were conducted with different concentrations of sodium hydroxide and both supported (Ni/Al-Si) and pure Ni (-3 micron, 99.7%) catalysts were used to compare the H2 production under different conditions. The gas produced was analyzed using agas chromatography and the number of moles of hydrogen produced was calculated using the real gas equation. Our experimental results showed that hydrogen with a purity of ~ 95 % was produced with no traces of either CO or C02, at temperatures as low as 300 - 350 oC, with 2 M NaOH, in presence of supported Ni catalyst. Mass balance study was conducted by qualitative and quantitative analyses of the by-products using XRD, Raman spectroscopy and d?uble indicator titration. The catalyst used for the gasification reaction could be recuperated and sedimentation and magnetic separation were proven to be effective methods for recuperation of supported Ni (Ni/Al-Si) and pure Ni catalysts respectively.
Acknowledgement
1 would like to thank Lord Almighty for showering his blessings upon me to fulfill my studies and would gladly surrender my work under his majesty. Without his grace and guidance 1 would not have attained it.
1 would like to thank my parents who provided me a great support and encouragement in my academic as well as in my day to day life.
1 am so grateful to my thesis director, Professor Jean Hamelin, for providing me such a wonderful opportunity to work under him which gave me an immense opportunity to leam different aspects and a great academic exposure. It was a great experience for me to work under his enthusiastic supervision and motivation.
1 would express my sincere gratitude to Sadesh Kumar Natarajan who supported me during my project. 1 thank him for providing me a good environment and facilities to complete the project.
1 would like to thank Robert Drolet and Daniel Cossement for their kind helping hand.
My sincere gratitude to Renju Zacharia for his technical guidance and wise suggestions. 1 express my sincere tha~s to my colleague Paul-André for his wonderful co-operation in the proj ect.
1 extend my thanks to my colleague Siyad Ubaid and Francis Lafontaine for the encouragement and support.
Last but not the least let me thank the funding agency, H2CAN for providing a great fmancial support throughout the project, which made it possible.
1 also place on record, my sense of gratitude to one and all, who directly or indirectly, have lent their helping hand in this venture.
Table of Content
Résumé ... ii
Abstract ... .iv
Acknowledgement ... V List of Figures ... vii
List of Tables ... viii
1. Introduction ... 1
2. Reaction Stoichiometry & Role of reactants ... 5
Stoichiometry ... 5 Role of reactants ... 5 3. Experimental Procedure ... 7 Phase 1 ... 7 Phase 2 ... 10 Phase 3 ... 11 Selection of material ... Il Reactor designing ... 12
4. Instrumental Set-up and Data Analysis ... 14
5. Results & Discussions ... 17
Phase 1 (SS 316 - 442 mL) ... ; ... 17
Phase 2 (SS 316 - 1337 mL) ... 19
Phase 3 (Alloy 600 - 1440 mL) ... 21
Hydrogen mass & Efficiency calculation ... : ... 28
Qualitative and Quantitative analysis ofthe by-product.. ... 29 .
6. Conclusion ... 32
References ... 34
List of Figures
Figure 1: SS-316 reactor under construction ... 7
Figure 2: Batch reactor (SS-316) ... 9
Figure 3: The reactor set-up for thermochemical gasification of cellulose ... 9
Figure 4: Leak from bore through thermocouple welding ... ; ...
9
Figure 5: Crack formation on the reactor wall ... 9
Figure 6: SS-316 Parr Instruments reactor.. ... 11
Figure 7: Alloy-600 reactor after heat treatment ... 14
Figure 8: Schematic representation ofthe reactor setup ... 16
Figure 9: Experimental set-up of Alloy-600 reactor.. ... 17
Figure 10: a) Pressure increase in blank run with Ar, b) Pressure increase in blank run with
H2,
c) Pressure-Temperature profile ofsample mn ... 18Figure Il: Pressure - Temperature behaviour in sample mns ... 20
Figure 12: Pressure and temperature behaviour in run (i), mn (ii), run (iii), run (iv), run (v), run (vi) and run (vii) ... 24
List of Tables
Table 1- Universal gas calibration standard ... 15
Table 2- Summary ofthe experimental runs in AIloy ... 26
Table 3 - Gas Chromat~graphy analysis data ... 27
1. Introduction
Global wanning is rising at an alanning rate and the earth's temperature is projected to rise another 2 to 11°F over the next hundred years [1]. Human activities such as fossil fuel utilization, deforestation and industrial processes contribute significantly to the release of greenhouse gases. Greenhouse gases act like a blanket that traps the infrared radiation in the atmospheie and hence causing it to wann thus increasing the global temperature. There is a huge demand for c1ean energy to protect the environment from the deleterious effects of global warming and hydrogen energy offers significant potential in this scenario as it is a c1ean and efficient energy. Hydrogen is considered as the fuel of the future mainly due to its high conversion efficiency, recyclability and non-polluting nature [2] as hydrogen combustion produces water. It has the advantage of highest energy density and safety which can supply tremendous power for stationary as well as transportation markets.
A key point related to hydrogen for energy production is that it is a substance that is not "found" like cru de oil or natural gas, but rather "made" like electricity from one of many different means. Hence it is considered as an energy carrier rather than an energy source [3]. Hydrogen usage is highly demanded in applications based on fuel cell technology along with other ways to use hydrogen for electricity production or energy storage. More than 50 types and sizes of commercial fuel cells are being sold, and the value of fuel cell shipments reached 498 million dollars in 2009 [3]. However, for fuel cell applications a high level of hydrogen purity is typically more important than for many industrial applications and thus can often entail higher costs of delivery. Vehic1es can be powered with hydrogen fuel cells, which are three times more efficient than a gasoline-powered engine [4]. Globally, the hydrogen production figure is 50 M tonnes/year [5] and the major current uses of the commercially produced hydrogen are ammonia synthesis, oil refining [6], where hydrogen is used for hYdro-treating of crude oil as part of the refining process to improve the hydrogen to carbon ratio of the fuel, food production (e.g., hydrogenation), treating metals, and producing ammonia for fertilizer and other industrial uses.
Global hydrogen production technologies can be widely divided into 3 groups, (1) thennal, (2) electrolytic, and (3) fennentation and photolytic processes [7]:
(1) Thennal processes inc1ude reforming of natural gas (steam methane reforming, partial oxidation), gasification of coal, gasification of biomass, refonning of renewable liquid fuels, and high temperature water splitting;
(2) Electrolytic processes inc1ude PEM electrolyzers, alkaline electrolyzers, and solid oxide electrolyzers;
(3) Fennentation comprises dark and photo fennentation in which hydrogen is produced from organic compounds by bacterial action. Photolytic processes inc1ude photo-biological water splitting and photo-electrochemical water splitting.
The production of hydrogen from fossil fuels causes the co-production of carbon dioxide (C02), which is assumed to be the main responsible for the so-called 'greenhouse effect' [8]. The capture of C02 for storage purposes is not yet technically and commercially proven and requires further R&D on absorption or separation processes and process line-up. A high-temperature electrolysis process is feasible only when high high-temperature heat is available as waste heat from other processes and also it requires R&D in materials development for solid-oxide fuel cell (SOFC) [9].Even though water electrolysis is a proven technology for hydrogen production, it is not quite cost competitive. The other processes for hydrogen production such as photo-electrolysis and photo-biological processes are further away from commercialization and need additional R&D [9].
The United States Department of Energy (DEO) has set certain c1ean energy goals for the upcoming years 'such as reduction of greenhouse gas (GHG) emissions and petroleum use 50% by 2030, reduce GHG emissions 83% by 2050, invest 150 billion dollars over 10 years in energy R&D to transition to a c1ean energy economy [10]. Hence there is a great emphasize to shift the hydrogen production pathways towards renewable sources of energy to reduce the environmental impact and thus to pave way towards a c1ean energy. Hydrogen produced through a range of renewable primary energy sources such as wind, biomass, and solar energy is ideal for gradually replacing fossil fuels [11]. Biomass was the major source of energy during the 19th century, which has been taken over by fossil fuel based economy
But with increasing industrialization the energy demands are so high that it requires a shift back towards biomass based ecohomy due to two major reasons; fIfst, it is a sustainable
source of renewable energy, eco-friendly with very less C02 emission and second, the high
rate of depletion of fossil fuels. Biomass energy potential is addressed to be the most promising among the renewable energy sources, due to its spread and availability worldwide [12]. The benefits of a true hydrogen economy can only be achieved if the hydrogen is derived from renewable and carbon neutral resources like biomass. Biomass, especially organic waste, offers an economic, environmental friend1y way for renewable hydrogen production [13].
Canada has a great potential of forestry and agricultural resources to provide a renewable and sustainable supply ofbio-based energy. Canada generates approximately 1.45xl0 8 t of
residual biomass per year, containing an estimated energy value of 2.28x 10 9 GJ, which is equivalent to about 22% of Canada' s current annual energy use. Conversion of these residues using emerging technologies that favor the synthesis of H2 and represses the synthesis ofC14 could generate 1.47x1O 10 m3/year ofrenewable H2, with a heating value of 1.89x1O 8 GJ [14].Thus hydrogen production from biomass has a significant role in building up a c1ean energy economy for a biomass rich developed country.
The objective of the project was to develop an experimental set-up to produce hydrogen
from cellulose biomass without any C02 emission by an aqueous alkaline reforming
technology. The principle behind the process is basically that the carbon content from the biomass combines with aqueous alkali to form carbonates and hence releases hydrogen in its pure form. The produced hydrogen is 2: 95% pure and does not require much purification to be used in other applications. The moisture content of the biomass does not affect the process as water is needed during the conversion process, thus avoiding the need to dry the biomass. The process has been carried out in presence ofpure (0.3 micron, 99%) and supported Ni (Nil Al-Si) and under different alkaline concentrations to compare the hydrogen production under different conditions. A mass balance study was also conducted and the number of moles of hydrogen produced was calculated using the real gas equation. The by-products obtained after the gasification were analyzed both qualitatively and quantitatively by XRD, Raman spectroscopy and double indicator salt titration.
The recuperation study for the Ni catalysts was also carried out and it was found that sedimentation and magnetic separation proved to be the effective methods for the separation of supported and pure Ni respectively from the gasified sample.
The entire experimental study was classified into three phases as the work was performed in three different batch reactors due to issues such as caustic and hydrogen embrittlement and stress-corrosion cracking. The third phase of batch reactor constructed with a suitable material was found successful for the aqueous alkaline reforming of biomass for hydrogen production.
2. Reaction Stoichiometry
&
Role of reactants
StoichiometryIn the following chemical reaction [15]: 1
(C6HIOOS) n
+
12n NaOH+
n H20 ---> 6n Na2C03+
12n H20 (1)as per the stoichiometry 1 mol of cellulose (162 g) reacts with 12 mols ofNaOH (480 g) and 1 mol ofH20 (18 g) in presence of Ni catalyst to produce 6 mols ofNa2C03
(636 g) and 12 mols of H2 (12x2.016 g). The mole ratio of carbon in biomass to alkali metal hydroxide is 1 :2. Hence based on the carbon content in different types of cellulose, required quantity of alk:ali metal hydroxides is added. The ratio of biomass wt. to catalyst wt. is 2.5: 1. The runs were conducted with Ni supported on Al-Si (65 wt.%) as well as with pure Ni catalyst (99.7%).
Role of reactants
NaOH: - There is a competition between the dehydration pathway and the gasification
pathway for the biomass hydrolysis products. The end product of dehydration route is char, tar, hydrocarbon gases, while the end product of gasification route is mainly hydrogen [16].
In the absence of alk:ali, dehydration and decarboxylation is favored and biomass hydrolysis products conversion to tars and chars occurs with C02 production. Tar and char formations involve the formation of furfural and 5-hydroxymethylfurfural (5HMF) from biomass compounds which are formed during the early dehydration of biomass molecules.
In the presence of alk:ali, the dehydration pathway is suppressed as the water-soluble compounds are sustained in solution which favors the gasification route owing to the conversion of biomass to simple carbonyl compounds which further promotes hydrogen production. Alkali promotes hydrogen production by capturing the C02 produced and accelerating water-gas shift reaction. It is an effective method in breaking the ester bonds between lignin, cellulose and hemicellulose and avoids fragmentation of hemicellulose polymers. Addition of NaOH also causes lowering of operating temperature and hence reduces consumption of heat [17].
The hydrogen gas yield in relation to the alkali catalyst follows the order [18]:
Ni - The addition of Rh, Ni, Ru, or Co catalysts decreased the formation of methane and increased the formation of hydrogen. The total yields of hydrogen were higher in the order of Rh! Ah03, Nil Ah03, Rui Ah03, Col Ah03 > Pd! Ah03 > Pt! Ah03 > Cul Ah03 >
Fe/A1203. Ni, Co, Rh, and Ru catalysts promote c1eavage of C-H bonds of cellulose
derivatives, reaction intermediates, and desorption of H species as H2 to the gas phase.
Therefore, the methane formation was significantly suppressed and the hydrogen formation was accelerated at low temperatures [19].
H20 - Water added in excess serves as a medium for the chemical reaction to occur as well
as to reduce the charring process. It suppresses the dehydration pathway and promotes the gasification pathway for hydrogen production. The use of steam, instead of air or C02, leads to higher H2 yields due to the additional H2 produced from the decomposition of H20. Water has a catalytic role in various acid/base catalyzed processes due to its higher degree of ionization at the increased temperature. According to the transition state theory, the presence ofwater in sorne organic reactions (also sorne hydrolysis and decarboxylation reactions) can cause a decrease of the activation energy, thus affecting the kinetic of the reaction [20].
3. Experimental Procedure
The thennochemical gasification ofbiomass was conducted in three phases of study. In the first two phases, the gasification was carried out in a stainless steel reactor with different heating modes and in the third phase the gasification was perfonned in a reactor made of Inconel® A1loy-600, a Ni-based carbon free alloy. This Ni-based alloy offers high resistance to caustic stress corrosion cracking and hydrogen embrittlement compared to stainless steel.
Phase 1
In this phase, a stainless steel (SS) reactor was built from a SS-316 hollow bar based on the flange model. A batch reactor of 442 mL was built from a hollow bar of SS-316 with the dimensions 5.5" (13.97 cm) height ,4" (10.16 cm) outer diameter and 2.5" (6.35 cm) inner diameter. Bottom flange was welded on to the reactor mouth and top flange was bolted using 16 nuts. The top flange of the reactor consisted of feeding tube, gas inlet tube and gas outlet tube. The bottom of the cylinder was closed by a thick plug welded to a thickness of about 0.635 cm (0.25"). The feed from the feed hopper was introduced into the reactor using a steam service ball valve model SS-S65PS 16 from Swagelok. Figure 1 shows different parts of the reactor under construction.
Figure 1: SS-316 reactor under construction.
The reactor was heated using three high density cartridge heaters (400 W, 120 V)
the reactor wall by making three holes of appropriate diameter on the reactor wall. The reactor was provided with K-type thermocouples (1/8" SS tube well) and a high temperature pressure transducer for acquiring temperatures and pressures. Temperature of the reactants and the produced gas were acquired using bore through compression fittings which were inserted inside the reactor through the reactor surface. Temperature of the reactor was monitored real time at various points such as at the feed inlet, at the level of the produced gas, and at the reactor wall. The batch reactor and its different parts are shown in Figure 2 and the complete set-up can be seen in Figure 3.
Experimental runs were performed in 2 different ways. Initially the reactants were filled inside the feed hopper, sparged with Ar and held by the c10sure of a ball valve. The reactor alone was heated from room temperature to 300 oC and once it reached the desired temperature the ball valve was opened and the reactants were pushed into the reactor. But since the reactants were in the form of slurry a good portion of it got stuck inside the ball valve and hence the reaction was not complete. For the second run, the reactants were introduced inside the reactor, the reactor was c10sed air tight, purged with Ar to make the reactor 02-free and then heated the reactor to 300 oC. The initial pressure was 20 psig of
Ar and the runs were performed with 5 g of cellulose biomass as the feed stock. As per the stoichiometry 5 g of cellulose reacts with 14.8 g of NaOH and excess H20 (50 mL) in presence of Ni/Al-Si (2 g) catalyst. The 14.8 g ofNaOH in 50 mL H20 constitutes a 7.4M solution. Before the experimental mns, blank mns of pure H2 and Ar gases were performed to understand the thermal expansion and behaviour ofH2 and Ar at high temperatures. The reactor was insulated with Al foil backed ceramic insulation fiber to minimize the heat transfer to surroundings by convection. The reactor was heated to 300 oC and held for a retention time (RT) of 30 min. After the retention time the power was switched off and the system was allowed to cool down to room temperature. The reactor was cooled to condense the water vapour formed and hence to exclude the pressure produced from water vapour formation and it also allows the thermally expanded Ar to revert to its initial pressure.
Overtime a leak was developed on the reactor wall where the bore through thermocouples were inserted due to high pressure formation inside the reactor as a result of gasification experiment. High temperature silica containing sealant paste (Deacon 770P) was used to seal the leak between the reactor wall and the thermocouple but the paste proved inadequate due to the presence of silica in the paste which is not advisable to use with strong acids and alkalis. In the later stages a crack was observed on the reactor wall near the thermocouple welded area and it has been concluded that weI ding of the thermocouples should be avoided on curved surface under extreme conditions and harsh chemical environment. Welding is preferred on the flat surfaces like top or bottom for a high pressure reactor. Figure 4 shows the leak from the bore through thermocouple fitting and Figure 5 shows the crack formation on reactor wall.
Figure 2: Batch reactor (SS-316)
Figure 4: Leak from bore through thermocouple welding.
Figure 3: The reactor set-up for thermochemical gasification of cellulose.
Phase 2
The second phase ofthe experiment was performed using SS-316 high pressure reactor of 1337 mL volume from Parr Instruments. For the second setup, the same reactants were used as in Phase 1 (5 g cellulose and 7.4M NaOH) but with different heating modes for the reactor. The experimental runs were performed under the same conditions of temperature and initial pressure as in Phase 1; 300 oc and 20 psig Ar. The reactor is shown in Figure 6.
The reactor was heated using an ultra-high temperature tape heater with 1400 W capacity. The reactor was insulated with Al foil backed ceramic insulation fiber to minimize the heat transfer to surroundings by convection. The reactor was then allowed to cool down to room temperature. A leak was observed during the cooling process due to melting of the gasket. The gasket used was high temperature PTFE (poly tetra fluroethylene polymer) which could withstand temperatures up to 350 oC. But with long retention times, melting of the gasket occurred and hence the reactor had to be modified to use a metal (Cu) gasket. The leak issue was fixed with modification and the heating mode was improved by replacing tape heater with the mica insulated band heater (1200 W). The temperature of the reactor was monitored at the reactor wall and at the heating element. After few runs a cra~k
developed at the bottom of the reactor which resulted in the gas leak and these shows that if steel is exposed to hydrogen at high temperatures, hydrogen will diffuse into the alloy and combine with carbon to form tiny pockets of methane at internaI surfaces like grain boundaries and voids. This methane does not diffuse out of the metal, and collects in the voids at high pressure and initiates cracks in the steel. This selective leaching process is known as high temperature hydrogen attack and leads to decarburization of the steel and loss of strength and ductility [21].Thus stainless steel reactors are highly prone to caustic and hydrogen embrittlement and stress-corrosion cracking in presence of strong alkalis.
Figure 6: SS-316 Parr Instruments reactor
Phase 3
Selection of material
As cracks developed in both of the stainless steel reactors during the thermochemical gasification process, literatures [22-25] were reviewed to fmd a suitable material for reactor
construction. It was found that resistance to stress corrosion cracking (SCC) and general
corrosion in NaOH solutions and molten NaOH improves as nickel content increases in Fe-Ni-Cr, Ni-Cr-Fe and Ni-Cr-Mo alloys. This is due to the ability of nickel to form protective oxides in high pH environments. Nickel and Nickel alloys form several stable oxides or hydroxides at basic pH levels. The stable oxides and hydroxides formed by nickel at high pH levels provides a very protective passive film. The advantage of the low carbon grade
in nickel is resistance to graphitization at elevated temperatures above 600°F (316 oC). In
general, resistance to general corrosion and stress corrosion cracking increases with nickel content. Nickel alloys 200, 600 and 400 are common materials for handling hot concentrated caustic materials. The study shows that these alloys continue to exhibit good corrosion resistance at all concentrations of caustic NaOH (10%, 50% and 70%).
For high temperatures involving all concentrations of sodium hydroxide, one can use either the commercial pure ASME Standard SB-162 Nickel 200 or Nickel 201, with low-carbon
Nickel 201 being better ab ove 315 oC. These are relatively low strength alloys, so the
reactor will have to be designed to handle the high pressures (for example, extra heavy walls). Alternative choices are nickel-chromium alloys like Alloy 600 (N06600) and
Alloy 625 (N06625), with the lower molybdenum containing alloy 600 having slightly better alkaline resistance. Both the ASME Standard 168 Alloy 600 and the ASME SB-443 Alloy 625 have good high temperature strength. Of all the above, Alloy 600 was found to be the best choice [23,24] and was chosen as the material of choice for the reactor construction due to its beneficial effects in handling high concentration caustic and hydrogen embrittlement
Reactor designing
A batch reactor of Alloy-600 was designed and built with appropriate thickness and height to diameter ratio from a solid bar of Inconel® Alloy-600.
The design equations used to calculate the wall thickness t were [26, 27]:
t
=PRI
(SE - 0.6P), (2)where P is the design pressure or maximum allowable working pressure (15 MPa = 2175 psi), R is the inside radius in inches (2 inches = 50.8mm), S is the stress value of the material, psi (10.6ksi =10600psi) [23], and E is the joint efficiency (0.85) [23]. The wall thickness in inches computes to
t = 2175 psix5.08/(10600 psi xO.85 - 0.6x2175 psi) = 1.43 cm.
From the perspective of safety and probability of future modification, the reactor was provided with a wall thickness of 1" (2.54 cm) and a head to diameter ratio of 1.75. Even though torispherical head is found to be the optimum design to deal with high pressure [27], the reactor was designed with a fiat head for ease of construction.
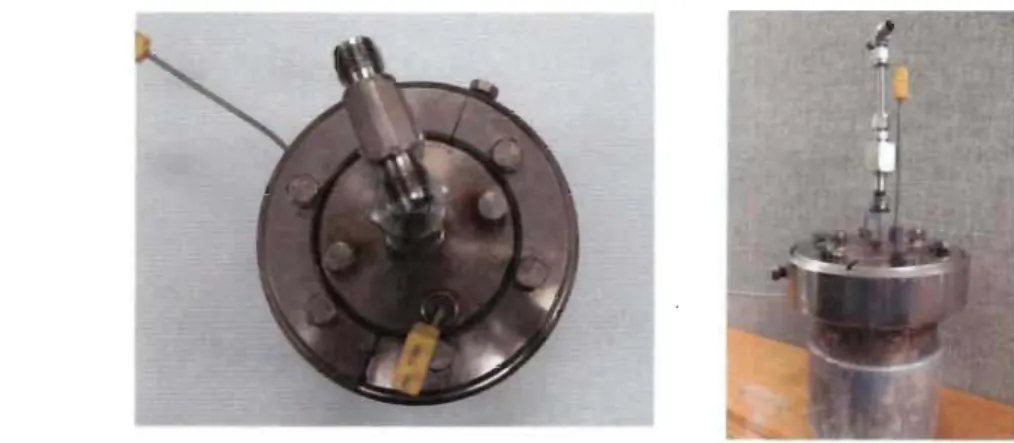
A batch reactor ofvolume 1440 mL was built from a solid bar of Inconel® Alloy-600 with the dimensions of 7" height, 6" outer diameter and 4" inner diameter. Sixteen holes were drilled on the top of the reactor and the reactor lid was screwed on to the reactor using 16 bolts. Each boIt was given a torque of 30 lb ft to make the reactor leak-free at high pressures. Copper gasket ofthickness 2.08 mm was used between the lids. The reactor was
The top flange of the reactors was fitted with agas inlet and gas outlet tube and the inlet tube was connected to an Argon cylinder which purged the reactor to make it 02-free before the reforming. After purging, the reactor was filled with 20 psig Argon before the heating began. The runs were conducted with 1 g of cellulose, 2.96 g of NaOH and Ni catalyst with excess water. The mass of feed was reduced to 1 g to reduce the pressure formation. The volume of water and amount of NaOH was varied to make the aqueous solution of alkali metal hydroxide into different concentrations such as 2 M (37 mL) and 4 M (18.5 mL). Lower concentrations of alkali metal hydroxides were chosen to avoid the caustic embrittlement and the stress-corrosion cracking of the reactor. The gasification was carried out with both supported and pure Ni (- 3 micron, 99.7%) to compare the hydrogen formation in both cases. Prior to the experiments, biomass was mixed uniformly with an aqueous solution of alkali metal hydroxide.
The A1loy-600 reactor was heated using a ceramic insulated band heater of 1300 W capacity (Tempco-BCH7895). The temperature of the reactor was monitored at the reactor wall and at the heating element. The temperature of the reactor was regulated by a PID based on the data acquired by thermocouple fitted on to the heating element. The wiring schematic of PID (Omega, CN7533) with the solid· state relay is given in Appendix B (parallel connected heaters need to be replaced by a band heater). As the temperature rose, the pressure increased inside the reactor and reached a stable value during the retention time. The set temperature of the PID was 350 oC for most of the runs and 400 oC for few other runs as the temperature regulation initiated 50 oC before it reached the set value for the PID controller. It took almost 1 h for the reactor to reach 300 oC from room temperature.
The temperature of the set-up was auto-regulated at the set value and the retenti on time of the reactor varies from 30 min to 1 h. The heating was cut off after the retention time and the reactor was allowed to cool down to condense the water vapour formed and hence to eliminate the pressure contributions from the water vapour formation and Ar expansion. Once the reactor attained the room temperature the pressure difference is noted from the initial pressure of Ar and the gas produced was analyzed using a MicroGC gas chromatograph. The gas produced as a result of the thermochemical gasification, takes its
way through the outlet tube. The reactors were provided with thermocouples and high temperature pressure transducer to monitor the temperature and pressure readings.
Figure 7: Alloy-600 reactor after heat treatment
4. Instrumental Set-up and Data Analysis
The data from the batch reactor system during the experimental run was acquired, monitored and real time graph plots were achieved using LabView version 9.0. Lab View served as the interface that allowed the measurement, test and control of the whole setup.
NI 9211(4 channel Thermocouple) and NI 9207(16 channel ana10g input) served as the input modules for the temperature and voltage-current (±1O V- ±21.5 mA) combination respectively. NI 9207 is powered externally by a 15 V power supply. It outputs the current in mA as per the pressure variation.
The MicroGC model 3000 from Agilent Technologies consists of a PLOT U column that detects carbon dioxide, ethy1ene, ethane, acetylene, and a MolSieve 5A column that detects neon, hydrogen, oxygen, nitrogen, methane and carbon monoxide. The MicroGC was
calibration standard (Table 1) and Hydrogen-Carbon-dioxide-Carbon monoxide mixture
from Praxair. Agilent Cerity software is ll:sed to control the MicroGC runs.
Table 1: Universal gas calibration standard
He 0.1000% Ne 0.0496% H2 0.0988% Û2 0.0500% N2 0.1000% CH4 Balance Ethane 0.0497% Ethylene 0.0497% C02 0.0500% CO 0.0995% Acetylene 0.494% Propane 0.0501% Methyl Acetylene 0.0501% n-Butane 0.0501%
The schematic ofthe entire set up is given in Figure 8 and the experimental set-up in
•
1 1-...
~hntc, 1 ·'toCfew-'*, 0 -_C'OCIOI04Itltt V, "t.V, ·V_ « .J~.u", . "".IUH r,..".uIUtM,
.IÎJfu AI.
...
-
K4 Ge -MIcr"oGCJOOO SSIIUA'''CUFigure 9: Experimental set-up of Alloy-600 reactor
5. Results
&
Discussions
Phase 1 (SS 316 - 442 mL)
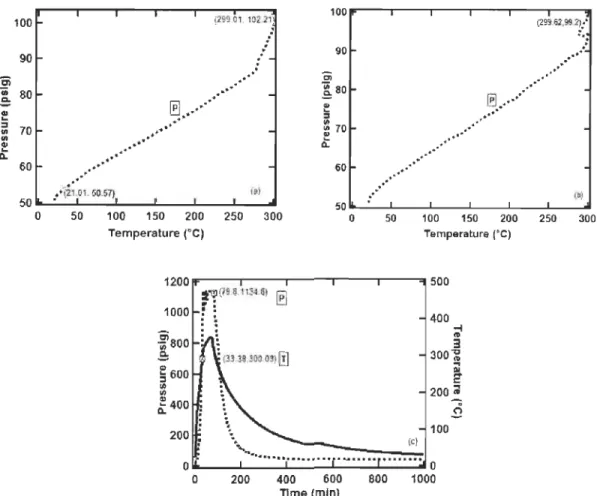
Blank: runs were performed in SS-316 reactor of 442 mL volume with pure H2 and Ar samples before the experimental runs to study the thermal expansion and behaviour of gases at the temperature (300 OC) at which the thermochemical gasification occurs. The initial pressure of the Ar and H2 were 50.57 psig and 50.89 psig respectively. It was found that pressure ofboth Ar and H2 doubled at 300 oC. There was an increase from 50.57 psig to 102.21 psig for Ar and from 50.89 psig to 99.21 psig for H2 as shown in Figure 1O.a and Figure 10.b. This indicates that the pressure of the gas almost doubled on heating from room temperature to 300 oC.
100 90 'iii ii 80 .2:
•
..
:::1 70 III III•
..
Q. 60 50 0 .jI. . . . " "..
.'
.'
.'
.' .. ' .' .' {299 01 10221...
rp1 ... l!:J.'
.'.
'
.
" ,..
.
: , -100----.---r--~-~--r--w 90 " .' .1>.-" . ... ".'
60 ~... .
.' .' .' (29962.992~::..
...... .'.'
.... .. '\71.01. 50.57) 1 (a) ••••••••• (b) 50 100 150 200 250 300 Temperature rC) 50~-·~1-_~_~_~_-L_~ o 50 100 150 200 250 300 Temperature ('C) 1200 --~--.,.---.---.---..,., 500 :t~(79 6.1134.6) !pl .. ' ~J 1000 : :.
~ 200 {cl 400 ~ 3 300~~
200 ~.rl
100 o~--~----~--~----~--~oo
200 400 600 800 1000 Tlme (min)Figure 10: a) Pressure increase in blank run with Ar, b) Pressure increase in blank run with H2. c) Pressure-Temperature profile ofsample run
Experimental runs were performed with 5 g cellulose, 14.8 g ofNaOH and excess H20 (50 mL) in presence of Ni/Al-Si (2 g) cat~lyst with 20 psig Ar at the initial pressure. An exponential increase in pressure was observed with an increase in temperature and a graph of pressure and temperature vs. time is shown in Figure lü.c. The system attained 300 oC in 33 min and was held for a retenti on time (RT) of 30 min. The maximum pressure at the end of the retention time was 1134 psig. The cool down pressure went down to 36 psig as the reactor cooled, but a crack was observed on the reactor wall which leads to gas leak from the reactor.
Phase 2 (SS 316 - 1337 mL)
The SS-316 reactor from Parr Instruments was initially heated using a tape heater and later using a mica insulated heater. The reactants composition and initial pressure were same as in phase 1.
In run 1 which is showed in Figure l1.a, the reactor surface took only 5.47 min to reach 300 oC but the pressure inside the reactor after 5.47 min reached only at 27.43 psig. Hence a longer retention time was provided for the conduction of heat from the heating element to inside the reactor and thus to improve the gasification rate and hence the pressure production. The maximum pressure developed inside the reactor was only 639.22 psig after providing a ret~ntion time of 2 h and 13 min.
In run 2 which is based on Figure l1.b, the reactor took 16.2 min to reach 300 OC but the pressure inside increased only up to 59.47 psig in 16 min. The maximum pressure developed insid~ the reactor after a retention time of2 h and 49 min was only 599.81 psig.
The pressure production was less in either of the cases which indicates lower chemical reaction rate due to less efficient heating. During the heating process even though the surface of the reactor attained 300 oC rapid1y the heat was not considerably transferred inside the reactor due to less heat of conduction from the heating element to the reactor surface. The conduction of heat was less due to the presence of air between the heating element and the reactor surface since the contact of heating element with the reactor surface was not air-tight. The trapped air in between had high insulation capacity which hindered the heat conduction to the reactor. Aiso the heat dissipation was found to be higher for tape heaters as the outer surface of tape heater is not provided with any further insulation unlike band heaters.
600 g; 500 (541~7'?2J0.20.0.!j,1'!..1 _ _ f'--,"";''1'I
..
.2: 400 ITl J f = :: 300 f II. 200 100/
/ .' f l'..
.
"
......,,
'
.çI ...... ... ,...
-.,.,.." O~~ __ ~ __ ~~ __ ~ __ L-~ __ ~O o 40 80 120 160 Tlme (min) 1200 350 ~. 300 " l,
250 i \ ! ... '" -1 l 200.à
1 .... l""
... 150..
~.
c.
;;.
100 ~ ;i
50 r " (C).
"
... 0 0 20 40 60 80 100 120 Tlme (min) 1200 ---..---...---,---,.----.... 350 :2i 800 ut S. f ::1..
..
E CI.. (01 300 250 ~ 200.à
'"
; 150S
'" 100.9
50 ~··~··-~·~··~ __ ~~ __ - L ____ ~ __ ~O o 20 40 60 80 100 Tlme (min) 700---~----~----~---500 ~ (1853,599.81)...
..
.
~ ........ .. 400 600 -g; 500 "üi.e
400e
::1 :: 300e
0. 200 100 " ..... (162.3~··· ~!r
l!J ff
.
1l
/ / ./' ~ .. 300-à (bi co Al 200ê ~ -10~
O~----~----~----~----~O 1000 800 Ci üi 600 .2: f ::1 :: 400 f CI.. 200 0 o 50 100 150 200 Time(min) 350 300 250 ~ 200.à
'"..
.,
150 ê ;; 100.9
50 (d) 0 20 40 60 80 Tlme(min) Figure Il: Pressure-Temperature behaviour in sample
runs.
Run (a) and run (b) - tape heater as heating element
Run (c) (d) and (e) - Band heater as heating element
quite better compared to the tape heater especially in the conduction of heat from the heating element to the reactor. As se en in Figure II.c using band heater, the reactor reached 300 oC in 38 min and the maximum pressure the reactor reached was 1134 psig. The retenti on time of the reaction was 30 min.
In run d (Figure l1.d) the reactor reached 300 oC in 33 min and the maximum pressure the reactor reached was 890 psig. The retenti on time of the reaction was 30 min. Only 30 mL water was added in this run unlike others and hence final pressure produced was low compared to the previous run.
In the next run (Figure II.e) the reactor reached 300 oC in 64 min and the maximum pressure the reactor reached was 1134 psig. The retention time of the reaction was 30 min. The difference in time consumption for the reactor to reach 300 oC may be due to poor insulation of the reactor in this case.
In all the ab ove runs in phase 2 the final cool down pressure of the reactor was less than the initial pressure which indicates a leak was developed during the heating process and it was due to the inadequate reactor design to handle with high pressures. By the end of fmal run, a crack was also observed on the reactor bottom due to caustic embrittlement on stainless steel.
Phase 3 (Alloy 600 - 1440 mL)
The gasification was carried out in Alloy-600 reactor with Ig of cellulose, 2.96 g ofNaOH in presence of supported and pure Ni catalysts. The initial pressure of Ar was kept at 20 psig. The volume ofwater used was 37 mL and 18.5 mL to constitute 2 M and 4 M NaOH respectively. The caustic concentration was kept low to protect the reactor from caustic embrittlement.
Figure 12 shows the temperature and pressure profile of the experimental runs, time taken for the reactor to attain 300 oC, the retention time and the maximum pressure developed inside the reactor at the end of retention time. The letter 'T' denotes the point at which the reactor attained 300 oC and 'P' is the point of max imum pressure production. It was observed reactor took an average time of70 min to reach 300 oC and was given an
average retention time of 30-45 min after it reached the 300 oC, the desired temperature. The high pressure production was mainly contributed by the water vapor formation during the heating process and it varied between 800-1000 psig. The cool down pressures of the runs conducted with catalysts varied between 26-31 psig (Table 2).
Figure 12 (i-ii) are the runs performed using pure Ni catalysts whereas Figure 12(iii-vii) are the runs conducted with supported Ni catalysts. The pure Ni weighed 0.26 g which is equivalent to the weight percent of 0.4 g of supported Ni catalyst (65 wt.%). The reactor was given a retention time of 33 min in run (i) with 2 M NaOH and 48 min in run (ii) with 4 M NaOH after it attained 300 oC, the desired temperature. The maximum pressure produced in run (i) and (ii) were 862 psig and 524 psig respectively.
Figure 12 (iii, iv, v) are the runs conducted using supported Ni catalyst and 2 M NaOH which gave a maximum pressure production of 786 psig, 832 psig and 1005 psig respectively. Figure 12 (vi, vii) are the runs using supported Ni catalyst and 4 M NaOH and the maximum pressure produced were 828 psig and 536 psig respectively. The maximum pressure formation in run (ii) and run (vii) were less compared to other runs as they were performed with 18.5 ml ofwater unlike the other runs which were performed with 37 ml of water.
1000 600 ~~(10422,8.~.39) !ITPr empmtColre ... u", -500 800
.'
l ' 'il,
...
400 ~ 0; J .!: 600 co ~ 300 ~ ::1..
:: 400 ;;..
200~ Cl. 200 100 (i) 0 - 0 0 200 400 600 800 1000 T1me (min) 1000 600A
~(l20.32.78Saj) 800 'il :\
400 ~,.
E!: 600.
-à
! iEl
(73 87300J co ::1 300 QI..
![ ~ 400 Cl..
200 .; ~ .,g 200\
100 \. roii),
..._
... 0 0 0 200 400 600 800 1000 TI me (min) 12001l"""--,---,----,.----.,..---or---.:a500 1000 :il 800..
E!: ~ 600.. ..
~ 400 200 f7l.6S.3<iO.02).
\
F:::-:] l!..=...J \. M 400 100...
__
._
...
-O~-~-~-~--L-~---O o 400 800 12.00 Tlme(mln) 600 500 iPréssor~ 500 lï emperatllre -400 ~ 400..
...
CP 300i .!: CP ! 300 .....
::1 ~ 1ft 1ft 200 ;; ! Cl. 200.9
100 ("1 0 0 0 .200 400 600 800 1000 1200 Tlme (min) 1000 500G:J
iT -800 400 Cl ~ Oi 600 300l
E!: !,.
::1~
:400 200 e ;; a. ô 200 100 -0 0 0 100 200 300 400 500 600 T1me (min) 1000.,...-...,--...,..-...,.---r---T"""-'" 500 800 200.
·
·
·
ll30.25.S26 55) :~~.
~..
\ ~ (62 . .11,3001El
\
\
... .
~ ~ (\1) ......._.
400 r; 300 ~..
~
200 iil.9
100 O~_~_-L_~_~~_L-_~O o 200 400 600 800 1000 1200 Tlme (min)600 500
~ (121.97 53G UJ
[GJ
Figure 12: Pressure and temperatureHia T
-..
400 behaviour in run (i), run (ii), run (iii).
.
,
.
,run (iv), run (v) , run (vi) and run (vii).
i 400 ~ ~ ;!123S,lOO 03) :;1
300 ~
..
\
~
Q.
..
run (i-ii) - pure Ni, run
f
300 il :s Ë (iii-vii) - supported Ni II> 200 <il..
! 200 ~ a. 100 100 (\;'J 0 0 0 400 800 1200 TIme(mln)Table 2 provides a summary of the runs performed with the cellulose feed, NaOH concentration and the type of Ni catalyst used. It also provides temperature and pressure readings before and after the gasification. The standard deviation is 1.3 for the pressures and temperatures. Initial pressure is the pressure inside the reactor before the start-up and [mal pressure is the maximum pressure produced by reforming and cool down pressure is the pressure after the reactor is cooled back to room temperature. The reactor was cooled down to condense the water vapor fo~ed and hence to eliminate the pressure contributions from water vapor and nullify the pressure due to Ar expansion at high temperature. An increase in pressure from the initial pressure was noticed in sample runs conducted with catalysts [runs (i':vii)] compared to the run without catalyst. The cool down pressures vary from 26-31 psig for the sample runs; the lower pressure (26 psig) being attributed to the mn using pure Ni catalyst.
Blank runs were also conducted using Cellulose and water [run (ix)] as well as with NaOH and water [mn (x)].In both the cases the cool down pressures (21.78 psig, 20.57 psig) reverted to the initial pressure of the reactor which infers there was no effective gas production during the gasification. Re-run sample [run (xi)] is the gasified sample which has been further heated to 300 oC after the addition of 50% of initial NaOH mass. We found no increase in pressure for the re-run sample which shows that sample which has been reformed once cannot undergo further gasification to produce hydrogen.
A sample run [run (xii)] was even conducted under lower temperature (1040
intact inside the reactor. The temperature 104 oC was chosen due to the elevation in boiling point of the water due to the presence of dissolved sodium hydroxide.
Table 2 - Summary of the experimental runs in Alloy - 600 batch reactors.
Sample Runs Cellulose Catalyst NaOU Pressure (psig) Temperature(Oq Mass (g) Mass (g) Molarity 1120 Initial Final Cool Initial Final Cool
(M) (mIJ) (Ar) down down
Sample Run (i) 1 Ni pure : 2 37 20.55 862.05 26.59 25.79 382.91 27
0.26
Sample Run (ü) 1 Ni pure : 4 18.5 20.47 524.36 29.26 23.16 370.99 25.50
0.26
Sample Run (ili) 1 Ni sup: 2 37 21.01 786.04 31.35 22.16 349.83 26.12
0.4
Sample Run (iv) 1 Ni sup: 2 37 20.22 832.96 28.94 23.35 339.61 24.82
0.4
Sample Run (v) 1 Ni sup: 2 37 20.45 1005.50 30.81 22.89 383.41 27.48
0.4
Sample Run (vi) 1 Ni sup: 4 37 20.81 828.55 28.51 23.58 350.51 28.62
0.4
Sample Run (vü) 1 Ni sup: 4 18.5 20.03 536.35 29.84 23.85 361.62 25.51
0.4
No catalyst run 1
-
2 37 20.43 816.04 22.82 23.69 326.97 25.10(vüi)
Blank Run (ix) 1
-
-
37 20.68 869.42 21.78 23.07 311.13 24.44Cellulose+U20
Blank Run (x)
-
-
2 37 20.55 832.19 20.57 23.40 23.8 24.8NaOIl+U20
Re-run Sample 1 Ni pure : 4 18.5 20.21 350.69 20.76 24.42 339.13 23.61
(xi) 0.26
Lowtemp 1 Ni sup: 2 37 20.63 41.39 21.59 27.77 104.8 37.13
The gas produced in sample runs conducted in presence of catalyst was analyzed using MicroGC 3000 and Table 3 provides the gas composition data. It was found that hydrogen constitutes about 95% of the gas produced in runs performed with supported Ni catalyst and 79% in sample run with pure Ni catalyst and 2 M NaOH and 95% with pure Ni and 4 M NaOH. The presence of 02 and N2 in the gas analysis was due to an air leak detected in
MicroGC and a small quantity of methane (C14) was also formed during the gasification. Figure 13 shows the chromatogram of the gas analysis of a typical run and the peaks have been labeled.
Table 3- Gas Chromatography analysis data
SampleRuns GC analysis (Area %)
Hz Oz NZ C~
Sample Run (i) 79.55 5.05 15.29 0.11
Sample Run (il) 95.69 1.64 2.65 0.02
Sample Run (iii) 95.2 1.50 3.10 0.67
Sample Run (iv) 90.63 2.26 6.79 0.33
Sample Run (v) 96.37 1.05 1.99 0.58
Sample Run (vi) 94.36 1.57 3.51 0.56
Sample Run (vil) 94.42 1.39 2.13 1.95
TC01 A 1 • 1
l
0,5 1,5 2 2,5 3 mi TC02A.~-
;
L .
....-,c---!
:
0.5 1.5 2 2.5 3 miFigure 13: Gas Chromatogram of a typical run
Hydrogen mass & Efficiency calculation
The pressure rise was observed for sample runs in presence of catalysts and the GC analysis showed that H2 constitutes ~ 95% of the gas produced by aqueous alkaline reforming. The reactor was cooled down to room temperature to eliminate the pressure contribution from water vapor and Argon expansion and the mass ofhydrogen formed was calculated based on the cool down pressures. The cool down pressures of the experimental runs varied from 26 psig to 31 psig for different runs.
Run (v) is taken as the sample of study and the GC analysis of run (v) shows that hydrogen constitutes 96.37 % of the total gas produced and the cool down pressure is 30.81 psig. The mass ofhydrogen produced is calculated using the real gas equation,
where P is the final cool down pressure of the reactor, V is the volume of the reactor, Z is the compressibility factor, n is the number of moles of gas, R is the universal gas constant (8.314 J mof 1 K-1), and T is the final cool down temperature. The calculation is based on the number of moles of gas present before and after the gasification run.
The number .of moles of argon, nI were calculated based on the initial pressure (20.45 psig), reactor volume (1440xlO -6 m3) and initial temperature (22.89 OC) using the real gas equation. The value of the compressibility factor (2) was obtained from the NIST table at a temperature of 22.89 oC (296.04 K) and a pressure of 20.45 psig (1 40997 Pa).The total number of moles (nl+n2) after cooling were calculated based on the final cool down pressure (30.81 psig), where n2 denotes the number of moles of H2. The value of the compressibility factor (2) is obtained from NIST table based on the mole fractions of H2 and Ar calculated from the partial pressures. Based on the final cool down pressure, reactor volume and cool down temperature, the number of moles of hydrogen produced were found to be 0.039 mole, which constitutes 0.08 g. The mass ofH2 supposed to be obtained from 1 g of cellulose with 100% conversion is 0.1493 g. Hence the efficiency of the process IS glven as
(4)
17-Mass of H2 produced by 1 g of cellulose Mass of H2 present in 1 g of cellulose
The efficiency of the process is found to be 53.80 % from the production of 0.08 g ofH2 from 1 g of cellulose. The drop in efficiency is due to the less efficient heating which reduces the gasification rate which in turn affects the hydrogen production rate.
Qualitative and Quantitative analysis of the by-product
The by-product solution was analyzed qualitatively using XRD and Raman spectroscopy techniques. Qualitative analysis is detailed in the paper; XRD pattern and Raman spectra of the sample solution are given in Figures 5 and 6 respectively (from the submitted paper). The by-product solution was analyzed quantitatively using double indicator salt titration; salt solution was titrated against 0.01 M hydrochloric acid with Phenolpthalein and Methyl Orange as the two indicators. The theory of double salt indicator titration is such that it
comprises two end points; fust one denotes the complete neutralization of NaOH and conversion of sodium carbonates to bicarbonates given by Phenolpthalein and the second one, which denotes the complete neutralization of sodium bicarbonates, is given by methyl orange. The concentration ofNaOH was calculated from the volume ofHCI obtained after the deduction of second end point volume from the first end point volume and Na2C03 concentration from the volume of HCI used to obtain the second end point. The water added before the sample run was 37 mL for 1 g of cellulose and the water remained after the run was found to be nearly 30 mL. The equation:
CIVl=C2V2 (5)
was employed for the calculation and the concentration of sodium carbonate and sodium hydroxide in the by-product sample was found to be 2.67 g and 0.62 g, respectively, in 30 mL of the solution.
The Ni catalyst used in the gasification experiment was reusable and hence could be recuperated from the solution. The Ni catalysts was separated from the by-product solution using different methods such as filtration, sedimentation, centrifugation and magnetic separation. Three methods such as sedimentation, centrifugation and magnetic separation were used for the separation process of both supported Ni and pure Ni and the results are given in Table 4.
A high yield of separation (97%) was obtained using sedimentation method for supported Ni (65 wt.%) and using magnetic separation for pure Ni (99.7%). Sedimentation is a time consUming process (3 hours) and whereas magnetic separation is a quick process (0.5 hour). Centrifugation is the second effective choice of separation for supported Ni which has a yield of 60%, while sedimentation holds the second choice of separation for pure Ni with a yield of 90%. Centrifugation requires time duration of 1 h to obtain a good deposition. Sedimentation method being more efficient and less energy expensive could be used as a method of choice for the separation process for supported Ni and magnetic separation for pure Ni.
The by-product samples are shown in Figure 14 (Fig. 7 from the submitted paper) and it is evident that the by-product solution was more c1ear in the experimental runs which used supported Ni catalyst (65 wt.% Ni/Al-Si) compared to the runs which used pure Ni (99.7%) catalyst. The fust sample is the run in which pure Ni was used and second and third are the samples which used the supported Ni catalyst. It could be observed the charring tendency was found to be high in the first sample which used pure Ni catalyst compared to the other two samples which used supported catalysts.
6. Conclusion
The experimental runs conducted in different reactors proved that stainless steel is not a good material of choice for hydrogen and caustic related processes. It can be highly prone to caustic and hydrogen embrittlement and stress-corrosion cracking
(SeC).
An alloy which has high Nickel content is a suitable material to resist the embrittlement andsee
due to the ability of Ni to form protective stable oxides and hydroxides in high pH environments which acts as a protective passive film. In general, resistance to general corrosion and stress corrosion cracking increases with nickel content. As the alloys which have high Ni content are much more expensive, a coating of Ni or Alloy-600 (Inconel) on stainless steel reactor is a suggestion to reduce the expense towards the material cost, but further experiments are required to understand the suitability.The cartridge heaters were found to be twice as efficient as band heaters as it took only 30 min for the system to reach 300
°e,
whereas with band heaters it took more than 1 h. But the insertion of cartridge heaters on reactor walls by drilling a ho le affects the reactor strength and durability. Hence if the reactor material could develop with inbuilt cartridge heaters it could save high energy input to heat up the reactor. In case of band heaters selection, band heater made of suitable material of better thermal conductivity, which provides maximum heat conduction to the reactor needs to be selected. Instead of using a single band heater it could be advantageous to use multiple band heaters of same capacity for rapid heating. Heat dissipation was found to be high for tape heaters ·compared to the band heaters. Heat dissipation can be minimized to a greater extent by using a highly efficient insulation material for the reactor. The reactor mass or the weight of the system to be heated up should be regulated by the congruent design of the system. Bore through thermocouple welding are not preferred on the curved surface for a high pressure system. Itis always recommended on the flat bottom or top surface. Torispherical headed reactors are the best to withstand high pressures and the optimum height to diameter ratio depends on the application. The reactor wall thickness should be based on the tensile strength and joint efficiency factor of the material.
10 psig of gas production, which constitutes ~ 95% of hydrogen was obtained from 1 g cellulose biomass feedstock and the efficiency of the system was found to be 53.38%. The high pressure formation in the system was due to the presence of water, which forms water vapour during the heating process. The production of hydrogen can be improved by optimizing the amount ofwater addition and hence the concentration ofNaOH required for the reforming reaction. Quantitative analysis using double indicator titration against conc.
Hel provides the presence of 2.67 g of soda ash and 0.62 g of caustic soda in the
by-product salt solution, and hence the conversion efficiency of sodium hydroxide to carbonate as 68.1O%.The salt solution was qualitatively analyzed using XRD and Raman spectroscopy which identified the presence of carbonates. The by-product of gasification, soda ash is widely used in glass industries, in the manufacture of chemicals such as baking soda and other sodium containing compounds, gas desulphurization and in pulping and bleaching process in paper industries. The Ni catalyst used in the gasification process can be recuperated and reused which makes the process cost-effective. Sedimentation and magnetic separation are chosen as the best methods for the recuperation of supported Ni and pure Ni respectively.
The conversion ofbiomass to hydrogen and soda ash is not fully complete and he~ce there
remains unconverted sodium hydroxide. Further studies need to be performed to study the conversion process of remaining sodium hydroxide to soda ash, optimisation of catalyst support and NaOH concentration. The efficiency of the system can be improved by increasing the heating efficiency, optimizing the NaOH concentration and the amount of
catalyst feed. In addition, the process can be more economical in a continuous scale of
References
[1] http://www .epa. gOY / c1imatechangelbasics/
[2] Debabrata Das, "Hydrogen production by biologie al processes: a survey ofliterature",
[nt. J. Hydrogen Energy 26:13-28(2001).
[3] Timothy Lipman, "An overview of hydrogen produc tion and storage systems with renewable hydrogen case studies", Clean Energy Stat es Alliance Report, Renewable
Energy Fuel Cell Technologies Program, US DOE, May 2011.
[4] Elif Ktrtay, "Recent advances in production of hydrogen from biomass", Energy
Conversion & Management 52: 1778-1789(2011).
[5] Akshat Tanksale, Jorge Norberto Beltramini, GaoQing Max Lu, "A review of catalytic hydrogen production processes from biomass", Renewable and Sustainable Energy
Reviews 14:166-182(2010).
[6] M. Senthil Kumar, A. Ramesh, B. Nagalingam, "Us e of hydrogen to enhance the performance of a vegetable oil fuelled compression ignition engine", [nt. J. of Hydrogen Energy 28: 1143 - 1154(2003).
[7] http://www .eoearth.org/article/Hydrogen...Production technology.
[8] Resini C, Arrighi L, Delgado MCH, Vargas MAL, Alemany LJ, Riani P, et al., "Production of hydrogen by steam reforming of C3 or ganics over Pd-Culc- Al 203 catalyst", [nt. J. of Hydrogen Energy 31:13-9(2006).
[9] Trygve Riis, Elisabet F. Hagen, Preben lS. Vie, 0ystein Ulleberg, "Hydrogen
Production - Gaps and Priorities", Institute for En ergy Technology, PO Box 40, NO-2027 Kjeller, NORWA Y.
[10] http://www.iphe.net/docslEvents/China 9-1011-3 2010-9-21 !PRE PDRD.pdf
[11] S. Yolcular, "Hydrogen production for energy u se in European Union countries and Turkey", Energy Sources, Part A: Recovery, Utilization, and Environmental Effects, 31:15,
1329-1337, DOl: 10.1080/15567030802089615
[12] A. Demirbas, "Biofuels sources, biofuel policy , biofuel economy and global biofuel projections", Energy Conversion and Management 49:2106-16(2008).
[13] Mustafa Balat, Mehmet Balat, "Political, econo mic and environmental impacts of biomass-based hydrogen", [nt. J. of Hydrogen Energy 34:3589-3603( 2009).
[14] David B. Levin,. Heguang Zhu, Michel Beland, Nazim Cicek, Bruce E. Holbei, "Potential for hydrogen and methane production from biomass residues in Canada",
Bioresource Technology 98: 654-660(2007).
[15] Minoru Ishida, Kiyoshi Otsuka, Sakae Takenaka, Ichiro Yamanaka, " One-step production of CO- and C02-free hydrogen from biomass", J Chem Technol Biotechnol 80:
281-284 (2005).
[16] Jude A. Onwudili, Paul T. Williams, "Role of sodium hydroxide in the production of hydrogen gas from the hydrothermal gasification of biomass", international journal of hydrogen energy 34: 5645-5656 (2009).
[17] Sushant Kumar, Vadym Drozd and Surendra K. Saxena, "Catalytic Studies of
Sodium Hydroxide and Carbon-monoxide Reaction", Catalysts 2:532-543(2012).
[18] Rattana Muangrat, Jude A. Onwudili, Paul T. Williams, "Influence of alkali catalysts on the production of hydrogen-rich gas from the hydrothermal gasification of food
processing waste", Applied Catalysis B: Environmental100: 44~49(201O).
[19] Minoru Ishida, Sakae Takenaka, Ichiro Yamanaka, Kiyoshi Otsuka, "Production of COx-Free Hydrogen from Biomass and NaOH Mixture: Effect of Catalysts", Energy &
Fuels 20: 748-753 (2006).
[20] Naoko Akiya, Phillip E. Savage, "Roles of Wate r for Chemical Reactions in High-Temperature Water", Chem. Rev 102: 2725-2750 (2002).
[21] http://en.wikipedia.org/wikiIHydrogen embrittlement
[22] J R Crum, L E Shoemaker, "Corrosion Resistanc e of Nickel Alloys in Caustic Solutions", Special Metals Corporation.
[23] Alloy performance guide, Rolled Alloys.
[24] Special Metals, High-Performance Alloys for Resistance to Aqueous Corrosion. [25] C. San Marchi, B.P. Somerday, "Technical Refer ence on HYdrogen Compatibility of Materials", Sandia National Laboratories, Livermore CA.
[26] Eugene F. Megyesy, Pressure Vessel Handbook, 12th Edition. [27] Pressure Vessels Design and Practice , Somnath Chattopadhyay.
Appendix A: Submitted paper
The paper has been submitted as a full1ength article to International Journal of Hydrogen