An Analysis of the Urban Consumption of Charcoal by Household:
The Case of the City of Bujumbura in Burundi
SABUHUNGU Emery Gaspard,
Economy and Rural Development unit, University of Liege-Gembloux Agro-Bio-Tech,
Belgium.
E-mail: sabemery@yahoo.fr NDIMANYA Patrice,
Rural Economy Unit, University of Burundi, Belgium.
E-mail: ndimanyap@yahoo.fr LEBAILLY Philippe,
Economy and Rural Development unit, University of Liege-Gembloux Agro-Bio-Tech,
Belgium.
E-mail: philippe.lebailly@ulg.ac.be
___________________________________________________________________________ Abstract
A study of charcoal consumption, involving 240 households, was conducted in three different districts of the city of Bujumbura in Burundi. These districts were selected according the standard of living for residents and the level of property taxes received by district. The main objective of this study was to show the different aspects of charcoal consumption by households in the city of Bujumbura. Specific requirements to identify were: charcoal consumption patterns, the amount of daily cooking, an analysis of charcoal expenditures, the coefficient of charcoal consumption (kg per person per day), and the relationship between charcoal consumption and socio- economic and demographic parameters. The results indicate that households in Bujumbura fall into three categories according to charcoal consumption patterns: those households that only use charcoal (83%), those that combine charcoal and firewood (5 %) and those that combine charcoal and electricity (12%). These results show that charcoal is the main cooking fuel for households in Bujumbura. Average spending per person per day totalled 299 BIF. A person consumes 0.78 kg of charcoal per day. The following factors influence household expenditure on charcoal: household income, the charcoal price, the household size, the number of cooking sessions per day in the household and the preparation of time consuming foods (such as cassava leaves). Charcoal consumption can lead to deforestation in areas of supply. The dissemination of improved cooking stoves can help alleviate this situation.
___________________________________________________________________________ Key words: Charcoal, procurement, expenditure, consumption, Bujumbura.
1. Introduction
Access to energy is an essential component of economic, social and political development (Djezou, 2009). Although Africa has huge potential, both in fossil and renewable energy, it also suffers from significant energy deficits (Djezou, 2009). The availability of energy for the african population is largely insufficient and the energy consumption, based primarily on biomass (wood residues), is very low. 90% of the population of sub-Saharan Africa use biomass for lighting, cooking or heating (Kauffmann, C., 2005). The availability of these fuels drops greatly in some areas due to over-exploitation (Kauffmann, 2005).
Many studies have been conducted on the use of wood energy in developing countries (Ferari, 1990; ESMAP, 1991; Bationo, 1993; Ouédraogo, 2006; Couture et al. 2008; Gazull, 2009; Meyers et al. 2009; Trefon et al., 2010). Most of these studies have focused on the substitutability between energy sources including wood, gas, electricity and fuel oil. Econometric approaches were used, based on discrete choice models or continuous models. This research is based on an assumption of energy substitutability. Its economic importance determines the type of energy chosen and the amount consumed by the household. This assumption is based on the fact that the energy used by a household depends on its socio -economic status. The authors are interested in studying the relationship between energy demand, price and income.These studies show that the higher the income, the higher more “traditional” energies (such as wood and oil) are replaced by “modern” technology (electricity and gas). In addition to the relationship between demand, price and income, these studies highlight, the important role played by socio- economic and cultural characteristics in the choice and determination of the consumption of primary energy source and secondary energy sources.
In Burundi, the energy sector is subdivided into modern energy (petroleum products, electricity, solar or wind, etc.) and traditional energy (wood, charcoal, vegetable waste, peat). According to the Ministry of energy and mines (Republic of Burundi, 2011), the balance of energy in Burundi is dominated by wood energy at 97%. This dependence of to wood energy has an negative impact as on forests and woodlands. Few studies on the wood energy sector have been completed. Those that have been done are old (Besse et Guizol, 1991). The charcoal consumption in the city of Bujumbura is very significant due to increasing urbanization and a rapid population growth. Charcoal is becoming increasingly rare and its price continues to rise. Following the increasing charcoal demand, the lack of studies in this field and the failure of charcoal substitutes, special attention is required concerning the management of forest resources supplying the city of Bujumbura. In order for stakeholders in the wood energy sector to have updated industrial data, a better understanding of the charcoal
consumption in this region is needed. Thus, this study has been undertaken to better characterize the charcoal consumption by household in the city of Bujumbura.
2. Objectives of the study
The main objective of this study is to show the different aspects of consumption of charcoal by household in the city of Bujumbura. Specific requirements to identify were: charcoal consumption patterns, the amount of daily cooking, an analysis of charcoal expenditures, the coefficient of charcoal consumption (kg per person per day) by the method "expenditure conversion" (Ouédraogo, 2006) and the relationship between charcoal consumption and socio- economic and demographic parameters.
3. Methodology
3.1. Study AreaThe study has been conducted in Bujumbura. This city is located in the west of Burundi, on the shores of Lake Tanganyika. It is surrounded by the rural province of Bujumbura (to the north by the district of Mutimbuzi, to the east by the districts of Isale and Kanyosha and to the south by the distict of Kabezi). From 1990 to 2008, the town has seen a growth rate in population of 4.2%, from 226,628 inhabitants in 1990 to 478,155 inhabitants in 2008. During the same period the national growth rate was 2.4%. The average household size was 4.9 people (Republic of Burundi, 2008). The concentration of population in the suburbs has forced the city to expand, encroaching on the rural areas. In 1990, the town was made up of 9 districts, while at present, there are 13.
3.2. Sampling
The sampling process consisted of a geographical division of the city of Bujumbura and a survey of households. A selection criteria allowed us to identify three districts for our investigations. These areas differ, depending on the standard of living of the inhabitants and the level of rental and property taxes collected by the district. The total annual revenues received by each district is divided by the number of inhabitants, in order to make a calculation per individual.
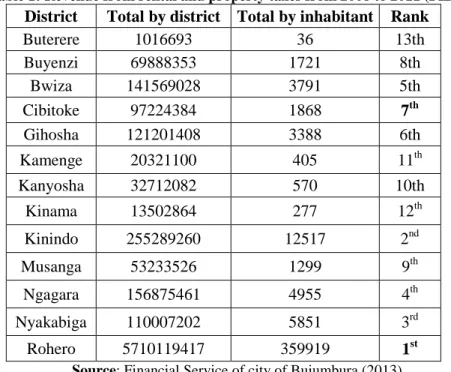
Table 1 gives the classification of districts in terms of the amount of property and rental taxes paid by each inhabitant of the district. The three selected districts are: Rohero (first place) Cibitoke (7th) and Buterere (13th) as ranked by rental and property taxes received per capita from 2008 to 2011.
Table 1: Revenue from rental and property taxes from 2008 to 2011 (FIB)
District Total by district Total by inhabitant Rank
Buterere 1016693 36 13th Buyenzi 69888353 1721 8th Bwiza 141569028 3791 5th Cibitoke 97224384 1868 7th Gihosha 121201408 3388 6th Kamenge 20321100 405 11th Kanyosha 32712082 570 10th Kinama 13502864 277 12th Kinindo 255289260 12517 2nd Musanga 53233526 1299 9th Ngagara 156875461 4955 4th Nyakabiga 110007202 5851 3rd Rohero 5710119417 359919 1st
Source: Financial Service of city of Bujumbura (2013)
The sample size is 240 households across three districts, with 80 households per district. The district is subdivided into areas. The number of households surveyed in each district is calculated by dividing the 80 households by the number of areas located in the district. Once the sample size is determined, the selection of households to be surveyed in each area is random. The issues discussed were: the socio-economic characteristics of the households, household expenditure, factors influencing spending on charcoal, ways of using charcoal, supply sources, the use of stoves, improved or otherwise, for cooking purposes.
3.3. Data Analysis
The collected data was recorded and processed using SPSS and Excel software. A descriptive analysis uses the approach of descriptive statistics for reporting, presenting and visualizing the phenomena studied. In order to identify whether there was a difference in he seasonal price for charcoal during the rainy and dry periods, an examination of average charcoal expenditure was carried out. To do this, the method of “expenditure conversion” was employed, which consists of dividing the per capita expenditure on charcoal for a given period, by the average price in kilograms of charcoal during the same period (Ouédraogo, 2006). This method has been used to determine the coefficients of coal consumption (kg per person per day). The advantages of this method are: firstly, it uses the average price of a kilogram of wood energy, calculated from the monthly measurement of wood energy alongside commercial intermediaries of this fuel. The Institute of Statistics and Economic Studies Burundi (ISTEEBU) carry out monthly weight calculations of charcoal at various points of sale in the city of Bujumbura to establish the average price of a kilogram of charcoal. Secondly, the average price reflects all information concerning the seasonal scarcity
of fuel and thus shows the relevance and the representation of the coefficient obtained by this method in relation to seasonal price changes. Thirdly, the knowledge of consumer spending on this fuel is sufficient to effectively evaluate the quantities consumed and therefore to determine the coefficient of consumption.
With the use of an econometric spending model, the analysis of socio-economic variables influencing household charcoal expenditure can be conducted. The study of factors which influence spending seeks to explain the functional relationship that exists between socio-economic situations, demographics and household spending on charcoal. The functional form in the framework of this analysis is the double-log. Linear regression was performed. The significance of the entire model has been tested by the econometric theory (Ordinary Least Squares (OLS)), the quality of the fit by the adjusted coefficient of determination R2 and the significance of individual coefficients by the Students t test.
4 Results and Discussion
4.1. ProcurementThe supply of charcoal for households in Bujumbura is connected to the purchasing of the product. Purchases can be made either from producers, wholesale traders or from retailers (IFDC, 2011). The results of our survey show that 3.7% of households buy from producers of charcoal, 0.5% buy from wholesalers, and 95.8% buy from retailers. Those households sourcing from producers are those taking advantage of work travel within the country to buy charcoal on major trunk roads to and from Bujumbura. For the transportation of coal, the latter use service vehicles (vans, police or military trucks, etc.). This group includes those that travel across the country for family celebrations (funerals, wakes, etc.) and buy charcoal on roads on their return to Bujumbura. They use their own vehicles as their means of transportation. Householders usually purchase from wholesalers during major festivals (dowries, weddings, new year celebrations, graduations, birthdays) which take place in their households.
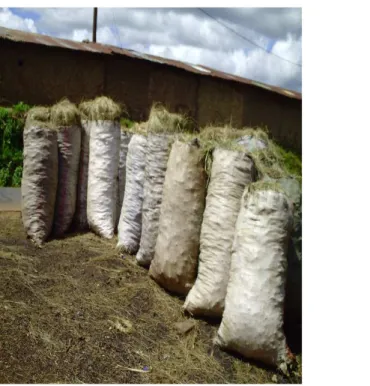
Table 2: Packaging and corresponding prices (FIB)
Packaging Corresponding
Price (in FIB)
Small container (retailer) 500 Small container (retailer) 1 000
50kg bag (producer) 1 5000
80kg bag (producer) 24 000
50kg bag (wholesaler) 20 000 80kg bag (wholesaler) 32 000
Photo 1: 50 Kg bags Photo 2: 80 Kg bags
Within the calculation framework of the consumer price index (CPI) for charcoal, the Institute of Statistics and Economic Studies of Burundi (ISTEEBU) performs monthly measurements of different packaging at different points of sale in Bujumbura in order to determine the price per kilogram of charcoal. Table 3 shows the monthly price of one kilogram of charcoal over 10 years (2004 to 2013).
Table 3: Price of one kilogram of charcoal (in FIB) from 2004 to 2013
Jan. Feb. Mar. Apr. May June July Aug. Sept. Oct. Nov. Dec. 2004 92 94.6 114.3 112 98.9 96.9 118.3 111 162.7 162.7 123.6 133.4 2005 215.9 229.1 189.3 169.3 134.2 127.2 169.5 151.7 144 138 138 126.5 2006 126 139 139 170.9 198.4 194.4 153.7 180.9 157.1 147.2 168.4 149.8 2007 164.9 228.3 197.1 180.1 173.4 190.9 187 175 190 243.6 225.3 217.5 2008 249.8 253.8 239.3 244 257.6 282.3 312.4 305.1 251.8 283.9 326.6 278 2009 279.8 279.8 317 289 249.3 286.5 297.1 305.1 326.8 348.8 263.6 311.9 2010 301 284.6 283.3 294.4 276.8 333.7 376.7 364.9 353.5 353.5 368.8 356.7 2011 319.5 338.2 356.7 436.2 358.5 343.6 335.5 354.9 347.6 362.8 3666.6 371.8 2012 363.2 378 404.8 425.8 407.2 367.9 366.4 394.4 389.1 406 371 378.2 2013 522.2 491.2 683.4 452.2 458 452.2 459.1 416.5 414.3 429.8 429.8 420.9 Source: ISTEEBU, 2013
From the data in table 3, a seasonal analysis of charcoal prices is performed in order to see if they are influenced by the seasons (rainy and dry season). The rainy season includes the months of January, February, March, April, May, September, October, November and December, while the dry season includes the months of June, July and August. It calculates
the average price for the rainy season and the average price for the dry season during a period of 10 years and examines the difference in average prices.
Table 4: Examination of the difference in average prices of charcoal during the rainy and dry seasons
season N average difference ddl T significance
rainy Season
10 275.570 115.5564
18 0.37 0.97 dry season
10 273.680 111.8387
Source: copyright data from l’ISTEEBU
The p-value (level of significance of test) is 0.97 and is greater than 5% (confidence threshold). Therefore, at 97%, the statistical analysis of the data revealed no significant difference between the average monthly price of charcoal during the dry season and of that seen during the rainy season. In other words, the price on charcoal does not vary according the season.
4.2. The consumption patterns of charcoal
Charcoal is either consumed by householders in combination with other fuels or on its own (PERACOD 2010). Charcoal is the main source of cooking energy used by households in the city of Bujumbura. Of the 240 households surveyed, 83% use only charcoal, 5% combine charcoal and firewood while 12% combine charcoal and electricity.
4.3. The number of cooking sessions per day and the equipment used for cooking
The conclusion in the city of Bujumbura is that the number of cooking sessions varies from one to three times a day according to the household. 5.4% of households cook once a day (evening). Those cooking twice daily are the most numerous, representing 85.4% (midday and evening) while the remaining 9.2% are those who cook three times a day (morning, midday and evening).
Three types of equipment are used for cooking with wood energy: the improved charcoal grill (stove) (saving on charcoal and cooking time), the non-improved charcoal grill (stove) and the traditional three-stone fire place.
In the sample as a whole; 30% of households use the improved charcoal grill; 65% use the non-improved charcoal grill and 5% use the traditional three-stone fireplace.
It is noted that the penetration rate of households using improved charcoal grills is low in the city of Bujumbura.
4.4. Expenditure on charcoal
Daily expenditure on charcoal varies from 500 FIB to 2500 FIB depending on the household. 5 % of households spend 500 FIB, 5.4 % spend 1000 FIB and 6.4% spend 1500 FIB. The largest group are those who spend 2000 FIB and make up 50.8%, followed by those
who spend 2500 FIB who represent 12% of the sample. For the total sample, the average daily expenditure per household totalled 1798 FIB, while the average daily expenditure per person totalled 299 FIB. On a monthly basis (30 days), it is estimated, therefore, that the average expenditure per household totalled 53,937 FIB while one person spends an average of 8,979 Burundian Francs. The portion of average household income expenditure on charcoal is 11%.
4.5. Estimates of quantities consumed.
Given that we have both daily and monthly household expenditure on charcoal used for cooking, we will use the method of "expenditure conversion" to determine the daily quantities of charcoal consumed per household and per person.
Table 5: Average amount per household and per person
Category Per household Per person
Average daily expenditure per
person (FIB) 1798 299
Average Price (FIB) 385 385
Average daily quantity per person
( kg) 4.67 0.78
It is clear from table 5 that the average amount consumed by household per day is 4.67 Kilograms while that consumed by a person is 0.78 Kilograms. For a period of one month (30 days), the average consumption per household is 140 kg and it rises to 23.4 Kgs for one person during the same period.
4.6. Factors influencing spending
The factors that influence consumption can be classified into three categories: economic factors (income, prices, credit, and advertising), social factors (composition and size of family, age and sex, etc.) and sociological factors (social group, lifestyle, etc.). Regarding charcoal consumption, the main factors which influence expenditure are: household income, the price per kilogram of charcoal, the size of household, number of cooking sessions per day in the household, the weekly frequency of food preparation that require lengthy cooking times.
4.6.1. The estimation model of charcoal expenditure 4.6.1.1 Results of analysis
The parameters given in table 6 used to write the estimated model of expenditure on charcoal are as follows: Log expenditure = 0,631+0.13 log Income + 0.60 Log Price + 0.83 log size + 0.37 Log no. of cooking sessions + 0.33 Log leaves + Error
Table 6: Definition of model variables
Variables
Types of
variables Signification of variables
Dependent
Log expenditure Quantitative
measure of monthly expenditure (BF) on charcoal by household
Independent variables
Log Revenue Quantitative Approximate income of head of household Log Price Quantitative Price per kilogram of charcoal
Log size Quantitative Number of people in household Log cooking sessions Quantitative Number of cooking sessions per day
Log leaves Quantitative Number of cooking sessions using cassava leaves per week
10 Suitability of Model
The results show that the adjusted R2 is high (0.99), indicating that the parameters of the model represent charcoal expenditure by household. The error is distributed according to the laws of normal distribution.
The VIF (Variance Inflation Factor) for all parameters are between 1 and 5. There is a colinearity, but the model remains satisfactory with the estimate by Ordinary Least Squares (OLS) as the VIF is less than 10. A maximum FIV value of more than 10 is considered an indication that the colinearity may influence estimators.
20 Individual meaning of the model coefficients
The household income: the parameter associated with the income variable is significant at
the 5% threshold. The income coefficient is positive. If income increases (or decreases) by 1%, expenditure increases (or decreases) by 0.13%.
The price of charcoal: the price coefficient is positive. If the price increases (or decreases)
by 1%, spending on charcoal increases (or decreases) by 0.60%.
The size of household: the size of household coefficient is positive and significant at the 5%
threshold. If the number of people in the household increases (or decreases) by 1%, spending on charcoal increases (or decreases) by 0.83%.
The number of cooking sessions per day: the number of cooking sessions per day
coefficient is positive and significant at the 5% threshold. If the number of cooking sessions per day increases (or decreases) by 1%, so does expenditure by 0.37%.
The frequency of cooking cassava leaves per week: the coefficient for the weekly cooking
of cassava leaves is positive and significant at the 5% threshold. If the weekly frequency of cooking cassava leaves increases (or decreases) by 1%, then spending on charcoal increases (or decreases) by 0.33%.
5. Conclusion and Recommendations
The main objective of this study was to show the different aspects of consumption of charcoal by households in the city of Bujumbura. Specific requirements to identify were: charcoal consumption patterns, the amount of daily cooking, an analysis of charcoal expenditures, the coefficient of charcoal consumption (kg per person per day), and the relationship between charcoal consumption and socio- economic and demographic. The study was conducted from a survey of 240 households in three districts of the city.
Descriptive analyzes of this study show that charcoal consumers fall into three categories: those that combine charcoal and electricity (12%), those that combine charcoal and firewood (5%) and those that only use charcoal (83%). Charcoal is the main cooking fuel used by households in Bujumbura. These cook either once daily (5.4%) or twice daily (85.4 %), three times daily (9.2%). To cook with firewood, traditional fireplaces are used. To cook with charcoal is made either with improved braziers with either unimproved braziers. The daily per person expenditure for the purchase of charcoal totalled 299 Fbu. The consumption coefficient is 0.78 kg per person per day, which means that the total amount consumed by the population of Bujumbura is huge. Expenditure on charcoal is influenced by economic, social and sociological factors. The main ones being: household size, household income, the price per kilogram of charcoal, the number of cooking sessions per day and the frequency of cooking cassava leaves. The results of the econometric model of expenditures show that adjusted R2 is high (0.99), which means that the parameters in this model explain households' expenditure on charcoal. The error is distributed according to a normal distribution. All the coefficient associated with these variables are positive and significant at the 5% threshold. These variables thus contribute positively towards explaining the evolution of charcoal expenditure for households in the city of Bujumbura.
The use of improved cooking stoves is of great importance in order to economise on charcoal for cooking. Economies in coal in turn enable economies in wood used for charcoal production. Therefore, in terms of coal consumption by household, given that the penetration rate of improved cooking stoves is low (30%), we must encourage the usage of more efficient stoves in the households of Bujumbura, thus reducing the pressure on the plantations supplying the city of Bujumbura.
Future studies should focus on analyzing the determinants of charcoal consumption by artisans in the Bujumbura and other major cities and evaluating the impact of this demand on resources forest in the country.
References
Bationo, B.C. (1993), Consommation et production de combustibles ligneux au Burkina
Faso : analyse prospective et situation actuelle, Mémoire de DEA, Université de
Ouagadougou, Burkina Faso, http://developpementdurable.revues.org/4151, (consulté le 10 décembre 2014).
Besse, F. & Guizol, P. (1991), Etude de la filière bois pour la ville de Bujumbura, Département des forêts, 101 p + annexes, Burundi.
Couture, S. et al (2008), Choix énergétique et consommation des ménages en bois-énergie : Une approche économétrique sur données françaises, 2èmes journées de recherche en Sciences Sociales, INRA SFER CIRAD, 11 et 12 décembre 2008, Lille, France.
Djezou,W.B. (2009), Energy and poverty: An analysis of urban household’s access to clean
cooking fuels in Côte d’Ivoire, Globlics Dakar 2009, Sénégal.
ESMAP (1991), Burkina Faso: stratégie pour l’énergie ménagère, Rapport N° 134/91, Ouagadougou, Burkina Faso.
Ferari, V., (1990), Du bois de chauffe au gaz butane: Ouagadougou et Bobo, Rjiksuniversiteit Groningen, Pays Bas.
Gazull, L. (2009), Bassin d’approvisionnement en bois-énergie de Bamako : Une approche
par un modèle d’interaction spatiale, Thèse de doctorat en géographie à l’Université de Paris
Diderot Paris 7 France.
International Fertilizer Development Center-SEW/IED, (2011), Enquête sur le flux
d’approvisionnement en bois énergie de Bujumbura, Burundi.
Institut de Statistiques et d’études économiques du Burundi (2013), Bulletins mensuels des
prix au Burundi, Bujumbura, Burundi.
Kauffmann, C.(2005); Energie et pauvreté en Afrique, la Banque mondiale et le Centre de développement de l’OCDE, Repères n° 8.
Meyer, D. et al; (2009), Etude sur la consommation et la production en produits forestiers
ligneux à Madagascar, Madagascar.
Ouédraogo, B. (2006) Éléments Économiques pour la Gestion de l’Offre et de la Demande du
Bois-énergie dans la Région d’Ouagadougou. 380 pages, Thèse de doctorat Unique en
Sciences Économiques, Université de Ouagadougou & Université Montesquieu Bordeaux IV, Burkina Faso, France.
Programme pour la promotion des énergies renouvelables, de l’électrification rurale et de l’approvisionnement durable en combustibles domestiques (2010), Les consommations en
République du Burundi, Ministère de l’Intérieur, (2008), Recensement général de l’habitat et
de la population au Burundi, Bujumbura
République du Burundi, Ministère de l’énergie et des mines, (décembre 2011), Lettre de
Politique énergétique du Burundi, Bujumbura, Burundi.
République du Burundi, Mairie de Bujumbura (2012), Rapport annuel des impôts locatifs et
fonciers, Bujumbura, Burundi.
Trefon,T. et al., (2010), Economie politique de la filière du charbon de bois à Kinshasa et à