Publisher’s version / Version de l'éditeur:
Ice Research for a Sustainable Environment, the 21st IAHR International Symposium on Ice, pp. 1094-1106, 2013-06-15
READ THESE TERMS AND CONDITIONS CAREFULLY BEFORE USING THIS WEBSITE.
https://nrc-publications.canada.ca/eng/copyright
Vous avez des questions? Nous pouvons vous aider. Pour communiquer directement avec un auteur, consultez la
première page de la revue dans laquelle son article a été publié afin de trouver ses coordonnées. Si vous n’arrivez pas à les repérer, communiquez avec nous à PublicationsArchive-ArchivesPublications@nrc-cnrc.gc.ca.
Questions? Contact the NRC Publications Archive team at
PublicationsArchive-ArchivesPublications@nrc-cnrc.gc.ca. If you wish to email the authors directly, please see the first page of the publication for their contact information.
NRC Publications Archive
Archives des publications du CNRC
This publication could be one of several versions: author’s original, accepted manuscript or the publisher’s version. / La version de cette publication peut être l’une des suivantes : la version prépublication de l’auteur, la version acceptée du manuscrit ou la version de l’éditeur.
Access and use of this website and the material on it are subject to the Terms and Conditions set forth at
Comprehensive numerical simulations of a tanker collision with a bergy bit incorporating damage to the vessel
Gagnon, R. E.; Wang, J.
https://publications-cnrc.canada.ca/fra/droits
L’accès à ce site Web et l’utilisation de son contenu sont assujettis aux conditions présentées dans le site LISEZ CES CONDITIONS ATTENTIVEMENT AVANT D’UTILISER CE SITE WEB.
NRC Publications Record / Notice d'Archives des publications de CNRC: https://nrc-publications.canada.ca/eng/view/object/?id=2fd90e88-aebd-405d-8aaf-f528f0c7cf35 https://publications-cnrc.canada.ca/fra/voir/objet/?id=2fd90e88-aebd-405d-8aaf-f528f0c7cf35
21
stIAHR International Symposium on Ice
“Ice Research for a Sustainable Environment”
Dalian, China, June 11 to 15, 2012
Comprehensive Numerical Simulations of a Tanker Collision
with a Bergy Bit Incorporating Damage to the Vessel
R.E. Gagnon*, and J. Wang
Ocean, Coastal and River Engineering, National Research Council of Canada St. John’s, NL, Canada
*
Robert.Gagnon@nrc.ca
Numerical simulations of a collision between a loaded tanker and a bergy bit have been conducted using LS-DynaTM software. The simulation incorporated hydrodynamics, via LS-Dyna’s ALE formulation, and a validated crushable foam ice model. The major portion of the vessel was treated as a rigid body and a section of the hull, located on the starboard side of the forward bow where the ice contact occurred, was modeled as typical ship grillage that could deform and sustain damage as a result of the collision. Strategies for dealing with the highly varying mesh densities needed for the simulation are discussed as well as load and pressure distribution throughout the course of the collision. Realistic movement of the bergy bit due to the vessel’s bow wave prior to contact with the ice was observed and the damage to the grillage in the initial stage of the collision resembled results from actual grillage damage tests in the lab. The collision eventually ruptured the hull in a ripping fashion resembling documented incidents.
1. Introduction
Marine transportation off the East Coast of Canada, is seriously affected by the presence of glacial ice masses. The same can be said for Arctic regions and areas off the west coast of Greenland where there are new hydrocarbon prospects. This is a problem for tanker transport of crude oil from current and future offshore production facilities, and for the transport of supplies to northern communities such as Churchill Manitoba and minerals from Labrador. Of most concern for supply ships and tankers are bergy bits (house-sized glacial ice masses), which are difficult to detect using marine radar in rough sea states and when imbedded in sea ice flows. Should these make contact with a ship's hull, the impact forces will depend on the masses of the vessel and ice, the hydrodynamics of the interaction, the ship structure, the shape of the ice mass and its local crushing properties. NRC has been studying various aspects of the problem for several years, with the overall objective of creating a validated numerical model of ship/bergy bit collisions. Recently simulation results were obtained for a loaded tanker colliding with a substantial bergy bit (Gagnon and Wang, 2012). The model tanker had actual ship grillage on a portion of its bow where the collision occurred that could sustain damage during the collision. This is the first simulation of a vessel colliding with a glacial ice mass that includes the hydrodynamics of the interaction, a validated ice model and damage to the vessel associated with the collision. The purpose of this paper is to show the techniques that were utilized to deal with the various challenging aspects of simulations such as this and to show that reasonable results were obtained for a realistic collision scenario. The same methods can be applied to a wide variety of ship-ice collision cases.
2. Hardware and Software
The simulations were run on a HP Z800 Workstation that has two Intel Xeon Processors X5570 QC, where each has 4 CPU’s running at 2.93GHz. The system has 8 GB of DDR3 RAM. Four CPU’s with SMP (single memory processing) were used for the simulation. The software used was LS-DynaTM version Ls971d Dev, Revision 63221, double precision. It uses LS-Dyna’s ALE formulation to handle fluid hydrodynamics and it has a number of contact algorithms and a large suite of material types that can be chosen for the interacting structures. ANSYS Workbench V12.1 with ANSYS DesignModelerTM was used for the modeling and generation of meshes.
3. Numerical Simulation Model Components and Results
The major challenge in the simulation was dealing with the extreme variation of mesh size that is necessary in order to be able to have a large vessel move through water for some distance in order to produce a reasonable bow wave, on the one hand, and then having a much finer mesh for the region on the vessel and on the ice where the two objects are in contact during the collision. This is challenging from two perspectives. One is that generally in simulations the objects that are interacting must have compatible mesh sizes. Secondly, there are practical limitations to the smallness of the size of the elements that are used in a simulation since the time step is determined by the size of the smallest element in the mesh. Furthermore, if all the elements are small then there is a huge number of them involved in the computations. Either or both of these factors can lead to extremely long run times. So, one has to limit the number of elements that must be of small size and find ways of enabling the fine-mesh components of the ice mass and ship to properly interact while also enabling the much larger components of the ship and ice, that
have coarse mesh, to interact with the surrounding water which has roughly the same large element size. This was accomplished using the following methods.
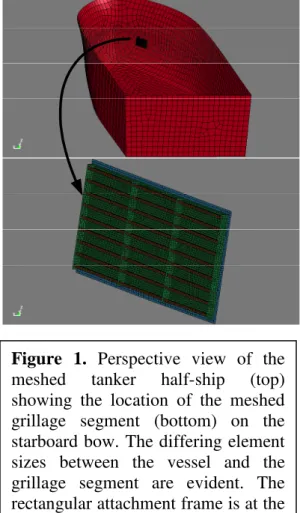
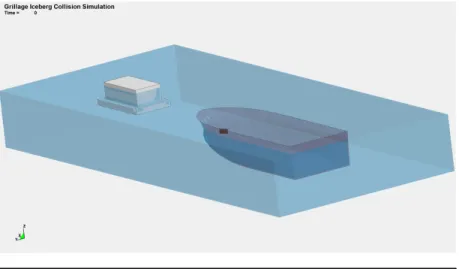
First the vessel (Figure 1) was meshed with rigid shell elements of large size (Table 1) that matched the element size of the water. The tanker model was a typical loaded oil tanker with dimensions given in Table 1, where only the front half of the ship was needed for the simulation. Similarly the bulk ice mass (Figure 2) was meshed with rigid brick elements of similar size (Table 2). Figure 3 shows the ice mass and vessel in the water volume. There is a layer of air (not visible) above the water that is a required component of the simulation to give the water a free surface. Note that we gave the ice mass a brick shape that had a submerged shelf around the bottom periphery. Underwater protrusions are common with floating glacial ice masses.
A segment of ship grillage (Figure 1), meshed with small shell elements, was attached to the vessel at the location where the contact was determined to occur (using the trial and error method described below). To do this, first a rectangular rigid-body attachment frame was meshed with fine mesh elements and connected to the rigid-body ship using the command ‘*CONSTRAINED_RIGID_BODIES’. Then the deformable grillage segment was secured to the attachment frame by merging the nodes around its periphery that overlapped the inner nodes of the attachment frame. Hence, the grillage segment and the ship bow shell elements partially overlapped one another in space but there was no contact definition between them so they did not interact with each other except where the nodes merged around the periphery. The grillage segment elements also had no contact definition with the water. Hence, the ship was enabled to interact with the water in the area where the grillage was
Table 1. Ship details.
Dimensions 145 m half length; 48 m beam; 23.9 m depth; 18.9 m draft Vessel type Tanker with bulbous bow
Displacement ~ 170,000 ton (full length ship, fully loaded) Velocity 5.14 m/s (10 knots) after 10 s start-up Initial ship-ice separation 96 m (from bulbous bow to ice knob) Element type *SECTION_SHELL
Typical element dimension 2 m
Material properties *MAT_RIGID Number of elements 3432
Figure 1. Perspective view of the
meshed tanker half-ship (top) showing the location of the meshed grillage segment (bottom) on the starboard bow. The differing element sizes between the vessel and the grillage segment are evident. The rectangular attachment frame is at the periphery of the grillage segment. From Gagnon and Wang (2012).
attached so that normal hydrodynamics took place during the ship transit to the impact location and during the collision. The grillage segment was 6 m x 3 m in size. Its plate thickness was 10 mm. The frame thickness, height and spacing were 8 mm, 200 mm and 350 mm. The frame T-top thickness and width were 10 mm and 75 mm. The stringer thickness, height and spacing were 8 mm, 250 mm and 2m. The density, Young’s modulus, plastic tangent modulus, Poisson’s ratio, yield strength and rupture strength were 7850 kg/m3, 200 GPa, 1.0 GPa, 0.30, 350 MPa and 600 MPa respectively. The type, material type, number and typical dimension of the elements were *SECTION_SHELL (Hughes-Liu), *MAT_PIECEWISE_LINEAR_PLASTICITY, 12592 (grillage) + 661 (rigid attachment frame) and 0.06 m respectively.
In a similar fashion a relatively small portion of the ice mass in the region where the contact will occur during the collision is shaped as a hemisphere (Figure 2) and has small mesh elements (Table 2) that suit the mesh element size of the ship grillage on the vessel. That particular shape was chosen because submerged protrusions on glacial ice masses are in general locally rounded and smooth due to melting in the seawater. This hemispherical feature partially consists of a circular base of rigid brick elements that attaches to the main bulk of the large ice mass via the rigid body connection command ‘*CONSTRAINED_RIGID_BODIES’. The remaining
portion of the hemisphere is attached to the base by merging all the nodes at the interface between the two components. The ice Young’s modulus and Poisson’s ratio were 9.0 GPa and 0.003 respectively. The small hemispherical ice feature, called the ice knob, has crushable foam properties that have been validated with lab data (Gagnon, 2007) and field data (Gagnon and
Table 2. Ice details.
Ice mass Ice knob
Dimensions: Lower portion Upper portion
48 m x 28 m x 4 m 40 m x 20 m x 12 m
1.4 m radius hemisphere
Density and mass 870 kg/m3; 13000 ton 870 kg/m3
Element type *SECTION_SOLID (brick) *SECTION_SOLID (brick) Typical element dimension 2 m 0.04 m -0.14 m (mean: 0.09 m) Material properties *MAT_RIGID *MAT_CRUSHABLE_FOAM
Number of elements 1872 28000 (ice knob + rigid base)
Figure 2. View of the ice knob
(bottom) and its location on the bergy bit ice mass (top). The differing element sizes between the ice knob and ice mass are evident. The bottom layer of elements at the base of the ice knob is treated as a rigid body that is connected to its companion rigid body, i.e. the ice mass. The rest of the elements of the ice knob are deformable with crushable foam properties during the collision. From Gagnon and Wang (2012).
Figure 3. Full view of simulation components. The bergy bit and tanker half-ship are partially submerged in the water volume. The deformable ship grillage is the small dark rectangle on the starboard bow of the vessel. Not showing is a layer of air above the water that is a required component of the simulation to give the water a free surface. The ice knob, barely visible at this scale, is at the corner of the ice mass nearest to the viewer. From Gagnon and Wang (2012). Derradji-Aouat, 2006).
Note that the specifics of the grillage indicate that it is not an ice-strengthened grillage such as would be found on an ice-strengthened ship or FPSO, and is considerably weaker. It is more typical of grillage used on small dry bulk carrier vessels. We chose to use this grillage because damage tests have been performed in the lab on grillage with similar specifications so we can make some comparisons with our results. The methods we employ here, of course, can be used to incorporate any type of grillage onto a vessel in a simulation.
The hydrodynamics of the water during the ship transit and eventual collision with the ice mass was handled by LS-Dyna’s ALE method. Following a similar strategy that was used by Gagnon and Derradji-Aouat (2006) to find a suitable element size in preparation for numerical simulations of bergy bit collisions with the CCGS Terry Fox icebreaker, a 2 m element size was deemed adequate for the vessel, ice mass, water and air elements.
To continue, then a series of simulations were run where the vessel was given a certain speed (5.14 m/s) to determine a suitable initial placement and orientation for the ice mass in the water in order to get a ‘hit’ at a suitable location on the bow of the vessel below the waterline. For these simulations all solid components, that is the vessel, the grillage and attachment frame, the ice mass and the ice knob and attachment disk, had rigid body designations so the simulations could run quickly. That is, during the relatively long real time portion of the simulation where the ship is transiting over a distance of ~ 96 m, in order to generate a realistic bow wave, the simulation runs with a reasonably long time step. That time step is determined by the ship and water mesh element size and not the small elements of the grillage and the ice knob because the latter were given rigid body properties for this stage of the simulation and they have no contact definition with the water. This procedure took about 5 simulations to perform, where each took 12 hours to run, corresponding to 26.3 s of simulation time, and where the time step was 4.7 x 10⁻⁴ s. Once the initial placement and orientation for the ice mass in the water was determined then the ice knob was oriented appropriately on the corner of the ice mass so that the base of the knob was parallel with the surface of the grillage segment at the time when contact would occur.
So far what we have described will get the simulation to the point where the vessel is at a close approach to the ice mass and the mass has begun to respond significantly to the hydrodynamics associated with the ship’s bow wave. This takes 12 hours of run time. Essentially the grillage segment and the ice knob have not been participating in the simulation to this point because they have been treated as rigid bodies that have no interaction with the water or the vessel, so their small element size has not caused excessively long run times for the simulation. But just before the actual collision occurs it is necessary for these components to be activated, that is, their properties need to be changed to realistic ones rather than simple rigid body ones. In LS-Dyna this cannot be done ‘on the fly’ during a simulation. A restart is required using the command ‘small restart input deck’. That means stopping the simulation just before contact occurs (at time = 26.3 s) and saving all the simulation data up to that point. Then, when the simulation is restarted at the same point in time where it left off the LS-Dyna command ‘*RIGID_DEFORMABLE_R2D’ is used to activate the ice knob and grillage components as deformable parts. Now, however, the time step is much smaller (2.4 x 10⁻⁶ s) due to the smaller elements of the ice knob and grillage so the simulation runs much more slowly, i.e. it takes ~ 73 hr for the remaining simulation time segment from 26.3 s to 27.15 s. Hence the total run time for a simulation is ~ 85 hr. Note that the simulation ran on only 4 CPU’s.
The ‘switched on’ incarnation of the ice knob has realistic ice properties (i.e. crushable foam). The ice knob has no contact definition with the water or the large size shell elements of the vessel. It does, however, have a contact definition with the small mesh elements of the grillage segment, as required. The fact that the ice knob has no interaction with the water is not of any significance because it is a relatively tiny part of the whole ice mass.
Following the small deck restart the ice knob and grillage can interact and the simulation runs to the point where contact occurs and the two objects behave as their properties dictate. Figure 4 shows simulation image pairs of grillage damage (left) and interface pressure distribution (right) during the bergy bit impact. The respective image pair times from top to bottom are 26.675 s, 26.825 s, 26.975 s, 27.125 s and 27.275 s. The load record for the event is shown in Figure 5. The right hand images in Figure 4 have had the frame and stringer components partially removed to make the pressure patterns more visible. The fourth image pair occurred just after rupture started. The ice knob, located on the outside face of the grillage, is white in the left hand images and blue in the right hand images. Slight indenting of the grillage plating and bending of frames and stringers is evident in the first image pair. More bending, accompanied by progressively more pronounced buckling of the frames, is evident in subsequent image pairs (left). Eventually rupture starts by the fourth image pair and is quite evident in the final image pair where a linear rupture can be seen in the direction of sliding along with another rupture near its trailing end that is perpendicular to it. Some stringer and frame elements also fail in the latter stages of the event, such as at the frame at the bottom of the vertically oriented rupture in the last left hand image. In that area the frame could not buckle easily to relieve stress, as in other areas, since it was kept upright by the adjacent stringer. This led to stress concentration and tearing of the frame itself. A related noteworthy feature in the right hand images is that higher interfacial pressures are evident at the plating areas that are backed by the frames and stringers, particularly where they intersect. To illustrate this more clearly Figure 6 shows the time series for interface pressure on four plating elements at various locations with respect to two frames and a stringer (Figure 7). As expected element A shows the least pressure and elements B and C show higher and roughly
Figure 4. Simulation image pairs showing grillage damage (left) and interface pressure distribution (right) during the bergy bit impact. From Gagnon and Wang (2012).
equal values. The highest pressure of the four elements is for element D that is situated near the intersection of a frame and a stringer. The highest pressure registering anywhere on the grillage plating during the collision simulation was 27.5 MPa that occurred at another stringer/frame intersection. Roughly speaking, the range of interface pressure seen in the simulation is not uncommon in crushing
and impact experiments on polycrystalline ice (e.g. Gagnon and Gammon, 1997). The rupture of grillage plating and tearing failure of support structure behind the plating is facilitated by the LS-Dyna command ‘*MAT_ADD_EROSION’. Any element of the steel grillage that experiences an equivalent stress of a certain value specified by the user (600 MPa in our case) will erode, i.e. it disappears and no longer participates in the simulation.
The general features of damage described above up to the point where rupture begins are similar to results from actual grillage damage tests performed in the lab (Daley et al., 2007) and from reasonably accurate simulations of similar experiments using LS-Dyna (Quinton et al., 2010). In those experiments and simulations bending and buckling of the frames was evident in response to damaging loads. In the lab experiments pressure was not directly measured so we cannot compare with interface
pressures generated in our simulation, however, load measurements were made for a case where load was applied near a constrained end of a single frame that was substantially deflected. This is a similar situation to the deflection of the frames in the last image pair of Figure 4 where the ends of the frames are
Figure 5. Load versus time for the collision interaction between the
grillage segment of the tanker and the ice knob of the ice mass. Note that since the grillage is deforming during the interaction the force is the resultant force of all the single element forces where contact occurs. From Gagnon and Wang (2012).
Figure 6. Interface pressure versus time for four grillage plating
elements A, B, C and D. Figure 7 shows the locations of the elements relative to two frames and a stringer. From Gagnon and Wang (2012).
constrained because the edge of the grillage is attached to the rigid attachment frame. In our simulation the pressure map in the right image shows where the load was being applied to the fames that were undergoing substantial bending/buckling deformation (left image) and still supporting load. The images basically indicate that the second to the fifth frames from the top of the grillage and the seventh frame were deforming and supporting load. The sixth frame, located in the vicinity of the horizontal rupture had failed and did not support much load, as seen in the right image. Hence, we may calculate that the load required to highly deform a single frame in
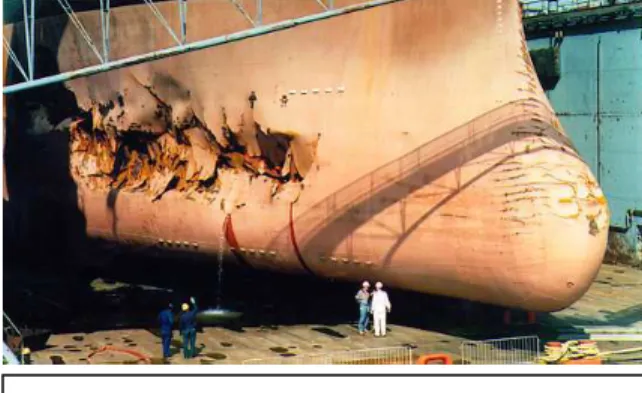
the lab test program (1.47 MN) multiplied by the number of frames that were highly deformed and supporting load in our simulation (5 frames) gives a total load of roughly 7 MN. This compares reasonably well with the load that occurred at the time of the last pair of images in Figure 4, i.e. ~ 6 MN. Our simulation shows that eventually the plating begins to rupture and rip along the grillage segment since the steel had been given a certain rupture strength (600 MPa). This kind of damage is reminiscent of documented ship-ice collision accidents such as the bulk carrier Reduta Ordona incident at the mouth of Hudson’s Bay in 1996 (Figure 8).
4. Other Observations and Further Discussion
The motion of the ice mass in response to the bow wave of the ship appears to be realistic since there is a certain degree of surge and sway of the mass before contact occurs (Figure 9). During the 9 – 20 s time segment it is interesting that there is a small amount of negative sway (Figure 9), that is, sway towards the vessel track before the vessel gets close to the ice mass. This occurred because the long axis of the ice mass was initially at an angle to the ship track. When the ice mass surged in response to the ship’s bow wave pushing the mass’s leading face its angular orientation in the water caused the mass
to tack sideways in the negative sway direction by a small amount before the ship was close enough to cause positive sway. In this particular simulation we have constrained the ship to prevent lateral movement because we are assuming it is a massive loaded tanker, and it is much more massive than the ice. Additionally, it would also have a huge added mass associated with any lateral movement in the water. Of course it is a simple matter of altering the restraints in the LS-Dyna k-file so that movement of smaller and/or lighter vessels, in response to the collision forces, could be enabled.
Figure 7. Locations of the four grillage
plating elements A, B, C and D, referred to in Figure 6, with respect to two frames and a stringer. From Gagnon and Wang (2012).
Figure 8. Image showing damage to the
bulk carrier Reduta Ordona. (Photo credit: Andrew Kendrick)
Some of the analysis involved determining the relationship between average pressure over the ice contact area as the contact area varied. Figs. 5 and 10 show the load time series and average pressure versus contact area for the simulation. The average pressure over the ice contact region was obtained by first determining what the contact area was. This was accomplished by viewing the grillage at specific instants in time where at each instant the interface pressure was shown for the grillage elements (e.g. Figure 4). By choosing an appropriate scale for the colored pressure display, in our case using the range 0.001 – 2 MPa, the contact area could be obtained by summing the individual areas of all elements showing any indication of interface pressure. The average pressure was determined for the set of elements that were in contact with ice at that particular instant in time by dividing the total force on the grillage by the contact area. Figure 10 shows pressure versus area at six consecutive instants in time (left to right) from early contact to just before rupture occurred. Roughly speaking, the pressure increases as the contact area increases. This is at odds with the well-known and frequently debated decreasing trend of nominal pressure with increasing nominal contact area reported by Sanderson (1988). However, an increasing trend of pressure with area was also observed on hard zones during the bergy bit collisions with the CCGS Terry Fox icebreaker (Gagnon, 2008). Looking at the pressure-area data in Figure 10 in more detail we note that initially (between the first two data points at the left) there was a marked increase in pressure with area. Yield had started at around time 26.62 s, i.e. between the first two points. Then pressure appeared to reach a gently increasing plateau, as yield continued in the grillage, until the ice contact was passing under the second stringer (third image pair in Figure 4) causing an abrupt rise again in average pressure.
A similar study to the present one, involving simulations of a ship collision with a bergy bit, has been conducted by Liu et al., 2011. It is difficult to compare our results with those results because the scenarios in both studies are very different and a different ice model was used. However, the damage to the grillage had some similarities with the present results such as the
Figure 9. Ice mass surge and sway time series. Surge and sway were
determined from the motion of the center of mass of the bergy bit in response to the ship’s bow wave. From Gagnon and Wang (2012).
apparent bending and buckling of structural members behind the plating.
Finally we note that the ice model we used for the ice knob yielded reasonable results. Of course no in situ actual load or pressure distribution measurements have ever been made in the case of a structure undergoing damage due to ice crushing. However, we can get a rough idea of the ice model’s capability by comparing the load that it generated at a time before rupture occurred with results from a test from the Hobson’s Choice Ice Island experiments where a pyramid-shaped ice feature (test TFR#3) had generated a load of roughly 8 MN at the point in the test where it had been crushed to a depth of 78 mm. In the present simulation the load just before rupture initiated (~ 7 MN), where the ice knob has been compressed (i.e. ‘crushed’) by 78 mm, was reasonably close to the field result. The square top of the truncated pyramid was 500 m x 500 m in size and the slope of the pyramid’s sides was 18o from horizontal. From a geometrical perspective the shape and dimensions of the ice knob and the truncated pyramid would generate similar degrees of confinement for crushing penetrations in the range of 78 mm. Hence, the comparison of loads is a valid exercise.
5. Conclusions
The first simulations of a collision between a bergy bit and a loaded tanker that includes hydrodynamics, a validated ice model and damage to the vessel have been performed. The results show realistic grillage damage characteristics similar to actual grillage damage tests performed in the lab. The eventual rupture of the grillage was reminiscent of gouging-type ruptures that have been observed in documented accidents. The ice model appeared to perform well, producing pressure
distributions of rich texture that reflected the actual structural members (frames and stringers) of the grillage. An analysis of contact area and average pressure over the area showed that pressure increased with area. Movements of the ice mass associated with the bow wave of the vessel appeared to be reasonable. The numerical techniques employed for this simulation should make simulations of a wide variety of ice interaction scenarios with vessels and structures feasible.
Acknowledgements
The authors would like to thank the Program of Energy Research and Development (PERD), Transport Canada and NRC for their support of this research.
0 1 2 3 4 5 6 0 0.5 1 1.5 Contact Area (sq. m ) A v e ra g e P re s s u re ( M P a )
Figure 10. Average pressure versus ice contact area for the
bergy bit – ship collision up to the point just before rupture occurred. From Gagnon and Wang (2012).
References
Daley, C., Hermanski, G., Pavic, M., and Hussein, A., 2007. Ultimate strength of frames and grillages subject to lateral loads – an experimental study. Proceedings of the 10th International Symposium on Practical Design of Ships and Other Floating Structures, Houston, Texas.
Gagnon, R., 2007. Results of Numerical Simulations of Growler Impact Tests. Cold Regions Science and Technology, 49, 206–214.
Gagnon, R. E., 2008. Analysis of data from bergy bit impacts using a novel hull-mounted impact panel. Cold Regions Science and Technology, 52, 50-66.
Gagnon, R. E., and Gammon, P. H., 1997. In-situ thermal profiles and laboratory impact experiments on iceberg ice. Journal of Glaciology, 43(145), 569-582.
Gagnon, R. E., and Derradji-Aouat, A., 2006. First results of numerical simulations of bergy bit collisions with the CCGS Terry Fox Icebreaker. Proceedings of IAHR 2006, Sapporo, Japan, 2, 9-16.
Gagnon, R. E., and Wang, J., 2012. Numerical simulations of a tanker collision with a bergy bit incorporating hydrodynamics, a validated ice model and damage to the vessel. Cold Regions Science and Technology, in press.
Liu, Z., Amdahl, J., and Løset, S., 2011. Integrated numerical analysis of an iceberg collision with a foreship structure. Marine Structures, 24(4), 377-395.
Quinton, B., Daley, C. G., and Gagnon, R. E., 2010. Effect of moving ice loads on the plastic capacity of a ship's structure. Icetech 2010, Anchorage, Alaska, paper #110.
Sanderson, T. J. O., 1988. Ice mechanics: risks to offshore structures. Graham and Trotman, London, 253 pages.