Analyzing Passenger Incidence Behavior
in Heterogeneous Transit Services Using
Smartcard Data and Schedule-Based Assignment
The MIT Faculty has made this article openly available. Please share how this access benefits you. Your story matters.
Citation Frumin, Michael, and Jinhua Zhao. “Analyzing Passenger Incidence Behavior in Heterogeneous Transit Services Using Smartcard Data and Schedule-Based Assignment.” Transportation Research Record: Journal of the Transportation Research Board 2274, no. 1 (January 2012): 52–60.
As Published http://dx.doi.org/10.3141/2274-05
Publisher SAGE Publications
Version Original manuscript
Citable link http://hdl.handle.net/1721.1/120845
Terms of Use Creative Commons Attribution-Noncommercial-Share Alike Detailed Terms http://creativecommons.org/licenses/by-nc-sa/4.0/
Title: Analyzing Passenger Incidence Behavior in Heterogeneous Transit Services Using Smartcard Data and Schedule-Based Assignment
Number of words: 6050 Number of figures: 4 Number of tables: 2
Authors: Michael Frumin
Systems Engineering Manager
MTA Bus Customer Information Systems
2 Broadway, 27th Floor, New York, NY 10004, USA Tel: 646-252-1117
Email: [email protected]
Jinhua Zhao (Corresponding Author) Assistant Professor
Department of Civil Engineering / School of Community and Regional Planning University of British Columbia
#2007 - 6250 Applied Science Lane Vancouver, B.C. Canada V6T 1Z4 Tel: 604-822-2196
Fax: 604.822.6901
Frumin and Zhao 2
Abstract
Passenger incidence (station arrival) behavior has been studied primarily to understand how changes to a transit service will affect passenger waiting times. The impact of one intervention (i.e. increasing frequency) could be overestimated compared to another (i.e. improving reliability), depending on the assumption of incidence behavior. It is important to understand passenger incidence so that management decisions will be based on realistic behavioral assumptions. Prior studies on passenger incidence chose their data samples from stations with a single service pattern such that the linking of passengers to services was straightforward. This simplifies the analysis but heavily limits the stations that can be studied. In any moderately complex network, many stations may have more than one service patterns. This limitation prevents it from being systematically applied to the whole network and limits its use in practice.
This paper concerns with incidence behavior in stations with heterogeneous services. It proposes a method to estimate incidence headway and waiting time by integrating disaggregate smartcard data with published timetables using schedule-based assignment. We apply this method to stations in the entire London Overground to demonstrate its practicality and observe that incidence behavior varies across the network and across times of day, reflecting the different headways and reliability. Incidence is much less timetable-dependent on the North London Line than on the other lines because of shorter headways and poorer reliability. Where incidence is timetable-dependent, passengers reduce their mean scheduled waiting time by over 3 minutes compared with random incidence.
Frumin and Zhao 3
1. INTRODUCTION
This paper is concerned with passenger incidence behavior, defined as the act or event of being incident to a public transport service with intent to use that service. A lexical convention is established here to avoid ambiguity between passenger incidence to public transport services and arrival at certain destinations after using public transport services.
Passenger incidence behavior has been studied primarily for the sake of understanding how changes to a public transport service will affect passenger waiting times. It is also of interest because it affects the relationship between the departure times of public transport vehicles and the passenger loads on those vehicles. It is important to understand passenger incidence behaviors so that management interventions will be based on realistic behavioral assumptions. As pointed out in one of the seminal investigations on the topic by Bowman and Turnquist (1), the effects on passenger waiting time of one particular intervention (i.e. increasing frequency) could be overestimated compared with a different type of intervention (i.e. improving reliability), depending on what assumptions about incidence behavior are made.
Prior studies on passenger incidence behavior chose their data samples from stations or stops with a single service pattern such that the linking of passengers to scheduled or actual services was straightforward. This simplifies the analysis and may suffice the need for academic study. But it also heavily limits the stations or stops that can be studied in the transit network. In any moderately complex network, many stations may have more than one service patterns. This limitation prevents the method from being systematically applied to the entire network and therefore limits its use in transit management practice. In environments where passengers at a given station have a choice of services, a more sophisticated approach is needed to study passenger incidence behavior.
This paper is concerned with the relationship between the times of passenger incidence and published timetables in a rail network with heterogeneous service patterns. It proposes a method to study this relationship by integrating disaggregate passenger journey data from automatic fare collection (AFC) smartcard systems with published timetables using schedule-based assignment. The purpose of this paper is two-fold: firstly, to develop a method that contributes to the study of passenger incidence behavior across a railway network with heterogeneous service patterns and frequencies using published timetables and AFC data; and secondly, to apply this method to London Overground to demonstrate its practicality and shed light on the incidence behavior of its passengers.
2. LITERATURE
Previous research has identified a rich set of passenger incidence behaviors, and related them to certain aspects of public transport services. Using manually and automatically collected data sources, prior research has investigated the diversity of the behavior cross-sectionally and the consistency of such behaviors longitudinally over time. It has been found that the randomness of
Frumin and Zhao 4 passenger incidence behavior is highly dependent on the service headway and the reliability of the departure time of the service to which passengers are incident.
After briefly introducing the random incidence model, which is often assumed to hold at “short” headways (2), the balance of this section reviews six studies of passenger incidence behavior which are motivated by understanding the relationships between service headway, service reliability, passenger incidence behavior, and passenger waiting time in a more nuanced fashion than is embedded in the random incidence assumption. Three of these studies depend on manually collected data, two use data from AFC systems, and one studies the issue purely theoretically. These studies reveal much about passenger incidence behavior, but all are found to be limited in their general applicability by the methods with which they collect information about passengers and the services those passengers intend to use.
Random Passenger Incidence Behavior
One characterization of passenger incidence behavior is that of random incidence (3). The key assumption underlying the random incidence model is that the process of passenger arrivals to the public transport service is independent from the vehicle departure process of the service. This implies that passengers become incident to the service at a random time, and thus the instantaneous rate of passenger arrivals to the service is uniform over a given period of time. Let
W and H be random variables representing passenger waiting times and service headways,
respectively. Under the random incidence assumption and the assumption that vehicle capacity is not a binding constraint, a classic result of transportation science is that
) ) ( 1 ( 2 ] [ ] [ 2 ] [ ) ( 2 2 H cv H E H E H E W E = = + ………(1)
where E[X ] is the probabilistic expectation of some random variable X ; cv(H ) is the coefficient
of variation of H , a unitless measure of the variability of H defined as
] [ ) ( H E H cv = σH ………(2)
and σH is the standard deviation of H (4). The second expression in Equation 1 is particularly
useful because it expresses the mean passenger waiting time as the sum of two components: the waiting time due to the mean headway (i.e. the reciprocal of service frequency) and the waiting time due to the variability of the headways (which is one measure of service reliability). When the service is perfectly reliable with constant headways, the mean waiting time will be simply half the headway.
More Behaviorally Realistic Incidence Models
Jolliffe and Hutchinson (5) studied bus passenger incidence in South London suburbs. They observed ten bus stops each for one hour per day over eight days, recording the times of passenger incidence and actual and scheduled bus departures. They limited their stop selection to
Frumin and Zhao 5 those served by only a single bus route with a single service pattern so as to avoid ambiguity about which service a passenger was waiting for. The authors found that the actual average passenger waiting time was 30% less than predicted by the random incidence model. They also found that the empirical distributions of passenger incidence times (by time of day) had peaks just before the respective average bus departure times. They hypothesized the existence of three classes of passengers: with proportion q, passengers whose time of incidence is causally coincident with that of a bus’ departure (i.e. because they saw the approaching bus from their home, a shop window, etc.); with proportion p(1 − q), passengers who time their arrivals to minimize expected waiting time; with proportion (1 − p)(1 − q), passengers who are randomly incident. They estimated found that p was positively correlated with the potential reduction in waiting time (compared with arriving randomly) resulting from knowledge of the timetable and of service reliability. They also found p to be higher in the peak commuting periods rather than in the off-peak, indicating more awareness of the timetable and/or historical reliability by commuters.
Bowman and Turnquist (1) build on the concept of “aware” and “unaware” passengers of proportions p and (1−p), respectively and propose a utility-based model to estimate p as well as the distribution of incidence times and thus the mean waiting time of “aware” passengers over a given headway as a function of the headway and reliability of bus departure times. They observed seven different bus stops in Chicago, each served by a single (different) bus route, between 6:00 and 8:00am for 5-10 days each. The bus routes had headways of 5-20 minutes and a range of reliabilities. The authors found that actual average waiting time was substantially less than predicted by the random incidence model. They estimate that p was not statistically significantly different from 1.0, which they explain by the fact that all observations were taken during peak commuting times. Their model predicts that the longer the headway and the more reliable the departures, the more peaked the distribution of incidence times will be and the closer that peak will be to the next scheduled departure time. This demonstrates what they refer to as a “safety margin” that passengers add to reduce the chance of missing their bus when the service is known to be somewhat unreliable. Such a safety margin can also result from unreliability in passengers’ journeys to the public transport stop or station. They conclude from their model that the random incidence model underestimates the waiting time benefits of improving reliability and overestimates the waiting time benefits of increasing service frequency. This is because, as reliability increases passengers can better predict departure times and so can time their incidence to decrease their waiting time.
Furth and Muller (2) study the issue in a theoretical context and generally agree with the above findings. They are primarily concerned with the use of data from automatic vehicle
tracking systems to assess the impacts of reliability on passenger incidence behavior and waiting times. They propose that passengers will react to unreliability by departing earlier than they would with reliable services. Randomly incident “unaware” passengers will experience
unreliability as a more dispersed distribution of headways and simply allocate additional time to their trip plan to improve the chance of arriving at their destination on time. “Aware” passengers,
Frumin and Zhao 6 whose incidence is not entirely random, will react by timing their incidence somewhat earlier than the scheduled departure time to increase their chance of catching the desired service. The authors characterize these reactions as the costs of unreliability.
Luethi et al. (6) continue with the analysis of manually-collected data on actual passenger behavior. They use the language of probability to describe the two classes of passengers. The first is “timetable-dependent” passengers whose incidence behavior is affected by awareness (possibly gained through their own experience with the service) of the timetable and/or service reliability (i.e. the “aware” passengers). The second is “timetable-independent” passengers whose incidence behavior is random and so does not reflect any such awareness (whether or not they have it). The language of timetable-dependency is adopted for the balance of this paper to describe the randomness of passenger incidence behavior regardless of what exactly is driving the behavior on the part of the passengers. It is preferred because it expresses the probabilistic association between two observed variables, incidence times and scheduled departure times, rather than some unobserved passenger state of mind. They observed passenger incidence at 28 bus, tram, and commuter rail stations in and around Zurich, Switzerland, with headways of 2.33-30 minutes, during morning and evening peak hours and midday off-peak hours. To avoid ambiguity, they limited their station selection to non-terminal non-interchange stations served by a single route with constant headways over the period of observation. The authors observed that a substantial share of passengers appear to be timetable-dependent for headways as low as five minutes. They propose distributions of passenger incidence times over a given headway to be the weighted superposition of two distributions: the one for timetable-independent passengers, with weight 1−p, distributed uniformly over the headway, and the other for the timetable-dependent passengers, with weight p, distributed according to a Johnson SB (JSB) distribution. The authors found the fit of their bespoke distribution to the observed data to be statistically significant. This distribution is parameterized in terms of the headway, but not the reliability of the service. Estimations of their model yield values of p for the different time periods of the day, which they find to be highest in the morning peak and lowest in the off-peak, supporting the conclusion that the incidence of commuters is more timetable-dependent.
Csikos and Currie study this phenomenon, first cross-sectionally (7) and then longitudinally (8), using data from the AFC system of the heavy rail network in Melbourne, Australia. In their first study they use four weeks’ worth of data from 07:30 to 15:00, but limit themselves to analyzing seven particular stations out of 209, for a total of 38,000 observations over approximately 1,470 hours. The stations are, as in the other studies, selected to avoid ambiguity regarding which scheduled service each passenger intended to use. They also obtained high level data about the aggregate reliability (6-minute terminal on-time performance) of the train lines serving the selected stations. Their findings generally confirm those of the other studies. In their second study, they use the same four-week data set, but track individual ticket holders over time to study the consistency of behavior. They focus on the 15,000 trips made between 06:00 and 10:00 by 1,043 individual passengers who, as morning commuters, are expected to exhibit the most consistent behavior patterns. They characterize the passengers by
Frumin and Zhao 7 the times of incidence and the “offset” times until the next scheduled departure. They classify passengers into four distinct archetypes exhibiting various levels of consistency in these two variables, finding roughly equal numbers of passengers in each category. On one end of the spectrum are “like clock-work” passengers who exhibit consistent behavior that often minimizes their waiting time with respect to the schedule. On the other end, “largely random” passengers have very little consistency with respect to waiting time, exhibiting largely timetable-independent behavior. The authors’ overall conclusion in this work is one of heterogeneity in passenger behavior, even under homogeneous conditions (i.e. at the same station at the same time of day served by the same line).
As a brief summary of the six studies, passenger incidence behavior has been characterized primarily in terms of how random it appears to be with respect to the timetable and to actual vehicle departure times. The appearance of randomness (or lack thereof) has been used to indicate the degree to which passengers have and use knowledge of the published timetable and of actual departure times. At longer headways, passengers have more to gain by gaining and using knowledge of the timetable; their behavior tends to be less random, peaking somewhat before the scheduled departure time. Passengers also appear to gain and use knowledge of the actual, rather than scheduled, departure times. When departure times are reliable, even if they are reliably late (or early) by a particular amount, incidence behavior tends to be less random with more passengers being incident shortly before the reliable departure time. When departure times are inconsistent (i.e. unreliable), passengers have less to gain from choosing any particular time of incidence, so their behavior tends to be more random.
3. METHODOLOGY
This section proposes a method for studying passenger incidence with respect to scheduled departure times using AFC smart card data and schedule-based assignment. The method depends on the following concepts, for a given passenger journey.
Attractive Departure – a departure scheduled from the passenger’s station of incidence that the
passenger is or would have been willing to board, however “willing” is defined. The use of the word “attractive” is in the tradition of Spiess and Florian (9) and Nguyen and Pallottino (10) in their work on hyperpaths and optimal strategies. They defined the “attractive set” of lines as the set that a passenger is willing to board at a given location. This concept makes explicit the possibility that some scheduled departures may not be viable alternatives for a given passenger as a function of that passenger’s destination and of the subsequent itinerary of those departures. For example, on a line with a trunk and branches, passengers bound for one of the branches may experience longer headways than those traveling only on the trunk.
Scheduled Waiting Time (SWT) – the time the passenger should have to wait according to the
schedule, given his or her time of incidence and attractive departures. This is defined as the length of time between passenger incidence and the next attractive departure.
Frumin and Zhao 8
Incidence Headway – the (scheduled) headway applicable to the passenger given his or her time
of incidence and set of attractive departures. This is defined as the length of time between the last attractive departure prior to the time of incidence and the next such departure after the time of incidence.
The above six studies of passenger incidence all selected places and times of observation so as to avoid ambiguity with respect to each passenger’s attractive departures. They trivialized the measurement of SWT and incidence headways by selecting stations served by only a single service pattern and, in some cases, with a constant headway. While this may be sufficient for modeling the behavior of certain group of passengers, it is clearly inadequate for understanding behavior across an entire network. In many real-world public transport networks, the largest numbers of passengers are incident at large stations or terminals that provide access to heterogeneous services.
In the case of the London Overground, this is most problematic on the North London Line (NLL). Consider, for example, passengers incident to the NLL at Stratford, one of the Overground’s busiest stations. In 2008 peak period timetables, the NLL was running a mostly (but not perfectly) regular 15-minute (i.e. 4 trains per hour) service all day from Stratford to the end of the NLL at Richmond. This was augmented with occasional irregular services – a “shuttle” that ran only as far as Camden Road, and one “special” that ran on the NLL to Willesden Junction but then on the West London Line to Clapham Junction. It is not immediately obvious which of these services would be attractive to a given passenger at Stratford, and thus not clear what incidence headway each passenger experiences. The previous literature avoided this issue by avoiding stations such as Stratford altogether.
The method proposed here is designed as a tool to support the study of passenger incidence behavior in general (i.e., including locations with heterogeneous services) and to facilitate its application in practical transit management. It does so by estimating SWT and incidence headway automatically from the integration of published timetables with disaggregate AFC passenger journey data via schedule-based assignment.
Schedule-based assignment depends on a run-based model of public transport supply, which is very similar to the line-based model of supply, but unfolded in the temporal dimension Nuzzolo and Crisalli (11). In such a model, each individual scheduled or actual run (or trip) of the public transport service is represented individually by its own subgraph. In the subgraph for a given run, the nodes represent the arrival, departure, or transit of that run at a specific location at a specific time. The links represent travel (or dwelling) on that run between specific points in time and space. The combination of the subgraphs of all runs is referred to as the service
subgraph. Demand is also modeled with temporal as well as spatial dimensions in the demand subgraph. Nodes in this subgraph represent centroids of demand in time, according to user
departure and arrival times, and space, according to the physical network. The access/egress
subgraph joins the service and demand subgraphs with boarding and alighting links. The union
Frumin and Zhao 9 such a representation is that shortest travel time paths can be found via standard shortest-path network algorithms such as Bellman-Ford or Dijkstra’s (12).
We assume in this paper that, for a given origin, destination, and time of incidence, all passengers plan to use the single schedule-based path (i.e. set of scheduled services) through the network that minimizes total travel time. Additionally, assume that passengers plan itineraries to minimize the number of total boardings up to the point where total travel time is not increased (e.g. in the trunk-and-branch example, branch-bound passengers won’t board a train bound for the wrong branch just to get to the end of the trunk and transfer to the correct branch). These assumptions are necessarily a simplification of the true behaviors and perceptions of passengers. The degree to which they hold is a function of the attributes of the particular network to which they are applied and of the behavioral preferences of the passengers in question. These assumptions are sufficient to determine, for each passenger journey, the attractive departures prior and subsequent to the time of incidence. SWT and incidence headway can be determined once the times of these two departures are known.
Algorithm and implementation
For a given passenger journey on a given public transport network, let
SWT = the scheduled waiting time for the given journey; HI = the incidence headway for the given journey; I = time of passenger incidence for the given journey;
LO = location of incidence of the journey in question (i.e. the origin); LD = destination of that journey;
Dprior = time of last attractive departure prior to I ; Dnext = time of first attractive departure after I ;
Hmax = the maximum normal headway (i.e. time between any two successive departures in the
same direction from the same location) on the network;
Hmin = the minimum normal headway on the network;
Path(from, to, time) = a function that finds the shortest weighted travel time path from location
from to location to with departure time strictly greater than time, with all travel time weights
equal to 1 except for a transfer or boarding penalty that is positive but less than Hmin; Departure(path) = a function that returns the scheduled departure time of path path.
Table 1 illustrates the algorithm to find HI and SWT for the journey in question under the above assumptions. Lines 1 through 3 accomplish the simple task of finding the next attractive departure and thus determining the scheduled waiting time (SWT). Lines 4 through 9 search
Frumin and Zhao 10 backward in time in increments of Hmin until either a new attractive departure time d is found or the time has been moved by more than Hmax. Hmin is the largest step possible such that the search will never skip over a possible attractive departure. In theory, the algorithm could use the timetable to determine the next departure time in this backward search process rather than blindly stepping in increments of Hmin. However, the algorithm is unaware of particular departure times since the Path() function encapsulates all knowledge of the timetable itself. This particular algorithmic design is motivated primarily by implementation concerns, discussed in the following section.
A 272-line Perl script was written to implement the algorithm for individual Oyster passenger journey records. The Path() function encapsulates the complexity of conducting a schedule-based assignment for a single passenger trip. It will either find the prior attractive departure time Dprior or determine that there is no prior attractive departure in at most Hmax
/Hmin steps. If it does find Dprior , it uses that result to determine HI . Embedded in this
function is the algorithm for finding shortest weighted travel time paths in a schedule-based network. The travel time weighting are such as to enforce the assumption that passengers minimize the number of boardings (without affecting total travel time). A robust implementation of Path() function using a modified Dijkstra's algorithm is available in the free/open source software library Graphserver (13). Graphserver reads timetables in the widely used General Transit Feed Specification (GTFS) (14). This specification was defined by Google to facilitate transfer of public transport schedules from operators to Google to power its own web-based journey planning software. It has become a de-facto standard for public distribution of public transport timetables. Unfortunately, London Overground timetables do not come in GTFS format, so another 302-line bespoke Perl (15) script was written to do the transformation. This algorithm improves on the previous approaches to finding SWT and HI by considering the timetable in the context of each individual journey. The origin, destination, and incidence time of each individual journey determine which departures will be attractive.
4. APPLICATION TO THE LONDON OVERGROUND NETWORK
This section applies the proposed methodology to examine passenger incidence behavior on the London Overground network using a large sample of passenger journey data from the Oyster smartcard ticketing system.
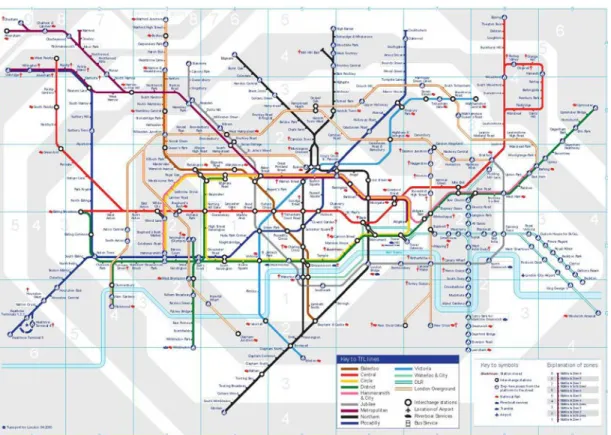
Figure 1 shows a schematic map of Transport for London (TfL)’s rail services as of Spring 2010, including London Underground, Dockland Light Rail and Overground. The Overground network is for the most part circumferential, primarily orbiting London to the North and West, with the majority of stations in zones 2 and 3. The Overground is very much part of the integrated network of TfL services, with 19 of its stations offering interchanges to London Underground or DLR services. In 2010, the Overground is running 407 scheduled weekday train
Frumin and Zhao 11 trips with 27 units of rolling stock (16).
Services on the Overground are divided into four different service patterns, as described in Table 2. The core of this network is the North London Line (NLL) which runs 28 kilometers between Stratford in the northeast of London and Richmond in the southwest, connecting to every other Overground service and numerous other TfL and National Rail services along the way. It is by far the busiest Overground line, with the most frequent service and an estimated 58% of all Overground boardings (17). The NLL runs four (end-to-end) trains per hour (tph) over most of the day, with some segments receiving six tph during the peak periods. The other Overground lines run at lower frequencies of three tph during the peak periods and two to three tph during other periods.
Data
On November 11, 2007, overall management and revenue responsibility for this set of services was transferred to TfL from the Silverlink which held the prior National Rail franchise. At that time, the network was rebranded as the Overground and became fully Oyster-enabled. Oyster is TfL’s automatic fare collection (AFC) smartcard system. London's fare policy and technologies requires most Oyster users to validate their cards upon all entries and exits to the system. The centralized computer system archives these Oyster entry and exit transactions including their location, time stamp and Oyster ID in an easily accessible database. As a result, disaggregate Oyster journey data are cheap to gather in large volumes, and provide a prime source of data on individual passenger journeys.
The data analyzed here is a 100% sample of all Oyster journeys between all pairs of London Overground stations for the 52 business days from 31 March, 2008 through 10 June, 2008, inclusive. Public timetables were obtained for the Overground network. The data set was filtered to include only those journeys for which it can be assumed with relative certainty that the passenger in question used only Overground services, i.e., this data set does not include journeys that interchanged to the Overground but with initial Oyster validations elsewhere in the railway system. Nor does it include journeys initially incident to the Overground but interchanging to other railway services. Journeys with interchanges to and/or from buses will be included here, since the Oyster system effectively separates the recording of bus and rail journeys. Passengers transferring from buses to London Overground may exhibit a different incidence behavior since they do not have control over the time when the bus arrives at the transfer stops. Their incidences at London Overground stations are only a function of the timetable coordination between bus and Overground services, if there is any such coordination. In general these journeys may demonstrate random incidence behavior. The resulting data set contains nearly 1,670,000 journeys from 54 stations on 1,442 origin-destination pairs made by over 290,000 passengers. It constitutes approximately 53,000 station-hours of observation of passenger incidence to Overground services.
Frumin and Zhao 12 The methodology described in the previous section was applied to each Oyster journey in the data set: the transaction time of the Oyster entry was taken as the time of incidence, and the origin and destination of the journey were used along with the timetable to estimate which services the journey was incident to. This processing took some number of hours for the entire data set, but was fully automated. It results in a large set of observations for which the following are measured or estimated:
• the date and time of incidence, • the incidence headway,
• the scheduled waiting time (SWT),
• the location (i.e. station) of incidence (i.e. the journey’s origin), • the journey’s destination,
• the Overground line to which the passenger was incident.
For journeys that require an interchange within the Overground system (of which there are relatively few), the above is measured or estimated for only the first incidence event.
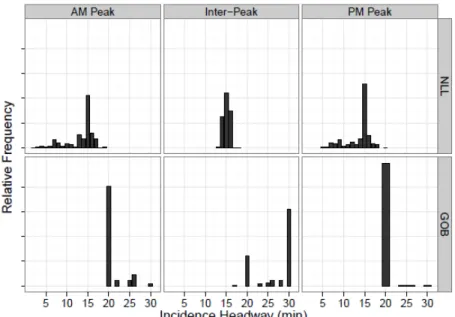
As a point of validation, Figure 2 plots distributions of incidence headway for passengers on the Gospel Oak to Barking (GOB) and North London (NLL) lines. The findings are consistent with expectations. On the NLL, the mode of all the distributions is 15 minutes, reflecting the core service. The distribution is more concentrated during the Inter-Peak period, when there are no scheduled “shuttles” or “specials.” The opposite is true on the GOB which runs a regular 20 minute service in the peak periods but transitions to and from a 30 minute service in the Inter-Peak period. The AM Inter-Peak distribution is somewhat more dispersed than that of the PM Inter-Peak because it includes a transition from 30 minute headways in the early morning.
Results
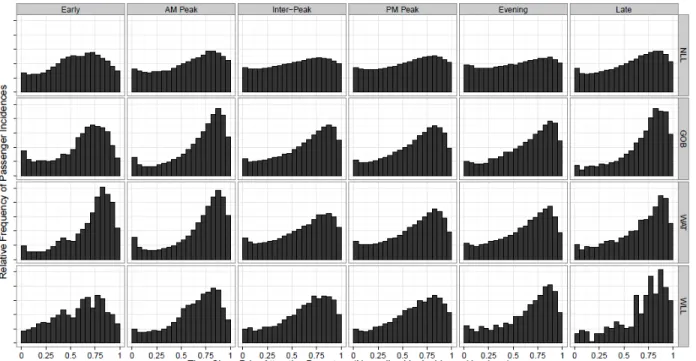
Consistent with the reviewed studies of passenger incidence behavior, the first results of interest are distributions of passenger incidence time over a given headway. Figure 3 plots these distributions for the London Overground network by line and by time period. In this plot, incidence times are normalized by the incidence headway because different passengers experience different incidence headways.
It is clear from Figure 3 that passenger incidence behavior, with respect to published timetables, varies spatially and temporally across the Overground network. Passenger incidence on the GOB and Watford DC (WAT) lines is much more peaked (i.e. timetable- dependent), each with 20 minute headways, than on the NLL, with 7-15 minute headways, during any time period. Also, the NLL is acknowledged by Overground management to have the most serious reliability problems (18). These variations are consistent with the literature that passenger incidence is more timetable-dependent with a more peaked distribution during in longer headways and for more reliable services.
Frumin and Zhao 13 the AM Peak period than in the PM Peak or midday Inter-Peak periods. It appears that Overground commuters in the AM Peak period, more likely with knowledge of the timetable and the service and more sensitive to time saving, exhibit less random incidence behavior than passengers in other time periods despite the shorter headways and less reliable service found in the AM peak. The distribution in late night period is also very peaked because of longer headways and possibly higher sensitivity to time.
The peaks of all of the distributions are somewhat before the very end of the headway, indicating some type of “safety margin” or waiting time-minimization behavior on the part of passengers. Many of the distributions have small spikes at the beginning of the headway, indicating possible “late running awareness” among some passengers. While such awareness may in fact be found on the Overground, it is also possible that it is the passengers themselves who are running late. They may be planning to take a train scheduled to depart at a certain time but, because of uncontrollable circumstances or just their own poor planning, arrive at the station shortly after that departure time.
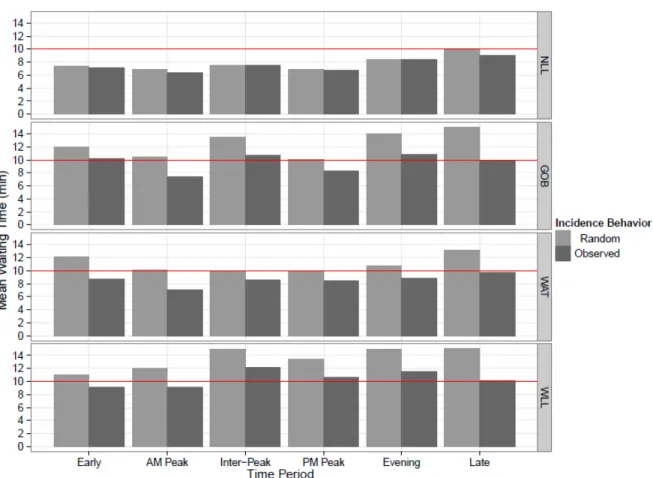
Figure 4 shows the mean waiting time, for each line and time period, under two different models of passenger behavior and train operations: random incidence vs. timetable dependent incidence. In the first case, it is assumed that all passengers are randomly incident to constant headway services, so the mean waiting time is calculated as half the mean incidence headway. In the second, no behavioral assumption is made and all trains are assumed to run as per the timetable, so the “observed” mean waiting time is calculated as the mean scheduled waiting time. Figure 4 thus indicates the effects of the observed incidence behaviors (compared with random incidence) on passenger waiting times.
On the NLL, the relatively slight skew in the incidence distributions translate into relatively small impacts on waiting time. In the AM Peak timetable dependence decreases waiting time by 7.2% from 6.82 minutes to 6.33 minutes (about 30 seconds). In the Inter-Peak and PM Peak periods, the reductions are only 0.2% and 2.2%, respectively. On the GOB, on the other hand, the implications of timetable-dependence are substantial. In the AM Peak, the waiting time decreases by 29% from 10.5 minutes to 7.4 minutes (3.1 minutes). In the Inter-Peak and PM Peak periods, the reductions are still 20.4% and 17.5%, respectively.
Transit assignment models often make an assumption that no service would be assigned a mean passenger waiting time over certain threshold, say, 10 minutes in the London Overground case. The results of this section lend support to this assumption. Regular weekday headways on the Overground network go as high as 30 minutes, but the observed mean scheduled waiting time is above 11 minutes in only two cases (on the WLL during the Inter-Peak and Evening time periods) and is never above 12.1 minutes.
5. DISCUSSION
Frumin and Zhao 14 timetables for the purpose of studying passenger incidence behavior, and applied this methodology to the London Overground.
The following conclusions are drawn about the methodology developed here. Firstly, it can be used to study passenger incidence behavior using large samples of disaggregate journey data from AFC systems such as the Oyster smartcard system. Secondly, it can for each passenger journey estimate scheduled waiting time and incidence headway under heterogeneous conditions. Finally, this methodology is able to efficiently process millions of such data records and can be implemented using open standard timetable formats and free software tools.
As a limitation the proposed method hinges on the schedule-based assignment, for which there are unsolved methodological issues such as station congestion or train crowding. The London Overgroud is a relatively simple network (i.e., as compared to London Underground) so that we wouldn’t be subject to those issues. As the inner workings of schedule-based assignment improve, the method of this paper will continue to become more broadly applicable.
With respect to the London Overground, the following results can be concluded. Generally, passenger incidence behavior varies across the network and across times of day, and the differences reflect the different headways, reliability of service, and time of day (indicating different knowledge of the network and sensitivity to time), in line with the findings in the literature to date. Specifically, incidence appears to be much less timetable-dependent on the North London Line (NLL) than on the other Overground lines because of shorter headways and less reliable service on this line as compared to others. The method and result of the paper also provide one service quality measure, scheduled waiting time, for the entire Overground network. On the GOB, WAT and WLL lines where incidence behavior is more timetable-dependent, passengers reduce their mean scheduled waiting time by over 3 minutes, or up to 30%, during daytime hours compared with random incidence behavior. On the NLL, such reductions are much smaller, in some cases nearly zero, in both relative and absolute terms.
The method developed in this paper can support further study of passenger incidence behavior in a more systematic way, i.e. the researchers no longer need to select a special subset of the stations with only one service pattern. The work of Bowman and Turnquist (1) has been influential in shaping the understanding of the relationships between headway, reliability, passenger behavior, and waiting time. Their work should be updated using the method of this paper to easily analyze large samples of passenger data across heterogeneous networks. The London Overground network represents an ideal opportunity to conduct such a study – its passengers can clearly be studied via Oyster data, and its trains are tracked by a computerized signaling system. After East London Line opened, the network has headways ranging from 5 to 30 minutes during most hours of the day, providing a good range of variation.
Another application is to study the impact of real time information. Many strides have been made towards informing passengers in real time about the status of public transport services. Such information is now often distributed via in-station signs and announcements as well as over the internet to passengers’ computers and, more importantly, mobile devices. It is
Frumin and Zhao 15 crucial to advance the understanding of passenger incidence to include the effects of real-time information. This requires careful thinking and research designs, but should be able to take advantage of the methodology developed here, for example by using actual recorded train arrival and departure times (rather than published timetables) in the schedule-based assignment.
Acknowledgement
The authors thanks Prof. Nigel Wilson for co-supervising the research project and providing critical inputs to the master thesis of the first co-author, based on which this paper is derived (19). The author also thanks Transport for London for providing the financial and institutional support for this research, the opportunity to work in the agency and the access to the data used in this paper, and specifically Oliver Bratton at London Overground Rail Operations LTD for insight into the issues and dynamics of the London Overground network.
References
1. Bowman, L. A. and M. A. Turnquist. Service frequency, schedule reliability, and passenger wait times at transit stops. In Transportation Research A Vol. 15, No. 6, 1981, pp. 465–471. 2. Furth, P. and T. Muller. Service reliability and hidden waiting time. In Transportation
Research Record, No. 1955, 2006, pp. 79–87.
3. Larson, R. C. and A. R. Odoni. Urban Operations Research, 2nd edition, Dynamic Ideas. 2007
4. Osuna, E. E. and G. F. Newell. Control strategies for an idealized public transportation system. In Transportation Science, Volume 6, No. 1, 1972, pp. 52–71.
5. Jolliffe, J. K. and T. P. Hutchinson. A behavioral explanation of the association between bus and passenger arrivals at a bus stop. In Transportation Science, No. 9, 1975, pp. 248–282. 6. Luethi, M., U. A. Weidmann, and A. Nash. Passenger arrival rates at public transport
stations. In 86th Annual Meeting of the Transportation Research Board, 2007.
7. Csikos, D. and G. Currie, Investigating consistency in transit passenger arrivals. In
Transportation Research Record, No. 2042, 2008, pp. 12–19.
8. Csikos, D. R. and G. Currie. The impacts of transit reliability on wait time: Insights from automated fare collection system data. In 86th Annual Meeting of the Transportation Research Board, 2007.
9. Spiess, H. and M. Florian. Optimal strategies: A new assignment model for transit networks. In Transportation Research B, Vol. 23, No. 2, 1989, pp. 83–102.
10. Nguyen, S. and S. Pallottino. Equilibrium traffic assignment for large scale transit networks. In European Journal of Operations Research 37, 1988, pp. 176–186.
11. Nuzzolo, A. and U. Crisalli. The Schedule-Based Approach in Dynamic Transit Modeling: A
General Overview. Operations Research/Computer Science Interface Series, Kluwer
Frumin and Zhao 16 12. Bertsimas, D. and J. N. Tsitsiklis. Introduction to Linear Optimization. Dynamic Ideas, 1997. 13. Graphserver. Graphserver: The Open-Source Multi-Modal Trip Planner. http://bmander.
github.com/graphserver/. Accessed in 2009 14. Google. General Transit Feed Specification.
http://code.google.com/transit/spec/transit_feed_specification.html. Accessed November 13, 2009.
15. Perl.org. The Perl Programming Language. http://www.perl.org/. Accessed in 2010 16. Brimbacombe, A. Unpublished interviews and electronic communications with Adele
Brimbacombe, Performance Contracts Manager, London Overground Rail Operations LTD, 2010.
17. Smales, C. Unpublished interviews and electronic communications with Carol Smales, Chief Transport Economist, TfL London Rail, 2010.
18. Bratton, O. Unpublished interviews and electronic communications with Oliver Bratton, Head of Performance and Planning, London Overground Rail Operations LTD, 2008.
19. Frumin, F. Automatic Data for Applied Railway Management: Passenger Demand, Service Quality Measurement, and Tactical Planning on the London Overground Network, Unpublished Master Thesis, Department of Civil Engineering, Massachusetts Institute of Technology, 2010.
Frumin and Zhao 17
List OF Tables and Figures
TABLE 1 Algorithm to Find Scheduled Waiting Time and Incidence Headway For A Given Passenger Journey
TABLE 2 London Overground Services
FIGURE 1 Transport for London’s rail service map (Spring 2010).
FIGURE 2 Distributions of passenger incidence headways by line and time period. FIGURE 3 Distributions of passenger incidence by line and time period.
Frumin and Zhao 18
TABLE 1 Algorithm to Find Scheduled Waiting Time and Incidence Headway For A Given Passenger Journey
1: p := Path(LO , LD , I ) 2: Dnext := Departure(p) 3: SWT := Dnext − I 4: i := I
5: d := Dnext
6: while d = Dnext or Dnext − i ≤ Hmax do
7: i := i − Hmin 8: d := Departure(Path(LO , LD , i)) 9: end while 10: if d ≠ Dnext then 11: Dprior := d 12: HI = Dnext − Dprior 13: else 14: Dprior := null 15: HI := null 16: end if
Frumin and Zhao 19
TABLE 2 London Overground Services
Service Pattern (Line) Code Primary Terminals Frequency (Peak tph)
North London Line NLL Stratford ⇔ Richmond 4-6
Gospel Oak to Barking Line GOB Gospel Oak ⇔ Barking 3 Watford DC Line WAT Watford Junction ⇔ London Euston 3 West London Line WLL Clapham Junction ⇔ Willesden Junction 2-3
Frumin and Zhao 20
Frumin and Zhao 21
Frumin and Zhao 22
Frumin and Zhao 23
FIGURE 4 Mean scheduled passenger waiting time by line and time period.
View publication stats View publication stats