arXiv:1509.06727v2 [nucl-ex] 23 Feb 2016
A. Adare,13S. Afanasiev,32 C. Aidala,14, 43, 47, 48N.N. Ajitanand,68 Y. Akiba,62, 63 R. Akimoto,12 H. Al-Bataineh,56 J. Alexander,68 M. Alfred,25 A. Al-Jamel,56H. Al-Ta’ani,56 A. Angerami,14K. Aoki,36, 39, 62 N. Apadula,30, 69 L. Aphecetche,70 Y. Aramaki,12, 62 R. Armendariz,56 S.H. Aronson,7J. Asai,63 H. Asano,39, 62 E.C. Aschenauer,7
E.T. Atomssa,40, 69 R. Averbeck,69 T.C. Awes,58 B. Azmoun,7 V. Babintsev,26M. Bai,6X. Bai,11 G. Baksay,20 L. Baksay,20 A. Baldisseri,16 N.S. Bandara,47B. Bannier,69 K.N. Barish,8 P.D. Barnes,43, ∗ B. Bassalleck,55
A.T. Basye,1 S. Bathe,5, 8, 63 S. Batsouli,14, 58 V. Baublis,61 F. Bauer,8 C. Baumann,7, 49 S. Baumgart,62 A. Bazilevsky,7M. Beaumier,8S. Beckman,13S. Belikov,7, 30, ∗ R. Belmont,13, 48, 75 R. Bennett,69 A. Berdnikov,65
Y. Berdnikov,65J.H. Bhom,79 A.A. Bickley,13 M.T. Bjorndal,14 D. Black,8 D.S. Blau,38 J.G. Boissevain,43 J.S. Bok,55, 56, 79 H. Borel,16K. Boyle,63, 69 M.L. Brooks,43 D.S. Brown,56 J. Bryslawskyj,5 D. Bucher,49 H. Buesching,7V. Bumazhnov,26 G. Bunce,7, 63 J.M. Burward-Hoy,43S. Butsyk,43, 55, 69 S. Campbell,14, 30, 69 A. Caringi,50 P. Castera,69 J.-S. Chai,34, 71 B.S. Chang,79 J.-L. Charvet,16 C.-H. Chen,63, 69 S. Chernichenko,26 C.Y. Chi,14 J. Chiba,36 M. Chiu,7, 14, 27 I.J. Choi,27, 79 J.B. Choi,10 S. Choi,67R.K. Choudhury,4 P. Christiansen,45
T. Chujo,74, 75 P. Chung,68 A. Churyn,26 O. Chvala,8 V. Cianciolo,58 Z. Citron,69, 77 C.R. Cleven,22 Y. Cobigo,16 B.A. Cole,14 M.P. Comets,59 Z. Conesa del Valle,40 M. Connors,69P. Constantin,30, 43 N. Cronin,50, 69 N. Crossette,50 M. Csan´ad,18 T. Cs¨org˝o,78 T. Dahms,69 S. Dairaku,39, 62 I. Danchev,75 T.W. Danley,57 K. Das,21 A. Datta,47, 55 M.S. Daugherity,1 G. David,7 M.K. Dayananda,22M.B. Deaton,1 K. DeBlasio,55
K. Dehmelt,20, 69 H. Delagrange,70, ∗ A. Denisov,26 D. d’Enterria,14A. Deshpande,63, 69 E.J. Desmond,7 K.V. Dharmawardane,56O. Dietzsch,66 L. Ding,30 A. Dion,30, 69 P.B. Diss,46 J.H. Do,79 M. Donadelli,66 L. D’Orazio,46 J.L. Drachenberg,1 O. Drapier,40 A. Drees,69 K.A. Drees,6 A.K. Dubey,77 J.M. Durham,43, 69 A. Durum,26 D. Dutta,4 V. Dzhordzhadze,8, 72 S. Edwards,6, 21 Y.V. Efremenko,58J. Egdemir,69F. Ellinghaus,13
W.S. Emam,8 T. Engelmore,14 A. Enokizono,24, 42, 58, 62, 64 H. En’yo,62, 63 B. Espagnon,59S. Esumi,74 K.O. Eyser,7, 8 B. Fadem,50 N. Feege,69 D.E. Fields,55, 63 M. Finger,9, 32 M. Finger, Jr.,9, 32 F. Fleuret,40 S.L. Fokin,38 B. Forestier,44 Z. Fraenkel,77, ∗ J.E. Frantz,14, 57, 69 A. Franz,7 A.D. Frawley,21 K. Fujiwara,62
Y. Fukao,36, 39, 62 S.-Y. Fung,8 T. Fusayasu,52 S. Gadrat,44 K. Gainey,1 C. Gal,69 P. Gallus,15 P. Garg,3 A. Garishvili,72 I. Garishvili,42, 72 F. Gastineau,70H. Ge,69 M. Germain,70 F. Giordano,27A. Glenn,13, 42, 72
H. Gong,69 X. Gong,68 M. Gonin,40 J. Gosset,16 Y. Goto,62, 63 R. Granier de Cassagnac,40N. Grau,2, 14, 30 S.V. Greene,75 G. Grim,43 M. Grosse Perdekamp,27, 63 Y. Gu,68 T. Gunji,12 L. Guo,43 H. Guragain,22 H.-˚A. Gustafsson,45, ∗ T. Hachiya,24, 62 A. Hadj Henni,70 C. Haegemann,55 J.S. Haggerty,7 M.N. Hagiwara,1 K.I. Hahn,19 H. Hamagaki,12J. Hamblen,72 H.F. Hamilton,1 R. Han,60 S.Y. Han,19 J. Hanks,14, 69 H. Harada,24
E.P. Hartouni,42K. Haruna,24 M. Harvey,7S. Hasegawa,31 T.O.S. Haseler,22 K. Hashimoto,62, 64 E. Haslum,45 K. Hasuko,62 R. Hayano,12S. Hayashi,12 X. He,22 M. Heffner,42T.K. Hemmick,69T. Hester,8 J.M. Heuser,62 H. Hiejima,27 J.C. Hill,30R. Hobbs,55M. Hohlmann,20 R.S. Hollis,8M. Holmes,75 W. Holzmann,14, 68 K. Homma,24
B. Hong,37 T. Horaguchi,24, 62, 73, 74 Y. Hori,12 D. Hornback,72 T. Hoshino,24 N. Hotvedt,30 J. Huang,7, 43 S. Huang,75M.G. Hur,34 T. Ichihara,62, 63 R. Ichimiya,62 H. Iinuma,36, 39, 62 Y. Ikeda,62, 74 K. Imai,31, 39, 62 Y. Imazu,62 J. Imrek,17M. Inaba,74 Y. Inoue,62, 64 A. Iordanova,8 D. Isenhower,1L. Isenhower,1M. Ishihara,62 A. Isinhue,50 T. Isobe,12 M. Issah,68, 75 A. Isupov,32 D. Ivanishchev,61 Y. Iwanaga,24B.V. Jacak,69 M. Javani,22
S.J. Jeon,51 M. Jezghani,22 J. Jia,7, 14, 68 X. Jiang,43J. Jin,14 O. Jinnouchi,63 B.M. Johnson,7 T. Jones,1 K.S. Joo,51D. Jouan,59D.S. Jumper,1, 27 F. Kajihara,12, 62 S. Kametani,12, 76 N. Kamihara,62, 73 J. Kamin,69 S. Kanda,12, 36 M. Kaneta,63S. Kaneti,69B.H. Kang,23J.H. Kang,79J.S. Kang,23H. Kanou,62, 73J. Kapustinsky,43
K. Karatsu,39, 62M. Kasai,62, 64 T. Kawagishi,74D. Kawall,47, 63 M. Kawashima,62, 64A.V. Kazantsev,38S. Kelly,13 T. Kempel,30 J.A. Key,55V. Khachatryan,69P.K. Khandai,3 A. Khanzadeev,61 K.M. Kijima,24 J. Kikuchi,76 A. Kim,19 B.I. Kim,37 C. Kim,37 D.H. Kim,51D.J. Kim,33, 79 E. Kim,67 E.-J. Kim,10 G.W. Kim,19 H.J. Kim,79
K.-B. Kim,10 M. Kim,67 Y.-J. Kim,27 Y.K. Kim,23 Y.-S. Kim,34 B. Kimelman,50 E. Kinney,13 A. Kiss,´ 18 E. Kistenev,7R. Kitamura,12A. Kiyomichi,62J. Klatsky,21 J. Klay,42C. Klein-Boesing,49 D. Kleinjan,8 P. Kline,69
T. Koblesky,13L. Kochenda,61 V. Kochetkov,26M. Kofarago,18Y. Komatsu,12, 36 B. Komkov,61 M. Konno,74 J. Koster,27, 63 D. Kotchetkov,8, 57 D. Kotov,61, 65 A. Kozlov,77A. Kr´al,15 A. Kravitz,14 F. Krizek,33 P.J. Kroon,7
J. Kubart,9, 29 G.J. Kunde,43N. Kurihara,12 K. Kurita,62, 64 M. Kurosawa,62, 63 M.J. Kweon,37Y. Kwon,72, 79 G.S. Kyle,56R. Lacey,68 Y.S. Lai,14 J.G. Lajoie,30 A. Lebedev,30 Y. Le Bornec,59 S. Leckey,69B. Lee,23 D.M. Lee,43 G.H. Lee,10J. Lee,19 K.B. Lee,37, 43 K.S. Lee,37 M.K. Lee,79 S. Lee,79S.H. Lee,69 S.R. Lee,10 T. Lee,67
P. Liebing,63 H. Lim,67S.H. Lim,79 L.A. Linden Levy,13, 27, 42 T. Liˇska,15 A. Litvinenko,32H. Liu,43 M.X. Liu,43 B. Love,75D. Lynch,7 C.F. Maguire,75 Y.I. Makdisi,6, 7 M. Makek,77, 80 A. Malakhov,32 M.D. Malik,55A. Manion,69
V.I. Manko,38 E. Mannel,7, 14 Y. Mao,60, 62 T. Maruyama,31 L. Maˇsek,9, 29 H. Masui,74 S. Masumoto,12, 36 F. Matathias,14, 69M.C. McCain,27M. McCumber,13, 43, 69 P.L. McGaughey,43D. McGlinchey,13, 21 C. McKinney,27
N. Means,69A. Meles,56 M. Mendoza,8 B. Meredith,27 Y. Miake,74T. Mibe,36 J. Midori,24A.C. Mignerey,46 P. Mikeˇs,9, 29 K. Miki,62, 74 T.E. Miller,75 A. Milov,7, 69, 77 S. Mioduszewski,7 D.K. Mishra,4 G.C. Mishra,22 M. Mishra,3J.T. Mitchell,7 M. Mitrovski,68 Y. Miyachi,62, 73 S. Miyasaka,62, 73 S. Mizuno,62, 74 A.K. Mohanty,4
S. Mohapatra,68 P. Montuenga,27 H.J. Moon,51 T. Moon,79Y. Morino,12 A. Morreale,8 D.P. Morrison,7, † M. Moskowitz,50J.M. Moss,43 S. Motschwiller,50T.V. Moukhanova,38 D. Mukhopadhyay,75T. Murakami,39, 62
J. Murata,62, 64 A. Mwai,68T. Nagae,39 S. Nagamiya,36, 62 K. Nagashima,24 Y. Nagata,74 J.L. Nagle,13, ‡ M. Naglis,77 M.I. Nagy,18, 78 I. Nakagawa,62, 63 H. Nakagomi,62, 74 Y. Nakamiya,24 K.R. Nakamura,39, 62 T. Nakamura,24, 62 K. Nakano,62, 73 S. Nam,19 C. Nattrass,72 A. Nederlof,50 P.K. Netrakanti,4 J. Newby,42 M. Nguyen,69 M. Nihashi,24, 62 T. Niida,74 S. Nishimura,12 B.E. Norman,43 R. Nouicer,7, 63 T. Nov´ak,35, 78 N. Novitzky,33, 69 A. Nukariya,12 A.S. Nyanin,38 J. Nystrand,45 C. Oakley,22 H. Obayashi,24 E. O’Brien,7 S.X. Oda,12 C.A. Ogilvie,30 H. Ohnishi,62 H. Oide,12 I.D. Ojha,75 M. Oka,74 K. Okada,63 O.O. Omiwade,1 Y. Onuki,62 J.D. Orjuela Koop,13 J.D. Osborn,48A. Oskarsson,45I. Otterlund,45 M. Ouchida,24, 62K. Ozawa,12, 36 R. Pak,7 D. Pal,75 A.P.T. Palounek,43V. Pantuev,28, 69V. Papavassiliou,56B.H. Park,23 I.H. Park,19J. Park,10, 67
J.S. Park,67 S. Park,67 S.K. Park,37W.J. Park,37 S.F. Pate,56 L. Patel,22 M. Patel,30 H. Pei,30 J.-C. Peng,27 H. Pereira,16 D.V. Perepelitsa,7, 14 G.D.N. Perera,56V. Peresedov,32D.Yu. Peressounko,38J. Perry,30 R. Petti,7, 69
C. Pinkenburg,7 R. Pinson,1 R.P. Pisani,7 M. Proissl,69M.L. Purschke,7A.K. Purwar,43, 69 H. Qu,1, 22 J. Rak,30, 33, 55 A. Rakotozafindrabe,40B.J. Ramson,48 I. Ravinovich,77K.F. Read,58, 72 S. Rembeczki,20 M. Reuter,69 K. Reygers,49 D. Reynolds,68 V. Riabov,54, 61 Y. Riabov,61, 65 E. Richardson,46T. Rinn,30 N. Riveli,57
D. Roach,75 G. Roche,44, ∗ S.D. Rolnick,8 A. Romana,40, ∗ M. Rosati,30 C.A. Rosen,13 S.S.E. Rosendahl,45 P. Rosnet,44Z. Rowan,5 J.G. Rubin,48 P. Rukoyatkin,32P. Ruˇziˇcka,29V.L. Rykov,62M.S. Ryu,23 S.S. Ryu,79 B. Sahlmueller,49, 69N. Saito,36, 39, 62, 63 T. Sakaguchi,7, 12, 76 S. Sakai,74 K. Sakashita,62, 73 H. Sakata,24 H. Sako,31
V. Samsonov,54, 61 M. Sano,74 S. Sano,12, 76 M. Sarsour,22 H.D. Sato,39, 62 S. Sato,7, 31, 36, 74 T. Sato,74 S. Sawada,36 B. Schaefer,75 B.K. Schmoll,72 K. Sedgwick,8J. Seele,13, 63 R. Seidl,27, 62, 63Y. Sekiguchi,12 V. Semenov,26 A. Sen,22, 72 R. Seto,8 P. Sett,4 A. Sexton,46 D. Sharma,69, 77 A. Shaver,30T.K. Shea,7 I. Shein,26
A. Shevel,61, 68 T.-A. Shibata,62, 73 K. Shigaki,24 M. Shimomura,30, 53, 74 T. Shohjoh,74K. Shoji,39, 62 P. Shukla,4 A. Sickles,7, 27, 69 C.L. Silva,30, 43, 66 D. Silvermyr,45, 58 C. Silvestre,16 K.S. Sim,37 B.K. Singh,3 C.P. Singh,3
V. Singh,3 M. Skolnik,50 S. Skutnik,30 M. Sluneˇcka,9, 32 W.C. Smith,1 M. Snowball,43 S. Solano,50 A. Soldatov,26R.A. Soltz,42 W.E. Sondheim,43 S.P. Sorensen,72 I.V. Sourikova,7 F. Staley,16 P.W. Stankus,58
P. Steinberg,7 E. Stenlund,45 M. Stepanov,47, 56, ∗ A. Ster,78 S.P. Stoll,7 M.R. Stone,13 T. Sugitate,24 C. Suire,59 A. Sukhanov,7J.P. Sullivan,43 T. Sumita,62 J. Sun,69 J. Sziklai,78 T. Tabaru,63 S. Takagi,74 E.M. Takagui,66 A. Takahara,12A. Taketani,62, 63 R. Tanabe,74 K.H. Tanaka,36 Y. Tanaka,52 S. Taneja,69
K. Tanida,39, 62, 63, 67 M.J. Tannenbaum,7 S. Tarafdar,3, 77 A. Taranenko,54, 68P. Tarj´an,17E. Tennant,56 H. Themann,69 D. Thomas,1 T.L. Thomas,55 R. Tieulent,22A. Timilsina,30T. Todoroki,62, 74 M. Togawa,39, 62, 63
A. Toia,69J. Tojo,62L. Tom´aˇsek,29M. Tom´aˇsek,15, 29 H. Torii,12, 24, 62 C.L. Towell,1 R. Towell,1R.S. Towell,1 V-N. Tram,40 I. Tserruya,77 Y. Tsuchimoto,12, 24, 62 T. Tsuji,12 S.K. Tuli,3, ∗ H. Tydesj¨o,45 N. Tyurin,26 C. Vale,7, 30 H. Valle,75 H.W. van Hecke,43M. Vargyas,18 E. Vazquez-Zambrano,14A. Veicht,14, 27 J. Velkovska,75
R. V´ertesi,17, 78 A.A. Vinogradov,38 M. Virius,15 B. Voas,30 A. Vossen,27 V. Vrba,15, 29 E. Vznuzdaev,61 M. Wagner,39, 62 D. Walker,69 X.R. Wang,56, 63 D. Watanabe,24 K. Watanabe,62, 64, 74 Y. Watanabe,62, 63 Y.S. Watanabe,12, 36 F. Wei,30, 56 R. Wei,68 J. Wessels,49S. Whitaker,30 A.S. White,48 S.N. White,7 N. Willis,59
D. Winter,14 S. Wolin,27 C.L. Woody,7 R.M. Wright,1 M. Wysocki,13, 58 B. Xia,57 W. Xie,8, 63 L. Xue,22 S. Yalcin,69 Y.L. Yamaguchi,12, 62, 69, 76 K. Yamaura,24 R. Yang,27 A. Yanovich,26 Z. Yasin,8 J. Ying,22 S. Yokkaichi,62, 63J.H. Yoo,37 I. Yoon,67Z. You,43, 60 G.R. Young,58 I. Younus,41, 55 H. Yu,60 I.E. Yushmanov,38
W.A. Zajc,14O. Zaudtke,49 A. Zelenski,6 C. Zhang,14, 58 S. Zhou,11 J. Zimamyi,78, ∗ L. Zolin,32 and L. Zou8 (PHENIX Collaboration)
1Abilene Christian University, Abilene, Texas 79699, USA
2Department of Physics, Augustana University, Sioux Falls, South Dakota 57197, USA
3Department of Physics, Banaras Hindu University, Varanasi 221005, India
4Bhabha Atomic Research Centre, Bombay 400 085, India
5Baruch College, City University of New York, New York, New York, 10010 USA
7Physics Department, Brookhaven National Laboratory, Upton, New York 11973-5000, USA
8University of California-Riverside, Riverside, California 92521, USA
9Charles University, Ovocn´y trh 5, Praha 1, 116 36, Prague, Czech Republic
10Chonbuk National University, Jeonju, 561-756, Korea
11Science and Technology on Nuclear Data Laboratory, China Institute of Atomic Energy, Beijing 102413, P. R. China
12Center for Nuclear Study, Graduate School of Science, University of Tokyo, 7-3-1 Hongo, Bunkyo, Tokyo 113-0033, Japan
13University of Colorado, Boulder, Colorado 80309, USA
14Columbia University, New York, New York 10027 and Nevis Laboratories, Irvington, New York 10533, USA
15Czech Technical University, Zikova 4, 166 36 Prague 6, Czech Republic
16Dapnia, CEA Saclay, F-91191, Gif-sur-Yvette, France
17Debrecen University, H-4010 Debrecen, Egyetem t´er 1, Hungary
18ELTE, E¨otv¨os Lor´and University, H-1117 Budapest, P´azm´any P. s. 1/A, Hungary
19Ewha Womans University, Seoul 120-750, Korea
20Florida Institute of Technology, Melbourne, Florida 32901, USA
21Florida State University, Tallahassee, Florida 32306, USA
22Georgia State University, Atlanta, Georgia 30303, USA
23Hanyang University, Seoul 133-792, Korea
24Hiroshima University, Kagamiyama, Higashi-Hiroshima 739-8526, Japan
25Department of Physics and Astronomy, Howard University, Washington, DC 20059, USA
26IHEP Protvino, State Research Center of Russian Federation, Institute for High Energy Physics, Protvino, 142281, Russia
27University of Illinois at Urbana-Champaign, Urbana, Illinois 61801, USA
28Institute for Nuclear Research of the Russian Academy of Sciences, prospekt 60-letiya Oktyabrya 7a, Moscow 117312, Russia
29Institute of Physics, Academy of Sciences of the Czech Republic, Na Slovance 2, 182 21 Prague 8, Czech Republic
30Iowa State University, Ames, Iowa 50011, USA
31Advanced Science Research Center, Japan Atomic Energy Agency, 2-4
Shirakata Shirane, Tokai-mura, Naka-gun, Ibaraki-ken 319-1195, Japan
32Joint Institute for Nuclear Research, 141980 Dubna, Moscow Region, Russia
33Helsinki Institute of Physics and University of Jyv¨askyl¨a, P.O.Box 35, FI-40014 Jyv¨askyl¨a, Finland
34KAERI, Cyclotron Application Laboratory, Seoul, Korea
35K´aroly R´oberts University College, H-3200 Gy¨ngy¨os, M´atrai ´ut 36, Hungary
36KEK, High Energy Accelerator Research Organization, Tsukuba, Ibaraki 305-0801, Japan
37Korea University, Seoul, 136-701, Korea
38National Research Center “Kurchatov Institute”, Moscow, 123098 Russia
39Kyoto University, Kyoto 606-8502, Japan
40Laboratoire Leprince-Ringuet, Ecole Polytechnique, CNRS-IN2P3, Route de Saclay, F-91128, Palaiseau, France
41Physics Department, Lahore University of Management Sciences, Lahore 54792, Pakistan
42Lawrence Livermore National Laboratory, Livermore, California 94550, USA
43Los Alamos National Laboratory, Los Alamos, New Mexico 87545, USA
44LPC, Universit´e Blaise Pascal, CNRS-IN2P3, Clermont-Fd, 63177 Aubiere Cedex, France
45Department of Physics, Lund University, Box 118, SE-221 00 Lund, Sweden
46University of Maryland, College Park, Maryland 20742, USA
47Department of Physics, University of Massachusetts, Amherst, Massachusetts 01003-9337, USA
48Department of Physics, University of Michigan, Ann Arbor, Michigan 48109-1040, USA
49Institut f¨ur Kernphysik, University of Muenster, D-48149 Muenster, Germany
50Muhlenberg College, Allentown, Pennsylvania 18104-5586, USA
51Myongji University, Yongin, Kyonggido 449-728, Korea
52Nagasaki Institute of Applied Science, Nagasaki-shi, Nagasaki 851-0193, Japan
53Nara Women’s University, Kita-uoya Nishi-machi Nara 630-8506, Japan
54National Research Nuclear University, MEPhI, Moscow Engineering Physics Institute, Moscow, 115409, Russia
55University of New Mexico, Albuquerque, New Mexico 87131, USA
56New Mexico State University, Las Cruces, New Mexico 88003, USA
57Department of Physics and Astronomy, Ohio University, Athens, Ohio 45701, USA
58Oak Ridge National Laboratory, Oak Ridge, Tennessee 37831, USA
59IPN-Orsay, Univ. Paris-Sud, CNRS/IN2P3, Universit´e Paris-Saclay, BP1, F-91406, Orsay, France
60Peking University, Beijing 100871, P. R. China
61PNPI, Petersburg Nuclear Physics Institute, Gatchina, Leningrad region, 188300, Russia
62RIKEN Nishina Center for Accelerator-Based Science, Wako, Saitama 351-0198, Japan
63RIKEN BNL Research Center, Brookhaven National Laboratory, Upton, New York 11973-5000, USA
64Physics Department, Rikkyo University, 3-34-1 Nishi-Ikebukuro, Toshima, Tokyo 171-8501, Japan
65Saint Petersburg State Polytechnic University, St. Petersburg, 195251 Russia
66Universidade de S˜ao Paulo, Instituto de F´ısica, Caixa Postal 66318, S˜ao Paulo CEP05315-970, Brazil
67Department of Physics and Astronomy, Seoul National University, Seoul 151-742, Korea
68Chemistry Department, Stony Brook University, SUNY, Stony Brook, New York 11794-3400, USA
70SUBATECH (Ecole des Mines de Nantes, CNRS-IN2P3, Universit´e de Nantes) BP 20722-44307, Nantes, France
71Sungkyunkwan University, Suwon, 440-746, Korea
72University of Tennessee, Knoxville, Tennessee 37996, USA
73Department of Physics, Tokyo Institute of Technology, Oh-okayama, Meguro, Tokyo 152-8551, Japan
74Center for Integrated Research in Fundamental Science and Engineering, University of Tsukuba, Tsukuba, Ibaraki 305, Japan
75Vanderbilt University, Nashville, Tennessee 37235, USA
76Waseda University, Advanced Research Institute for Science and
Engineering, 17 Kikui-cho, Shinjuku-ku, Tokyo 162-0044, Japan
77Weizmann Institute, Rehovot 76100, Israel
78Institute for Particle and Nuclear Physics, Wigner Research Centre for Physics, Hungarian
Academy of Sciences (Wigner RCP, RMKI) H-1525 Budapest 114, POBox 49, Budapest, Hungary
79Yonsei University, IPAP, Seoul 120-749, Korea
80University of Zagreb, Faculty of Science, Department of Physics, Bijeniˇcka 32, HR-10002 Zagreb, Croatia
(Dated: February 24, 2016)
Measurements of midrapidity charged particle multiplicity distributions, dNch/dη, and
midrapid-ity transverse-energy distributions, dET/dη, are presented for a variety of collision systems and
energies. Included are distributions for Au+Au collisions at √sN N = 200, 130, 62.4, 39, 27,
19.6, 14.5, and 7.7 GeV, Cu+Cu collisions at √sN N = 200 and 62.4 GeV, Cu+Au collisions at
√s
N N = 200 GeV, U+U collisions at √sN N = 193 GeV, d+Au collisions at √sN N = 200 GeV,
3He+Au collisions at √s
N N = 200 GeV, and p+p collisions at √sN N = 200 GeV.
Centrality-dependent distributions at midrapidity are presented in terms of the number of nucleon partici-pants, Npart, and the number of constituent quark participartici-pants, Nqp. For all A+A collisions down
to √sN N = 7.7 GeV, it is observed that the midrapidity data are better described by scaling with
Nqpthan scaling with Npart. Also presented are estimates of the Bjorken energy density, εBJ, and
the ratio of dET/dη to dNch/dη, the latter of which is seen to be constant as a function of centrality
for all systems.
PACS numbers: 25.75.Dw
I. INTRODUCTION
Systematic measurements of the centrality dependence of transverse energy production and charged particle multiplicity at midrapidity provide excellent character-ization of the nuclear geometry of the reaction and are sensitive to the dynamics of the colliding system. For ex-ample, measurements of dNch/dη and dET/dη in Au+Au collisions at √sN N = 200 GeV and 130 GeV as a func-tion of centrality expressed as the number of participant nucleons, Npart, exhibit a nonlinear increase with increas-ing Npart. This has been explained by a two-component model proportional to a linear combination of the num-ber of collisions, Ncoll, and Npart [1, 2]. In a previous study by the PHENIX collaboration, measurements of dET/dη and dNch/dη for Au+Au collisions at 200, 130, and 62.4 GeV are presented along with comparisons to the results of several models [3]. The models that were examined included HIJING [4], a final state parton sat-uration model called EKRT [5], an initial state parton saturation model called KLN [2], and a multiphase trans-port model called AMPT [6]. The comparisons showed that most models could reproduce some of the features of the data, but most failed in describing all of the data with the HIJING and AMPT models best describing the
∗Deceased
†PHENIX Co-Spokesperson: morrison@bnl.gov ‡PHENIX Co-Spokesperson: jamie.nagle@colorado.edu
overall trends, including the nonlinear increase of dET/dη and dNch/dη as a function of Npart.
It was also proposed that dNch/dη is linearly propor-tional to the number of constituent-quark participants without a significant contribution from a hard scatter-ing component [7]. Recently, the PHENIX collaboration at Brookhaven National Laboratory’s Relativistic Heavy Ion Collider (RHIC), presented dET/dη distributions at midrapidity for Au+Au collisions at √sN N = 200, 130, and 62.4 GeV, d+Au collisions at √sN N = 200 GeV, and p+p collisions at √sN N = 200 GeV [8]. The data are better described by a model based upon the number of constituent quark participants than by the wounded nu-cleon model [9]. Here, this study will be extended to in-clude both dET/dη and dNch/dη measurements at midra-pidity in Au+Au collisions down to √sN N = 7.7 GeV. This study will also examine the centrality dependence of dET/dη and dNch/dη for smaller systems including Cu+Au, Cu+Cu, d+Au, and3He+Au.
Recent lattice quantum chromodynamics (QCD) cal-culations indicate that the transition from quark to hadronic matter is a crossover transition at high tempera-ture and small baryochemical potential, µB[10]. At high values of µB and low temperatures, model calculations indicate the presence of a first-order phase transition and the possibility of a critical end point in the QCD phase diagram [11]. Relativistic heavy ion collisions serve as excellent probes of the QCD phase diagram [12]. The re-gion of the QCD phase diagram sampled by the collisions can be controlled by changing the beam energy. Lowering
the beam energy corresponds to raising the value of µB. From 2010 to 2014, RHIC executed a beam energy scan program to explore the QCD phase diagram, look for ev-idence of the phase boundaries and search for evev-idence of the critical end point. Presented here are dET/dη and dNch/dη measurements from the beam energy scan as a function of centrality expressed as the number of nucleon participants, Npart, from Au+Au collisions at √sN N = 200, 130, 62.4, 39, 27, 19.6, 14.5, and 7.7 GeV.
Over the past 15 years, PHENIX has collected a com-prehensive dataset covering a wide variety of colliding nu-clei and collision energies, including the Au+Au collision beam energy scan mentioned above. Presented here will be charged particle multiplicity and transverse energy measurements from the following systems: Au+Au colli-sions at √sN N = 200, 130, 62.4, 39, 27, 19.6, 14.5, and 7.7 GeV; Cu+Cu collisions at √sN N = 200 and 62.4 GeV; Cu+Au collisions at √sN N = 200 GeV; U+U collisions at √sN N = 193 GeV;
3He+Au collisions at √s N N = 200 GeV; d+Au collisions at √sN N = 200 GeV; and p+p collisions at √sN N = 200 GeV. The results will be dis-cussed in the context of scaling with the number of par-ticipant nucleons (Npart) and the number of parpar-ticipant quarks (Nqp).
PHENIX has previously published charged parti-cle multiplicity distributions from Au+Au collisions at √s
N N = 200 GeV [3], Au+Au collisions at √sN N = 130 GeV [3, 13], and Au+Au collisions at √sN N = 19.6 GeV [3]. PHENIX has also previously published transverse energy distributions from Au+Au collisions at √sN N = 200 GeV [3], Au+Au collisions at √sN N = 130 GeV [14], Au+Au collisions at √sN N = 62.4 GeV [8], Au+Au collisions at √sN N = 19.6 GeV [3], and minimum-bias distributions for d+Au and p+p collisions at √sN N = 200 GeV [8]. Here the previously published PHENIX results will be presented along with data from the many new collision systems in a consistent format to facilitate comparisons.
Similar measurements have been published by the other RHIC experiments. Charged particle multiplic-ity distributions have been published by BRAHMS for Au+Au collisions at √sN N = 200 and 130 GeV [15], STAR for Au+Au collisions at √sN N = 130 GeV [16], and PHOBOS for Au+Au collisions at √sN N = 200, 130, 62.4, 56, and 19.6 GeV along with Cu+Cu colli-sions at √sN N = 200 and 62.4 GeV, d+Au collisions at √s
N N = 200 GeV, and p+p collisions at √sN N = 410 and 200 GeV [17]. Transverse energy distributions have been published by STAR for Au+Au collisions at √sN N = 200 GeV [18]. Presented here are many collision systems and energies that have not been previously published by PHENIX or the other RHIC experiments, especially for the transverse energy measurements. The first complete results on charged particle multiplicity and transverse energy from the RHIC beam energy scan program con-ducted from 2010 to 2014 are also included.
This paper is organized as follows. The PHENIX de-tector and the methods used for centrality determination
in each dataset will be described in Section II. The analy-sis of the data to measure dET/dη and dNch/dη including a description of estimates of the systematic uncertainties is described in Section III. The centrality dependent re-sults at midrapidity from the Au+Au beam energy scan in terms of Npartare presented in Section IV. A descrip-tion of the centrality dependent results at midrapidity for Cu+Cu and Cu+Au collisions in terms of Npart are found in Section V. A description of the centrality depen-dent results at midrapidity for U+U collisions in terms of Npart are found in Section VI. Section VII contains a description of the centrality dependent results at midra-pidity of3He+Au and d+Au collisions in terms of Npart. A review all of the centrality dependent results in terms of Nqp is presented in Section VIII. Section IX contains a summary of the results. Data tables for all data sets are tabulated in the Appendix.
II. THE PHENIX DETECTOR
The PHENIX detector comprises two central spec-trometer arms, two muon specspec-trometer arms, and a set of forward detectors. All of the detector components and their performance is described elsewhere [19]. The analy-sis of charged particle multiplicity utilizes detectors in the central arm spectrometer [20] including the drift cham-ber (DC) and pad chamcham-ber 1 (PC1) detectors. The drift chambers are cylindrically shaped and located radially from 2.0 to 2.4 meters. The DC covers the pseudora-pidity region |η| <0.35 and 90oin azimuth for each arm. The DC has a resolution better than 150 µm in r-φ, better than 2 mm in the z direction, and a two track separation better than 1.5 mm. The PC1 detector is a multiwire proportional chamber mounted on the outer radius of the drift chamber at 2.5 m from the beam axis. PC1 cov-ers the full central arm acceptance. PC1 measures min-imum ionizing particles with an efficiency greater than 99.5% with a position resolution of 1.7 mm by 3 mm and a two track separation of 4 cm. Reconstructed tracks from the drift chamber with an associated hit from PC1 are counted as charged particle tracks in the multiplicity measurement.
The analysis of transverse energy utilizes five of the lead-scintillator (PbSc) electromagnetic-calorimeter (EMCal) sectors in the central arm spectrometers [21]. Each calorimeter sector covers a pseudorapidity range of |η| <0.38 and subtends 22.5o in azimuth for a total azimuthal coverage of 112.5o. The front face of each sec-tor is located 5.1 m from the beam axis. Each secsec-tor contains 2592 PbSc towers arranged in a 36 × 72 ar-ray. Each tower has a 5.535 × 5.535 cm surface area and a thickness of 0.85 nuclear interaction lengths or 18 radiation lengths. The PbSc EMCal energy resolu-tion has been measured using test beam electrons to be ∆E
E =
8.1% √
E(GeV )⊕ 2.1%, with a measured response pro-portional to the incident electron energy to within ±2% over the range 0.3 ≤ Ee≤ 40 GeV.
For all data sets, a minimum-bias trigger is provided by a pair of beam-beam counters (BBC) [22]. Each BBC comprises 64 individual ˇCerenkov counters. Each BBC covers 2π azimuthally and a pseudorapidity range of 3.0 < |η| < 3.9. For p+p, d+Au, and 3He+Au collisions, an event is required to have at least one counter fire in each BBC. For all other collisions, at least two counters must fire in each BBC. The event vertex is reconstructed with a resolution of 2.0 cm in p+p collisions and 0.5 mm in central Au+Au collisions using the timing information from the BBCs. All events are required to have an event vertex within 20 cm of the center of the detector.
Centrality determination in the original √sN N = 200 GeV and √sN N = 130 GeV Au+Au PHENIX anal-ysis is based upon the total charge deposited in the BBCs and the total energy deposited in the zero-degree calorimeters (ZDC) [22]. The ZDCs are a pair of hadronic calorimeters that cover the pseudorapidity range |η| >6. For subsequent data sets taken after 2002, only the BBC information is used for the centrality determination, in-cluding the following data sets: Cu+Au at √sN N = 200 GeV, Cu+Cu at √sN N = 200 GeV, U+U at √sN N = 193 GeV, 3He+Au at √s
N N = 200 GeV, and d+Au at √sN N = 200 GeV. As the collision energy decreases, the width of the pseudorapidity distribution of produced particles becomes more narrow [23]. As a result, for ener-gies below √sN N = 130 GeV, the acceptance of the ZDC is reduced, therefore only the BBC information is used for Au+Au collisions at √sN N = 62.4 and 39 GeV, and for Cu+Cu collisions at √sN N = 62.4 GeV. Below √sN N = 39 GeV, the BBC acceptance becomes sensitive to the presence of beam fragments, which affects the linear re-sponse of the BBC to the centrality. To avoid this non-linear response, the reaction-plane detector (RXNP) [24] is used for the centrality determination for Au+Au col-lisions at √sN N = 7.7 GeV, which was taken during the 2010 running period. The RXNP comprises two sets of plastic scintillators positioned on either side of the colli-sion vertex. Each RXNP detector is arranged in 12 az-imuthal segments separated into an inner and outer ring. The RXNP has an azimuthal coverage of 2π. The pseu-dorapidity coverage is 1.5< |η| <2.8 and 1.0< |η| <1.5 for the inner and outer ring, respectively. A 2 cm thick lead converter is located directly in front of the RXNP scin-tillators with respect to the collision region, which allows the RXNP to also measure contributions from neutral particles through conversion electrons. The RXNP is de-signed to measure the reaction plane angle, but it can also function well as a centrality detector, because the magnitude of the total charge measured by the RXNP is dependent on the centrality of the collision. In order to minimize contamination from beam fragments, only the outer ring of the RXNP is used for centrality determina-tion for Au+Au collisions at √sN N = 7.7 GeV. For the 2011 data taking period and later when the Au+Au data sets at √sN N = 27, 19.6, and 14.5 GeV were collected, the RXNP was removed in order to install a silicon ver-tex detector, which was being commissioned during this
time. So, for these two data sets, the multiplicity of hits in the PC1 detector were used to determine the central-ity. A summary of the centrality detectors used for each dataset is included in Table I.
III. DATA ANALYSIS
Table I provides a summary of the data sets used in this analysis. For Au+Au collisions at √sN N= 62.4 GeV, the dET/dη analysis uses data taken in 2004 [8] and the dNch/dη analysis uses data taken in 2010. The number of events are those events that pass the minimum-bias trigger condition for the dataset and have an event vertex within 20 cm of the center of the detector.
TABLE I. Summary of the data sets used in this analysis.
√s
N N (GeV) System Year Nevents Centrality Trigger eff.
200 Au+Au 2002 270 k BBC+ZDC 93 ± 3% 200 Au+Au 2004 133 M BBC+ZDC 93 ± 3% 130 Au+Au 2000 160 k BBC+ZDC 93 ± 3% 62.4 Au+Au 2004 20 M BBC 86 ± 3% 62.4 Au+Au 2010 12 M BBC 86 ± 3% 39 Au+Au 2010 132 M BBC 86 ± 3% 27 Au+Au 2011 24.5 M PC1 86 ± 3% 19.6 Au+Au 2011 6.3 M PC1 86 ± 3% 14.5 Au+Au 2014 6.8 M PC1 85 ± 3% 7.7 Au+Au 2010 803 k RXNP 75 ± 3% 200 Cu+Cu 2005 558 M BBC 93 ± 3% 62.4 Cu+Cu 2005 175 M BBC 88 ± 3% 200 Cu+Au 2012 2.6 B BBC 93 ± 3% 193 U+U 2012 317 M BBC 93 ± 3% 200 3He+Au 2014 1.6 B BBC 88 ± 4% 200 d+Au 2008 1.4 B BBC 88 ± 4% 200 p+p 2003 14.6 M — 54.8 ± 5.3%
A. Transverse Energy Analysis
The analysis procedure for dET/dη is described in de-tail in Ref. [8] and summarized here. The absolute en-ergy scale for each EMCal sector is calibrated using the π0 mass peak from pairs of reconstructed EMCal clus-ters for each dataset. The transverse energy for each event was computed using clusters in the EMCal with an energy greater than 30 MeV composed of adjacent tow-ers each with a deposited energy of more than 10 MeV. Faulty towers and all towers in a 3 × 3 tower area around any faulty tower are excluded from the analysis. The transverse energy ET is a multiparticle variable defined as the sum
ET =X
i
dET(η)/dη = sin θ(η) dE(η)/dη , (1) where θi is the polar angle, η = − ln tan(θ/2) is the pseudorapidity, Ei is by convention taken as the kinetic energy for baryons, the kinetic energy + 2 mN for an-tibaryons, and the total energy for all other particles, where mN is the nucleon mass. The sum is taken over all particles emitted into a fixed solid angle for each event. An example of the raw ET EMCdistributions as a function of centrality for Au+Au collisions at √sN N = 14.5 GeV are shown in Fig. 1(a).
In order to obtain the total hadronic ET within a ref-erence acceptance of ∆η = 1.0, ∆φ = 2π from the mea-sured raw transverse energy, ET EMC, the total correction can be decomposed into three main components. First is a correction by a factor of 4.188 to account for the fiducial acceptance in azimuth and pseudorapidity. Sec-ond, a correction factor is applied to account for disabled calorimeter towers not used in the analysis. Third is a factor, k, which is the ratio of the total hadronic ET in the fiducial aperture to the measured ET EMC. Details on the estimate of the values of the k factor are given below. The k factor comprises three components. The first component, denoted kresponse, is due to the fact that the EMCal was designed for the detection of electromag-netic particles [14]. Hadronic particles passing through the EMCal only deposit a fraction of their total energy. The average EMCal response is estimated for the various particle species using the HIJING [4] event generator for √s
N N above 7.7 GeV and the URQMD [25] event gen-erator for Au+Au collisions at √sN N = 7.7 GeV. The event generator output is processed through a geant-based Monte Carlo simulation of the PHENIX detector. For all of the data sets, 75% of the total energy incident on the EMCal is measured, thus kresponse = 1/0.75 = 1.33. The second component of the k factor, denoted kinf low, is a correction for energy inflow from outside the fiducial aperture of the EMCal. This energy inflow has two sources: from parent particles with an original trajectory outside of the fiducial aperture whose decay products are incident within the fiducial aperture, and from particles that reflect off of the PHENIX magnet poles into the EMCal fiducial aperture. The energy in-flow contribution is 24% of the measured energy, thus kinf low = 1-0.24 = 0.76. The third component of the k factor, denoted klosses, is due to energy losses. There are three components to the energy loss: from particles with an original trajectory inside the fiducial aperture of the EMCal whose decay products are outside of the fidu-cial aperture (10%), from energy losses at the edges of the EMCal (6%), and from energy losses due to the en-ergy thresholds (6%). The total contribution from enen-ergy losses is 22%, thus klosses = 1/(1-0.22) = 1.282. The to-tal k factor correction is k = kresponse× kinf low× klosses = 1.30. This value varies by less than 1% for all data sets.
There are several contributions to the systematic un-certainties for the dET/dη measurement which are added in quadrature to obtain the total uncertainty. These
contributions include the following: uncertainties due to the energy response of the EMCal, uncertainties due to the estimate of the EMCal acceptance, uncertainties due to the estimate of losses and inflow, uncertainties due to sector-by-sector variations, uncertainties due to the noise background estimate, uncertainties due to the trig-ger background estimate, and uncertainties due to the trigger efficiency estimate. A summary of the systematic uncertainties for the dET/dη analysis of each dataset is listed in Table II for each dataset and further explained below.
There is an uncertainty due to the energy response of the EMCal. This includes uncertainties in the ab-solute energy scale, uncertainties in the estimate of the hadronic response, uncertainties from energy losses on the EMCal edges and uncertainties from energy thresh-olds. The uncertainties in the hadronic response include a 3% uncertainty estimated using a comparison of the simulated energy deposited by hadrons with different mo-menta with test beam data [21] along with an additional 1% uncertainty in the particle composition and momen-tum distribution. There is an estimated uncertainty of 2% for the calculation of the EMCal acceptance. There is an estimated uncertainty of 3% for the calculation of the fraction of the total energy incident on the EMCal fidu-cial area (losses and inflow). There is an uncertainty due to sector-by-sector variations in the energy measurement. There is an uncertainty due to the noise, or background, contribution which is estimated to be consistent with zero with uncertainties determined by measuring the average energy deposited per sector in events where all the par-ticles are screened by the central magnet pole tips by requiring an interaction z-vertex of +50 < z < +60 cm and −60 < z < −50 cm. There is a centrality-dependent uncertainty for background due to multiple interactions and trigger effects.
There is also an uncertainty in the trigger efficiency de-termination. The method by which the trigger efficiency is calculated is described in [3]. The BBC trigger effi-ciency for Au+Au collisions ranges from 93% at √sN N = 200 GeV to 75% at √sN N = 7.7 GeV. The trigger efficiencies for each dataset are summarized in Table I. Note that the trigger inefficiency leads to a partial loss of the more peripheral collisions while the trigger is fully efficient for midcentral and central collisions. Because the centrality is defined for a given event as a percent-age of the total geometrical cross section, an uncertainty in the trigger efficiency translates into an uncertainty in the centrality definition. This uncertainty is estimated by measuring the variation in dET/dη by redefining the centrality using trigger efficiencies that vary by ±1 stan-dard deviation.
The trigger efficiency uncertainty allows for bend-ing or inclination of the points. So, when plotting (dET/dη)/(0.5Npart) and (dNch/dη)/(0.5Npart), the trig-ger efficiency will be represented by error bands about the points within which the points can be tilted. The other systematic and statistical uncertainties are represented
[GeV] T EMC E 0 5 10 15 20 25 30 35 40 ] -1 [GeV T EMC dY/dE -5 10 -4 10 -3 10 -2
10 (a) PHENIX 14.5 GeV Au+Au
ch Raw N 0 20 40 60 80 100 ch dY/dN -5 10 -4 10 -3 10 -2 10 -1 10
(b) PHENIX 14.5 GeV Au+Au
FIG. 1. (Color online) Raw ETEMC(a) and Nch(b)
distribu-tions for√sNN= 14.5 GeV Au+Au collisions. Shown are the
minimum-bias distribution along with the distributions in 5% wide centrality bins. All the plots are normalized so that the integral of the minimum-bias distribution is unity.
by error bars.
B. Charged Particle Multiplicity Analysis
In previous PHENIX publications [3, 13] for Au+Au collisions at √sN N = 200 and 130 GeV, charged parti-cle multiplicity was measured using cluster pairs recon-structed from the PC1 and PC3 detectors in the absence of a magnetic field. The dNch/dη values quoted here for Au+Au collisions at √sN N = 200 and 130 GeV are from the previous analyses. For all other collision species and collision energies, charged particle multiplicity is mea-sured using reconstructed tracks from the drift chamber that have an unambiguous match to a reconstructed clus-ter in the PC1 detector with the magnetic field turned on. In order to remove multiple counting of incorrectly reconstructed tracks in the drift chamber, commonly re-ferred to as ghost tracks, a charge-dependent track prox-imity cut is applied. The two methods give consistent results for 200 GeV Au+Au collisions. An example of the raw Nchdistributions as a function of centrality for
the Au+Au collisions at √sN N = 14.5 GeV are shown in Fig. 1 (b).
In order to obtain the total charged particle Nchwithin a reference acceptance of ∆η = 1.0, ∆φ = 2π from the measured raw multiplicity, five corrections are applied. First is a correction of 3.74 to account for the fiducial acceptance in azimuth and pseudorapidity. The second correction is applied to account for drift chamber and PC1 inefficiencies within the fiducial acceptance. The third correction is applied to account for particles with a transverse momentum below the 200 MeV/c minimum pT cut applied to reconstructed tracks. This correction is determined using the average of results from the HI-JING event generator [4] and the URQMD event gen-erator [25] to estimate the fraction of the total charged particle multiplicity lying below pT = 200 MeV/c. The collision energy cutoff for the HIJING event generator lies above √sN N = 7.7 GeV, so only URQMD is used for Au+Au collisions at √sN N = 7.7 GeV. This correction is 22% for Au+Au collisions at √sN N = 62.4 GeV and 23% for Au+Au collisions at √sN N = 7.7 GeV. There is an estimated 2% uncertainty for this correction. The fourth correction is a centrality-dependent correction for the track reconstruction efficiency.
The last correction is an in-flight decay correction that accounts for particle decays after the collision interaction that can add or remove charged particles from the mea-sured multiplicity. This includes primary charged parti-cles that decay and miss the detector. It also includes feed-down from neutral primary particle decays that go into the detector. This correction is determined by pro-cessing simulated events from the HIJING [4] event gen-erator for √sN N above 7.7 GeV, and the URQMD [25] event generator at √sN N = 7.7 GeV. Below √sN N = 62.4 GeV, results from the two event generators are con-sistent with each other within the uncertainties. The event generator output is processed through a geant-based simulation of the PHENIX detector response. For Au+Au collisions, this correction varies from 0.99 at √s
N N = 200 GeV to 1.061 at √sN N = 7.7 GeV. The energy dependence is primarily due to the decrease of the particle momenta and the narrowing of the width of the η distribution at lower energies that affects the num-ber of tracks from the decay of particles coming from comparable rapidities.
There are several contributions to the systematic un-certainties for the dNch/dη measurement which are added in quadrature to obtain the total uncertainty. A sum-mary of the systematic uncertainties for the dNch/dη analysis for all data sets is listed in Table III. There is an estimated uncertainty of 4% for the acceptance cor-rection. There is an uncertainty for the estimate of the correction for in-flight decays that varies from 2.9% at √s
N N = 200 GeV to 5.9% at √sN N = 7.7 GeV. There is a 2% uncertainty for the estimate of charged particle multiplicity for low pT below 200 MeV/c. There is a centrality dependent uncertainty due to the occupancy of the PC1 detector that varies from 3.5% to 1.2% for
TABLE II. Summary of the systematic uncertainties for the dET/dη measurement for each dataset, given in percent (%). If a range is specified, the value for central collisions is listed first and the value for the most peripheral collisions presented for the dataset is listed second. If no value is specified, then there is no contribution to the systematic uncertainty for that dataset.
Dataset energy resp. acceptance losses & inflow sector-by-sector noise trigger bkg. trigger eff.
200 GeV Au+Au 3.9 2.0 3.0 — 0.2-6.0 — 0.3-16.0 130 GeV Au+Au 3.8 2.0 3.0 — 0.4-10.0 — 0.3-16.0 62.4 GeV Au+Au 4.3 2.0 3.0 2.2 0.4-4.1 0.01-0.06 0.3-16.1 39 GeV Au+Au 4.5 2.0 3.0 1.6 0.5-3.6 0.002-0.02 0.2-16.3 27 GeV Au+Au 4.5 2.0 3.0 2.2 0.5-3.5 0.006-0.04 0.3-13.1 19.6 GeV Au+Au 4.7 2.0 3.0 2.8 0.5-3.5 0.008-0.07 0.3-13.4 14.5 GeV Au+Au 4.7 2.0 3.0 2.9 0.5-3.4 0.007-0.04 0.3-9.8 7.7 GeV Au+Au 4.7 2.0 3.0 3.7 0.5-3.4 0.002-0.05 0.4-10.6 200 GeV Cu+Cu 3.9 2.0 3.0 5.9 0.2-6.0 0.002-0.04 0.3-6.5 62.4 GeV Cu+Cu 4.5 2.0 3.0 2.2 0.4-4.1 0.006-0.02 0.3-8.1 200 GeV Cu+Au 3.9 2.0 3.0 2.8 0.5-3.5 0.02-0.20 0.2-8.8 193 GeV U+U 3.9 2.0 3.0 2.5 0.2-6.0 0.001-0.03 0.4-9.3 200 GeV d+Au 3.9 2.0 3.0 6.5 0.2-0.2 0.13-0.21 0.3-5.1 200 GeV3He+Au 3.9 2.0 3.0 3.9 0.2-0.2 0.08-0.16 0.2-5.2 200 GeV p+p 3.9 2.0 3.0 3.9 0.2 0.60 —
TABLE III. Summary of the systematic uncertainties for charged particle multiplicity for each dataset given in percent (%). If a range is specified, the value for central collisions is listed first and the value for the most peripheral collisions presented for the dataset is listed second. If no value is specified, then there is no contribution to the systematic uncertainty for that dataset.
Dataset acceptance decays low pT occupancy tracking eff. trigger bkg. trigger eff.
200 GeV Au+Au 2.3 2.9 2.0 3.5-0.10 — 1.0 0.3-16.0 130 GeV Au+Au 2.5 2.5 2.0 3.1-0.10 — 1.0 0.3-16.0 62.4 GeV Au+Au 4.0 5.0 2.0 3.5-0.10 5.0 0.001-0.03 0.2-16.1 39 GeV Au+Au 4.0 5.4 2.0 3.0-0.03 5.0 0.001-0.009 0.2-13.0 27 GeV Au+Au 4.0 5.6 2.0 2.0-0.01 5.0 0.01-0.03 0.2-13.3 19.6 GeV Au+Au 4.0 5.7 2.0 1.9-0.01 5.0 0.002-0.003 0.2-9.3 14.5 GeV Au+Au 4.0 5.8 2.0 1.9-0.01 5.0 0.001-0.007 0.3-9.8 7.7 GeV Au+Au 4.0 5.9 2.0 1.2-0.01 5.0 0.001-0.03 0.4-12.3 200 GeV Cu+Cu 4.0 2.9 2.0 1.5-0.01 5.0 0.03-0.08 0.3-8.0 62.4 GeV Cu+Cu 4.0 5.0 2.0 1.0-0.01 5.0 0.02-0.01 0.3-9.2 200 GeV Cu+Au 4.0 2.9 2.0 2.6-0.05 5.0 0.001-0.07 0.9-10.1 193 GeV U+U 4.0 2.9 2.0 3.5-0.10 5.0 0.001-0.01 0.4-9.3 200 GeV d+Au 4.0 2.9 2.0 0.1-0.01 5.0 0.001-0.001 0.3-7.2 200 GeV3He+Au 4.0 2.9 2.0 0.1-0.01 5.0 0.001-0.001 0.2-6.5 200 GeV p+p 4.0 2.9 2.0 0.01 5.0 0.0015 —
Au+Au central collisions from √sN N = 200 to 7.7 GeV. There is an estimated 5% uncertainty for the tracking ef-ficiency estimate. There is a centrality-dependent uncer-tainty for background due to trigger effects and multiple interactions. Finally, there is an uncertainty for the de-termination of the trigger efficiency, which is estimated in the same manner as for the dET/dη analysis.
IV. AU+AU BEAM ENERGY SCAN RESULTS
This section will present dET/dη and dNch/dη mea-surements as a function of centrality expressed as the number of nucleon participants, Npart, from the RHIC beam energy scan that includes Au+Au collisions at √s
N N = 200, 130, 62.4, 39, 27, 19.6, 14.5, and 7.7 GeV. A Monte Carlo Glauber model calculation is used to obtain estimates of Npart as a function of centrality using the procedure outlined in Ref. [26]. At each collision energy,
part N 100 200 300 400 [GeV] [y=0] ) part ) / (0.5 N η /d T (dE 0 1 2 3 4 5 200 GeV Au+Au 130 GeV Au+Au 62.4 GeV Au+Au 39 GeV Au+Au 27 GeV Au+Au 19.6 GeV Au+Au 14.5 GeV Au+Au 7.7 GeV Au+Au (a) PHENIX part N 100 200 300 400 [y=0] ) part ) / (0.5 N η /d ch (dN 0 1 2 3 4 5 200 GeV Au+Au 130 GeV Au+Au 62.4 GeV Au+Au 39 GeV Au+Au 27 GeV Au+Au 19.6 GeV Au+Au 14.5 GeV Au+Au 7.7 GeV Au+Au (b) PHENIX
FIG. 2. (Color online) (dET/dη)/(0.5Npart) (a) and (dNch/dη)/(0.5Npart) (b) at midrapidity as a function of Npartfor Au+Au
collisions 200, 130, 62.4, 39, 27, 19.6, 14.5, and 7.7 GeV. The lines bounding the points represent the trigger efficiency uncertainty within which the points can be tilted. The error bars represent the remaining total statistical and systematic uncertainty.
part N 0 100 200 300 400 ) part /(0.5N η /dT Ratio of dE 1 2 3 4 5 6
200 GeV Au+Au / 7.7 GeV Au+Au
(a) PHENIX part N 0 100 200 300 400 ) part /(0.5N η /d ch Ratio of dN 1 2 3 4 5 6
200 GeV Au+Au / 7.7 GeV Au+Au
(b)
PHENIX
FIG. 3. The ratio of √sN N = 200 GeV Au+Au collisions to √sN N = 7.7 GeV Au+Au collisions for (dET/dη)/(0.5Npart) (a)
and for (dNch/dη)/(0.5Npart) (b). The lines bounding the points represent the trigger efficiency uncertainty within which the points can be tilted. The error bars represent the total statistical and systematic uncertainties.
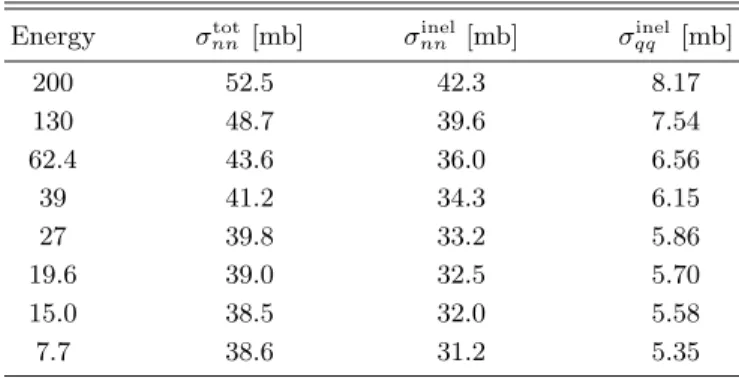
the Glauber model is run using the inelastic nucleon-nucleon cross sections, σinel
nn , listed in Table IV.
When plotting dET/dη and dNch/dη, systematic certainties are decomposed into two types. Type A un-certainties include point-to-point unun-certainties that are uncorrelated between bins and include only statistical un-certainties in this analysis. The remaining unun-certainties are classified as Type B uncertainties that are correlated bin-by-bin such that all points move in the same direc-tion, but not necessarily by the same factor. Because the magnitudes of the Type A statistical uncertainties are small compared to the magnitudes of the Type B uncer-tainties, the error bars in the plots presented below will
represent the total statistical and systematic uncertain-ties added in quadrature. The trigger efficiency uncer-tainty is represented separately by error bands bounding the points within which the points can be tilted, as de-scribed in Section III.
Examining the Npart dependence of dET/dη and dNch/dη normalized by the number of nucleon partici-pant pairs at midrapidity is useful to determine if the data scales by Npartand if the scaling changes as a func-tion of √sN N. The results for Au+Au collisions for all beam energies at midrapidity are shown in Fig. 2 as a function of Npart. For all energies, dET/dη and dNch/dη do not scale with Npart; the magnitudes of dET/dη and
[GeV] NN s 1 10 102 3 10 ) [GeV] part /(0.5 N η /d T dE -2 10 -1 10 1 10 PHENIX 0-5% Au+Au CMS 0-5% Pb+Pb STAR 0-5% Au+Au NA49 0-7% Pb+Pb E802 0-5% Au+Au FOPI 0-1% Au+Au
(a)
[GeV] NN s 1 10 102 3 10 ) part /(0.5 N η /d ch dN -1 10 1 10 PHENIX 0-5% Au+Au ALICE 0-5% Pb+Pb ATLAS 0-5% Pb+Pb PHOBOS 0-3% Au+Au STAR 0-5% Au+Au NA49 0-7% Pb+Pb E802 0-5% Au+Au FOPI 0-1% Au+Au(b)
FIG. 4. (Color online) The excitation function of (dET/dη)/(0.5Npart) (a) and (dNch/dη)/(0.5Npart) (b) for central
col-lisions at midrapidity as a function of √sN N. The error bars represent the total statistical and systematic uncertainties.
For (dET/dη)/(0.5Npart) (a), data are shown from FOPI [27], E802 [28], NA49 [29, 30], STAR [18], and CMS [30]. For
(dNch/dη)/(0.5Npart) (b), data are shown from FOPI [27], E802 [28, 31, 32], NA49 [29], STAR [18, 33], PHOBOS [17],
AL-ICE [34], and ATLAS [35].
TABLE IV. Summary of the cross sections as a function of
√s N N. Energy σtot nn [mb] σinelnn [mb] σqqinel[mb] 200 52.5 42.3 8.17 130 48.7 39.6 7.54 62.4 43.6 36.0 6.56 39 41.2 34.3 6.15 27 39.8 33.2 5.86 19.6 39.0 32.5 5.70 15.0 38.5 32.0 5.58 7.7 38.6 31.2 5.35
dNch/dη increase as Npart increases. It has been previ-ously observed that the shape of the distributions as a function of Npartare preserved in Au+Au collisions from √s
N N = 200 GeV to √sN N = 19.6 GeV [3, 23]. Figure 3a shows the ratio of (dET/dη)/(0.5Npart) from Au+Au col-lisions at √sN N = 200 GeV to √sN N = 7.7 GeV, illus-trating that the shapes of the distributions are preserved down to √sN N = 7.7 GeV. Figure 3b shows the same for (dNch/dη)/(0.5Npart). Previous measurements in fixed target h+A collisions showed that the total charged par-ticle multiplicity does scale well as a function of Npart in the range of 10 ≤√sN N ≤ 20 GeV [36]. However, this measurement was made over the full rapidity range rather than at midrapidity. For the midrapidity measure-ments presented here, the Npart scaling behavior does
not change significantly from √sN N = 200 GeV down to √s
N N = 7.7 GeV.
Excitation functions of (dET/dη)/(0.5Npart) and (dNch/dη)/(0.5Npart) are shown in Fig. 4. Shown are the PHENIX data along with results from other experi-ments. The data points for the lower energies are from estimates described in Ref. [3]. For (dET/dη)/(0.5Npart), data are shown from FOPI 0-1% centrality Au+Au collisions [27], E802 0%–5% centrality Au+Au colli-sions [28], NA49 0-7% centrality Pb+Pb collicolli-sions [29, 30], STAR 0%–5% centrality Au+Au collisions [18], and CMS 0%–5% centrality Pb+Pb collisions [30]. For (dNch/dη)/(0.5Npart), data are shown from FOPI [27], E802 [28, 31, 32], NA49 [29], STAR [18, 33], PHO-BOS 0-3% centrality Au+Au collisions [17], ALICE 0%– 5% centrality Pb+Pb collisions [34], and ATLAS [35] Pb+Pb collisions interpolated to 0%–5% centrality. The data are plotted on a log-log scale to illustrate the power law behavior of both (dET/dη)/(0.5Npart) and (dNch/dη)/(0.5Npart) as a function of log(√sN N) for √s
N N at or above 7.7 GeV. For (dET/dη)/(0.5Npart), the data between √sN N = 7.7 and 200 GeV are de-scribed by (dET/dη)/(0.5Npart)(√sN N) ∝ eb×log(
√sN N) , where b = 0.428 ± 0.021. For (dNch/dη)/(0.5Npart), the data between √sN N = 7.7 and 200 GeV are described by (dNch/dη)/(0.5Npart)(√sN N) ∝ eb×log(
√s
N N), where b = 0.374 ± 0.028. The data deviate from the power law behavior below the lowest PHENIX measurement at √s
N N = 7.7 GeV.
sim-part N 0 100 200 300 400 > [GeV] η /d ch >/<dN η /dT <dE 0.5 1 1.5
200 GeV Au+Au
(a) PHENIX part N 0 100 200 300 400 > [GeV] η /d ch >/<dN η /dT <dE 0.5 1 1.5130 GeV Au+Au
(b) PHENIX part N 0 100 200 300 400 > [GeV] η /d ch >/<dN η /dT <dE 0.5 1 1.562.4 GeV Au+Au
(c) PHENIX part N 0 100 200 300 400 > [GeV] η /d ch >/<dN η /dT <dE 0.5 1 1.539 GeV Au+Au
(d) PHENIX part N 0 100 200 300 400 > [GeV] η /d ch >/<dN η /dT <dE 0.5 1 1.527 GeV Au+Au
(e) PHENIX part N 0 100 200 300 400 > [GeV] η /d ch >/<dN η /dT <dE 0.5 1 1.519.6 GeV Au+Au
(f) PHENIX part N 0 100 200 300 400 > [GeV] η /d ch >/<dN η /dT <dE 0.5 1 1.514.5 GeV Au+Au
(g) PHENIX part N 0 100 200 300 400 > [GeV] η /d ch >/<dN η /dT <dE 0.5 1 1.57.7 GeV Au+Au
(h) PHENIXFIG. 5. The ET/Nch ratio as a function of Npart for Au+Au collisions at varying values of √sN N. The lines bounding the
points represent the trigger efficiency uncertainty within which the points can be tilted. The error bars represent the total statistical and systematic uncertainties.
[GeV] NN s 1 10 102 103 > [GeV] η /d ch >/<dN η /d T <dE 0 0.5 1 1.5 PHENIX 0-5% Au+Au LHC 0-5% Pb+Pb STAR 0-5% Au+Au NA49 0-7% Pb+Pb E802 0-5% Au+Au FOPI 0-1% Au+Au
FIG. 6. (Color online) The ET/Nch ratio as a function of
√s
N N for central Au+Au collisions and Pb+Pb collisions at
midrapidity. The error bars represent the total statistical and systematic uncertainties. The Large-Hadron-Collider, LHC, data point has been obtained by taking the ratio of the CMS
dET/dη data [30] with the average of the ALICE [34] and
ATLAS [35] data. For (dET/dη)/(0.5Npart), data are taken
from FOPI [27], E802 [28], NA49 [29, 30], STAR [18], and CMS [30]. For (dNch/dη)/(0.5Npart), data are taken from FOPI [27], E802 [28, 31, 32], NA49 [29], STAR [18, 33], PHO-BOS [17], ALICE [34], and ATLAS [35].
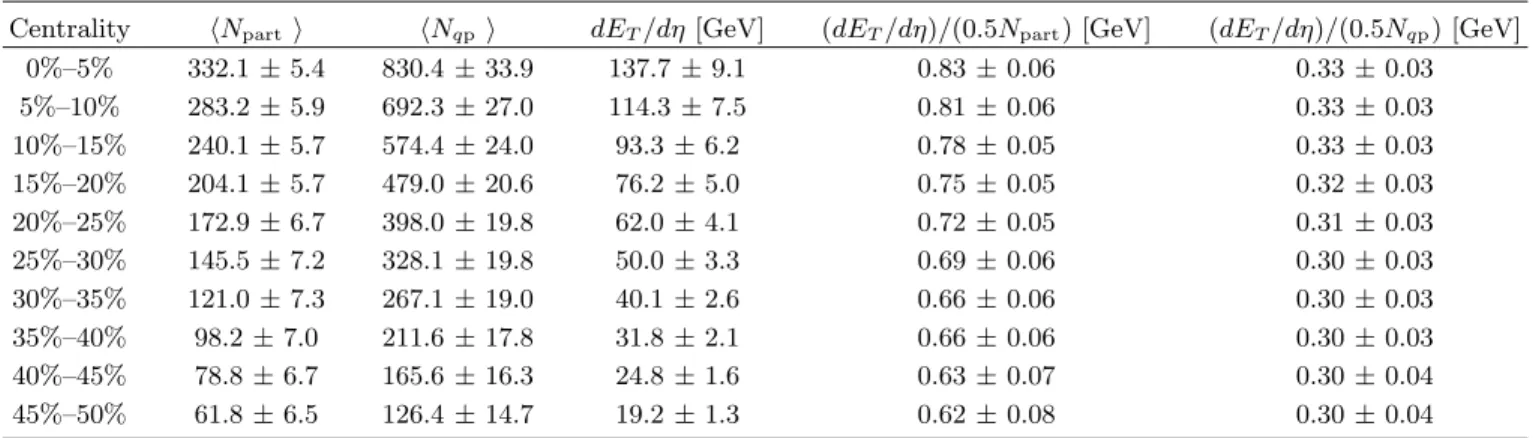
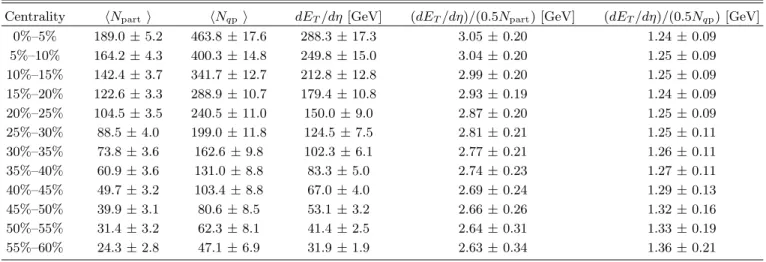
ply as ET/Nch, is a variable that is related to the av-erage transverse mass of the produced particles [3]. In previous measurements, this ratio has been observed to be independent of centrality and independent of √sN N in Au+Au collisions from √sN N = 200 to 19.6 GeV [3]. Figure 5 plots the ET/Nch ratio as a function of Npart for Au+Au collisions at various values of √sN N. For all cases, the ratio is constant with Npartwithin the system-atic uncertainties. The excitation function of ET/Nch is shown in Fig. 6. Here, the Large-Hadron-Collider point has been obtained by taking the ratio of the CMS dET/dη data [30] with the average of the ALICE [34] and ATLAS [35] data. The ratio increases below √sN N ≈ 10 GeV, levels off, and then increases at √sN N = 200 GeV.
The energy density per unit volume in nuclear colli-sions can be estimated from the energy density per unit rapidity [37]. The Bjorken energy density can be calcu-lated as follows:
εBJ = 1
A⊥τJ(y, η) dET
dη (2)
where A⊥ is the transverse overlap area of the nuclei determined from the Glauber model, τ is the formation time, and J(y, η) is the Jacobian factor for converting pseudorapidity to rapidity.
The Jacobian factor depends on the momentum distri-butions of the produced particles, which are dependent on the beam energy. The Jacobian factor for each beam energy in the PHENIX acceptance has been estimated us-ing the URQMD event generator, which well reproduces measured particle spectra over the RHIC beam energy range and, unlike HIJING, is valid at √sN N = 7.7 GeV. Calculations of the Jacobian factor using URQMD are consistent with previous calculations using the HIJING event generator [3]. There is an estimated uncertainty of 3% for this calculation for all beam energies. The values of the Jacobian factors are summarized in Table V.
TABLE V. Summary of the Jacobian scale factor estimated for each beam energy.
Dataset J(y,η) 200 GeV Au+Au 1.25 130 GeV Au+Au 1.25 62.4 GeV Au+Au 1.25 39 GeV Au+Au 1.27 27 GeV Au+Au 1.27 19.6 GeV Au+Au 1.28 14.5 GeV Au+Au 1.30 7.7 GeV Au+Au 1.35
The transverse overlap area is estimated using the a Monte Carlo Glauber model as A⊥∼ σxσy, where σxand σy are the widths of the x and y position distributions of the participating nucleons in the transverse plane. A normalization to πR2, where R is the sum of the rnradius and a surface diffuseness parameters of the Woods-Saxon parametrization
ρ(r) = 1/(1 + e(r−rn)/a), (3) of the nuclear density profile, ρ(r), was applied for the most central collisions at impact parameter b = 0.
A compilation of the Bjorken energy density multiplied by τ for Au+Au collisions at various collision energies is shown in Fig. 7. The value of εBJ increases with increas-ing √sN N and also with increasing Npart. The value of εBJ for the most central Au+Au collisions at √sN N = 7.7 GeV is 1.36 ± 0.14, which is still above the value of 1.0 for a formation time of 1 fm/c that had been the pro-posed value above which the Quark-Gluon Plasma can be formed in Bjorken’s original paper [37]. It is also above the result of 0.7 ± 0.3 GeV/fm3 for the critical energy density obtained from lattice QCD calculations [38, 39]. The excitation function of εBJ multiplied by τ is shown in Fig. 8. The results are shown on a log-log scale to illus-trate that εBJfollows a power law behavior from √sN N = 7.7 GeV up to √sN N = 2760 GeV, εBJτ ∝ eb×log(
√sN N) , where b = 0.422 ± 0.035.
part N 100 200 300 400 c)] 2 [GeV/(fm τ BJ ε 0 2 4
6 200 GeV Au+Au130 GeV Au+Au
62.4 GeV Au+Au 39 GeV Au+Au 27 GeV Au+Au 19.6 GeV Au+Au 14.5 GeV Au+Au 7.7 GeV Au+Au PHENIX
FIG. 7. (Color online) The Bjorken energy density, εBJ,
mul-tiplied by τ as a function of Npart for Au+Au collisions at
varying values of √sN N. The error bars represent the total
statistical and systematic uncertainties.
[GeV] NN s 10 102 3 10 c)] 2 [GeV/(fm τ BJ ε 1 10 PHENIX 0-5% Au+Au CMS 0-5% Pb+Pb
FIG. 8. (Color online) The Bjorken energy density, εBJ,
multiplied by τ as a function of √sN N for central Au+Au
(PHENIX) and Pb+Pb (CMS) [30] collisions at midrapidity. The error bars represent the total statistical and systematic uncertainties. part N 0 100 200 300 400 [GeV] [y=0] ) part ) / (0.5 N η /d T (dE 0 1 2 3 4 5 200 GeV Au+Au 200 GeV Cu+Au 200 GeV Cu+Cu 62.4 GeV Cu+Cu (a) PHENIX part N 0 100 200 300 400 [y=0] ) part ) / (0.5 N η /d ch (dN 0 1 2 3 4 5 200 GeV Au+Au 200 GeV Cu+Au 200 GeV Cu+Cu 62.4 GeV Cu+Cu (b) PHENIX
FIG. 9. (Color online) (dET/dη)/(0.5Npart) (a) and (dNch/dη)/(0.5Npart) (b) at midrapidity as a function of
Npart for Cu+Cu and Cu+Au collisions. Also shown are results from Au+Au collisions at √sN N = 200 GeV for
comparison. The lines bounding the points represent the trigger efficiency uncertainty within which the points can be tilted. The error bars represent the remaining total statistical and systematic uncertainty.
V. RESULTS FOR CU+AU AND CU+CU
COLLISIONS
Measurements of dNch/dη in systems lighter than Au have been published by PHOBOS for 200 GeV and 62.4 GeV Cu+Cu collisions [17], showing that the Cu+Cu dNch/dη distribution as a function of Npart
ex-hibits similar features when compared to Au+Au colli-sions. Here, those measurements are extended to include measurements of dET/dη and the addition of measure-ments from the asymmetric Cu+Au system at √sN N = 200 GeV.
Figure 9 shows (dET/dη)/(0.5Npart) and
part N 0 50 100 150 200 > [GeV] η /d ch >/<dN η /dT <dE 0.5 1 1.5
200 GeV Cu+Au
(a) PHENIX part N 0 50 100 > [GeV] η /d ch >/<dN η /dT <dE 0.5 1 1.5200 GeV Cu+Cu
(b) PHENIX part N 0 50 100 > [GeV] η /d ch >/<dN η /dT <dE 0.5 1 1.562.4 GeV Cu+Cu
(c) PHENIXFIG. 10. The ET/Nchratio as a function of Npartfor Cu+Au
collisions at √sN N= 200 GeV (a), Cu+Cu collisions at √sN N
= 200 GeV (b), and Cu+Cu collisions at √sN N = 62.4 GeV
(c). The lines bounding the points represent the trigger ef-ficiency uncertainty within which the points can be tilted. The error bars represent the total statistical and systematic uncertainties. part N 100 200 300 400 c)] 2 [GeV/(fm τ BJ ε 0 2 4 6 200 GeV Cu+Au 200 GeV Cu+Cu 62.4 GeV Cu+Cu 200 GeV Au+Au 62.4 GeV Au+Au PHENIX
FIG. 11. (Color online) The Bjorken energy density, εBJ,
multiplied by τ as a function of Npart for Cu+Cu, Cu+Au,
and Au+Au collisions. The error bars represent the total statistical and systematic uncertainties.
of Npart for Cu+Cu and Cu+Au collisions. Also shown for comparison are the data for Au+Au col-lisions at √sN N = 200 GeV. Both plots exhibit the trend established in Au+Au collisions of increasing (dET/dη)/(0.5Npart) and (dNch/dη)/(0.5Npart) with
increasing Npart and increasing √sN N. The Cu+Cu and Cu+Au distributions at √sN N = 200 GeV are consistent with each other within the uncertainties of the measurement. All of the species (Au+Au, Cu+Au, and Cu+Cu) at √sN N = 200 GeV are consistent with