HAL Id: hal-01140241
https://hal.archives-ouvertes.fr/hal-01140241
Submitted on 9 Apr 2015
HAL is a multi-disciplinary open access
archive for the deposit and dissemination of
sci-entific research documents, whether they are
pub-lished or not. The documents may come from
teaching and research institutions in France or
abroad, or from public or private research centers.
L’archive ouverte pluridisciplinaire HAL, est
destinée au dépôt et à la diffusion de documents
scientifiques de niveau recherche, publiés ou non,
émanant des établissements d’enseignement et de
recherche français ou étrangers, des laboratoires
publics ou privés.
Abed El Rahman Hassoun, Véronique Guglielmi, Elissar Gemayel, Catherine
Goyet, Marie Abboud-Abi Saab, Michele Giani, Patrizia Ziveri, Gianmarco
Ingrosso, Franck Touratier
To cite this version:
Abed El Rahman Hassoun, Véronique Guglielmi, Elissar Gemayel, Catherine Goyet, Marie
Abboud-Abi Saab, et al.. Is the Mediterranean Sea Circulation in a Steady State. Journal of Water Resources
and Ocean Science, Science Publishing Group, 2015, pp.6-17. �10.11648/j.wros.20150401.12�.
�hal-01140241�
Published online February 9, 2015 (http://www.sciencepublishinggroup.com/j/wros) doi: 10.11648/j.wros.20150401.12
ISSN: 2328-7969 (Print); ISSN: 2328-7993 (Online)
Is the Mediterranean Sea Circulation in a Steady State
Abed El Rahman Hassoun
1, 2, 3, *, Véronique Guglielmi
2, 3, Elissar Gemayel
1, 2, 3, Catherine Goyet
2, 3,
Marie Abboud-Abi Saab
1, Michele Giani
4, Patrizia Ziveri
5, Gianmarco Ingrosso
4,
Franck Touratier
2, 31
National Council for Scientific Research, National Center for Marine Sciences, Batroun, Lebanon
2
IMAGES_ESPACE-DEV, Université de Perpignan Via Domitia, Perpignan Cedex, France
3
ESPACE-DEV, UG UA UR UM IRD, Maison de la télédétection, Montpellier Cedex, France
4
OGS (Istituto Nazionale di Oceanografia e di Geofisica Sperimentale), Oceanography Section, Via A. Piccard, Trieste, Italy
5
ICREA - Institute of Environmental Science and Technology (ICTA), Universitat Autònoma de Barcelona, Ed. Z, ICTA-ICP, Carrer de les columnes, E- 08193 Bellaterra, Barcelona, Spain
Email address:
[email protected] (A. E. R. Hassoun), [email protected] (V. Guglielmi), [email protected] (E. Gemayel), [email protected] (C. Goyet), [email protected] (M. Abboud-Abi Saab), [email protected] (M. Giani),
[email protected] (P. Ziveri), [email protected] (G. Ingrosso), [email protected] (F. Touratier)
To cite this article:
Abed El Rahman Hassoun, Véronique Guglielmi, Elissar Gemayel, Catherine Goyet, Marie Abboud-Abi Saab, Michele Giani, Patrizia Ziveri, Gianmarco Ingrosso, Franck Touratier. Is the Mediterranean Sea Circulation in a Steady State. Journal of Water Resources and Ocean Science. Vol. 4, No. 1, 2015, pp. 6-17. doi: 10.11648/j.wros.20150401.12
Abstract:
Most global ocean models are based on the assumption of a “steady state” ocean. Here, we investigate the validation of this hypothesis for the anthropized Mediterranean Sea. In order to do so, we calculated the mixing coefficients of the water masses detected in this sea via an optimum multiparameter analysis referred to as the MIX approach, using data from the BOUM (2008) and MedSeA (2013) cruises. The comparison of the mixing coefficients of each water mass, between 2008 and 2013, indicates that some of their proportions have significantly changed. Surface water mass proportions did not change significantly (∆ 0.05-0.1), while intermediate and deep water mass mixing coefficients of both Eastern and Western basins were significantly modified (~∆ 0.35). This study clearly shows that the Mediterranean seawater is not in a “steady state”.Keywords:
Mixing Coefficient, MIX Approach, Water Masses, Seawater Circulation, Mediterranean Sea, Climate Change1. Introduction
The Mediterranean Sea is a mid-latitude semi-enclosed sea. It witnesses two well-defined seasons, wet-cold winter and dry-warm summer, with short period of transition between them [1] [2]. An excess of evaporation over precipitation can be quantified by calculating the annual mean budget “evaporation minus precipitation” (E-P) over the whole Mediterranean Sea (350-750 mm yr-1) [1]. Thus, Atlantic Water (AW) inflows at the surface and Mediterranean Water outflows along the bottom. The Atlantic water entering into Gibraltar in the surface layer, after travelling to the easternmost Levantine Sub-basin, is transformed into one of the saltiest seawater masses through air-sea heat and moisture fluxes. This relatively cold and salty water, which crosses the entire Mediterranean Sea in the opposite direction of the surface Atlantic Water, finally exits from the Strait of Gibraltar at the mid-depths. In wintertime, a significant
negative heat budget [1] [3] causes a buoyancy loss, initiating deep and/or intermediate dense water formation. These events are frequent over the shelf areas and in the offshore regions, both in the Western and the Eastern basins [4] [5]. The Mediterranean Sea also exchanges water with the Black Sea through the Turkish Strait System (the Dardanelles, the Marmara Sea and the Bosphorus Strait) and receives significant amounts of freshwater from river discharge. In addition, this sea is always provided by groundwater discharges and sewage, which are likely, an important source of freshwater, nutrients, trace metals, alkalinity and other elements to the Mediterranean System [6] [7]. The Mediterranean Sea is composed mainly of two nearly equal size basins, the Western and the Eastern ones, connected by the relatively shallow Strait of Sicily (sill depth ~ 500 m). In each basin a number of sub-basins are characterized by different water masses circulations, chemical and biological features and rough bottom topography. Note that we reserve
the term ‘‘sea’’ for the Mediterranean Sea and ‘‘basin’’ for the Eastern and Western parts of it; any smaller entity is a sub-basin.
The Mediterranean Sea is a particular system, characterized by a complex thermohaline, wind, and water flux-driven multi-scale circulation with interactive variability [8]. This land-locked sea is exporting warm and salty intermediate waters to the North Atlantic Ocean by the narrow and shallow Strait of Gibraltar [width ~ 13 km ; sill depth ~ 300 m] affecting the global thermohaline conveyor belt [9] [10]. Through pathways to the Atlantic Polar regions or through indirect mixing processes, the salty Mediterranean water preconditions the deep convection cells of the Polar Atlantic. There the North Atlantic Deep Water is formed and successively spreads throughout the world ocean constituting the core of the global thermohaline circulation [11] [12]. Thus, the salty water of Mediterranean origin may affect water formation processes and variability and even the stability of the global thermohaline equilibrium state. Hence, the study of the Mediterranean water masses (their formation, spreading, mixing, and impact on general circulation) is essential for a better understanding of the ocean circulation and variability. Moreover, the existence of a thermohaline cell (the Eastern Mediterranean “Conveyor Belt”), multiple scales of motion defining the general circulation (basin/sub-basin/mesoscale), and deep water mass formation processes, make this sea a “test basin” for general circulation studies.
Aiming to study the hydrographic situation in the Mediterranean Sea, many researchers have used an optimum multiparameter analysis ([13] in the Adriatic Sub-basin, and [14] in the Eastern Mediterranean Sub-basin; [15] in the Western Mediterranean Sub-basin; [16] in the entire Mediterranean Sea). However, a study of the evolution of water mass mixing coefficients in this semi-enclosed sea is needed to better understand the hydrographic system in this sea.
Reference [17] introduced the MIX approach based upon an optimum multiparameter mixing analysis. The use of this approach is particularly recommended for regional studies where the distribution of water masses can be clearly defined (this is the case of the Mediterranean Sea). In the present paper, our main objective is to evaluate the variation (if any) of the water mass circulation in the Mediterranean Sea based on their mixing coefficients calculated via the MIX approach using data collected in 2008 and 2013.
2. Methodology
2.1. Study Area
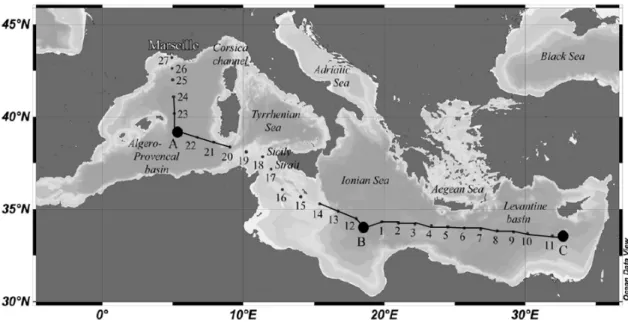
The BOUM cruise (Biogeochemistry from the Oligotrophic to the Ultra oligotrophic Mediterranean Sea [18]) was conducted during summer 2008, from 20 June to 22 July, on board the R/V L’Atalante [19]. It consists of a longitudinal transect (more than 3000 km long from the Levantine Sub-basin to the Northwestern Mediterranean Sea) of 27 short-term stations and 3 long-term stations referred as A, B, and C (Fig.1).
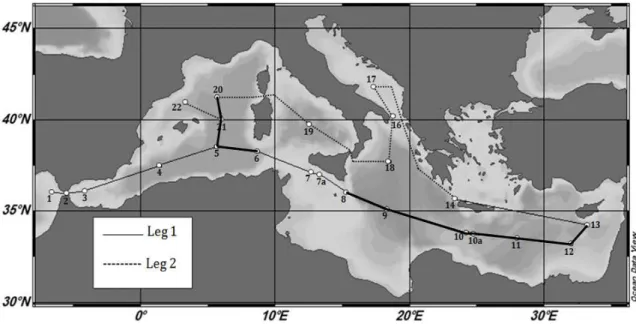
The MedSeA (Mediterranean Sea Acidification in a Changing Climate; [20] [21]) cruise occurred during spring 2013, on board of the Spanish R/V Angeles Alvariño, from 2 May to 2 June. The full cruise track (more than 8000 km long) consisted of two longitudinal legs where 23 stations along the Mediterranean Sea were sampled throughout the water column. During the first leg, samples were collected from Atlantic waters off Cadiz, Spain to the Levantine Sub-basin in the Eastern Mediterranean basin (3879 km long, 15 stations, 279 sampled points, maximum sampled depth = 3720 m). The second leg was conducted in the Northern part of the Mediterranean from Heraklion, Crete, Greece in the Eastern Mediterranean basin to Barcelona, Spain in the North Western Mediterranean basin (3232.5 km long, 8 stations, 183 sampled points, maximum sampled depth = 3000 m ; Fig.2).
Figure 1. Map of the 2008 BOUM cruise in the Mediterranean Sea. Short-term stations are indicated by numbers (from 1 to 27); the three long-term stations are referred as A, B, and C (Touratier et al., 2012). The thick black lines referred to the sections used in this study.
Figure 2. Map of the 2013 MedSeA cruise in the Mediterranean Sea. The numbers from 1 to 22 correspond to the sampled stations. The thick black lines referred to the sections used in this study.
2.2. Sampling and Measurements
In the present study, we use the following properties: potential temperature (θ ; °C), salinity (S), dissolved oxygen (O2 ; µmol kg−1), nitrates (NO3 ; µmol kg−1), and phosphates
(PO4 ; µmol kg−1).
For the 2008 BOUM cruise, the profiles for θ, S, and O2 were
obtained using a Sea-Bird Electronics 911 PLUS CTD system. Each CTD cast was associated with a carousel of 24 Niskin bottles to collect seawater samples used to perform the analysis of the other chemical and biological properties. Concerning the nutrients (NO3 and PO4), the description of the methods used
for the analysis are explained by [22] and [23].
For the 2013 MedSeA cruise, hydrologic properties [S and T (ºC)] were measured in situ using a Sea-Bird Electronics CTD system (SBE 911plus) associated with a General Oceanic rosette sampler, equipped with twenty four 12 L Niskin bottles. The precision of measurements is ± 0.001 ºC for T and ± 0.0003 for S. Water samples for dissolved oxygen determination were collected in calibrated BOD 60 ml bottles. Oxygen concentrations were measured using a Winkler iodometric titration [24] with a Mettler-Toledo. DL-21 potentiometric titrator with a Pt ring redox electrode for the determination of the equivalence point [25]. The analytical precision and accuracy are ± 1.5 µmol kg-1. For the nitrates (NO3) and phosphates (PO4), water samples were pre-filtered
over glass fiber filters (Whatman GF/F) with a pore size of 0.7 microns, immediately after sampling. Then, they were stored at -20°C in polyethylene bottles until their analysis. The samples were thawed and analyzed colorimetrically with a Bran + Luebbe 3 autoanalyzer according to [26], at OGS laboratory in Trieste, Italy.
2.3. Modeling: The MIX Approach
Aiming to quantify the contribution of the different water sources to the collected data, we used the MIX approach
developed by [17]. This approach uses a multi-parameter analysis. Optimum multiparameter methods [27] [28] are based on the assumption that observed water properties at a hydrographic station are the result of mixing among two or more ‘‘source waters’’. They have been used to evaluate water mass properties in both the Southern Ocean [29] [30] and other regions [28] [31].
In the present study, four conservative tracers (S, θ, NO, and PO) are used in the MIX approach. Reference [32] defined the conservative tracers NO and PO as follows:
NO = O2 + RONNO3 (1)
PO = O2 + ROPPO4 (2)
where NO and PO are composite tracers of the non conservative tracers O2 (dissolved oxygen concentration in
µmol kg-1) and NO3 (nitrate concentration in µmol kg-1), and
PO4 (phosphate concentration in µmol kg-1), respectively.
According to the equation of [33] which describes the average photosynthesis and aerobic respiration in the interior of the ocean, the composite tracers NO and PO were built using the fact that the consumption of oxygen is balanced by the production of nutrients during the processes of respiration and decomposition. The two constants RON and ROP are the ratios
of the stoechiometric coefficients (ѱ) involved in the Redfield equation (RON = ѱO2/ѱNO3; ROP = ѱO2/ѱPO4).
The general conservation equation for a conservative tracer (Ω) is given by :
(3)
where Kj represents the contribution (also called “mixing
coefficient”) of a water source j, n is the number of water sources in the system, and Ωj is the value of the conservative
For each seawater sample, where the conservative tracers Ω are either measured (S and θ) or calculated (NO and PO ; see equations 1 and 2), the contributions Kj are estimated after
resolving the system of equations with the following constraints :
(mass conservation) (4)
∀j, 0 ≤ Kj ≤ 1 (5)
It is a constrained linear least-squares problem, with one equality constraint and n inequality constraints. To solve it, we use a medium-scale optimization algorithm (with MATLAB) similar to that described by [34]. The difference in range between tracers leads to an ill-conditioned problem: the linear equation solution involves the inversion of the matrix containing the water sources characteristics, but this matrix is really badly scaled. So, prior to the inversion, rows and columns of the matrix are normalized.
The stability of the results (linked to the correct placement of sources) is then tested by adding thirty perturbations to the values of Ω and the Ωj which provide at each point a mean
solution for each Kj [17]. These perturbations are independent
Gaussian random variables with zero mean and given standard deviation. We entered the standard deviations for each tracer with a given value for the measurement points and another (larger) value for sources. These thirty Gaussian perturbations allowed us not only to test the stability of the results but also to take into account the differences between the errors of measurement based on the tracers.
2.4. Determination of the Water Sources
The Appropriate definition of water source properties is crucial to achieving physically meaningful results from the MIX approach. The different water sources j were typically identified using the conservative tracers S and θ, their corresponding θ/S diagrams (Fig. 3 and 6) and referring to the literature. In order to lower the number of water sources, the Mediterranean Sea was tested as two independent systems : the Western basin (5° E ≤ longitude ≤ 9.5°E) and the Eastern basin (longitude ≥ 15°E). Consequently, the relatively shallow stations located in the Sicily Strait between 9.5°E and 15°E were ignored when the MIX approach was applied.
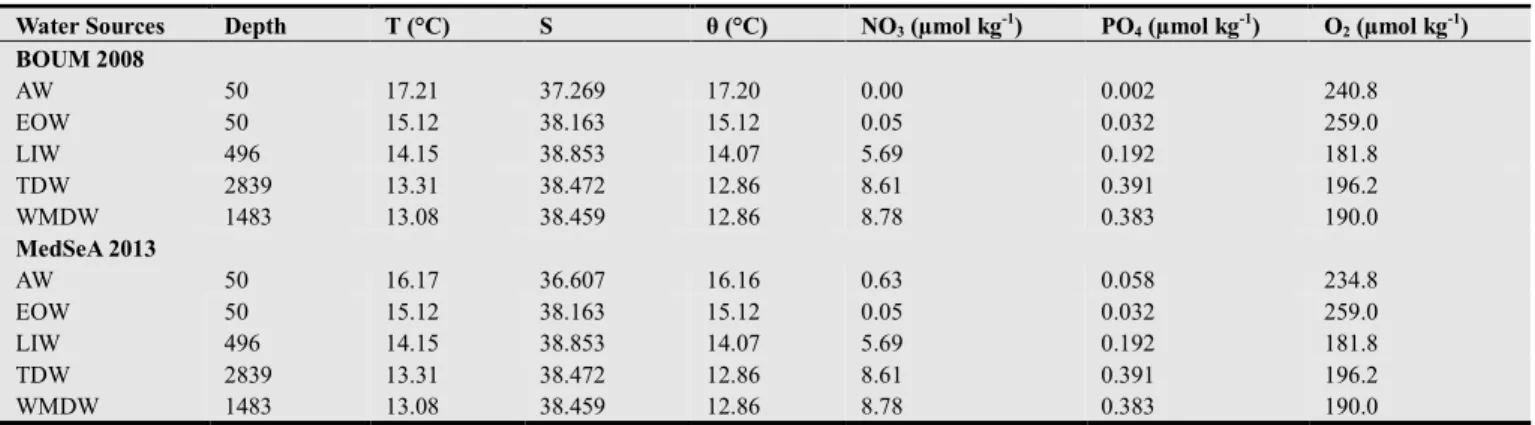
Table 1. Physical and chemical properties of water sources used by the MIX approach in the Western Mediterranean basin for BOUM 2008 and MedSeA 2013.
Water Sources Depth T (°C) S θ (°C) NO3 (µmol kg-1) PO4 (µmol kg-1) O2 (µmol kg-1)
BOUM 2008 AW 50 17.21 37.269 17.20 0.00 0.002 240.8 EOW 50 15.12 38.163 15.12 0.05 0.032 259.0 LIW 496 14.15 38.853 14.07 5.69 0.192 181.8 TDW 2839 13.31 38.472 12.86 8.61 0.391 196.2 WMDW 1483 13.08 38.459 12.86 8.78 0.383 190.0 MedSeA 2013 AW 50 16.17 36.607 16.16 0.63 0.058 234.8 EOW 50 15.12 38.163 15.12 0.05 0.032 259.0 LIW 496 14.15 38.853 14.07 5.69 0.192 181.8 TDW 2839 13.31 38.472 12.86 8.61 0.391 196.2 WMDW 1483 13.08 38.459 12.86 8.78 0.383 190.0
AW, Atlantic Water;
EOW, Effluent Outflow Water; LIW, Levantine Intermediate Water; TDW, Tyrrhenian Deep Water;
WMDW, Western Mediterranean Deep Water.
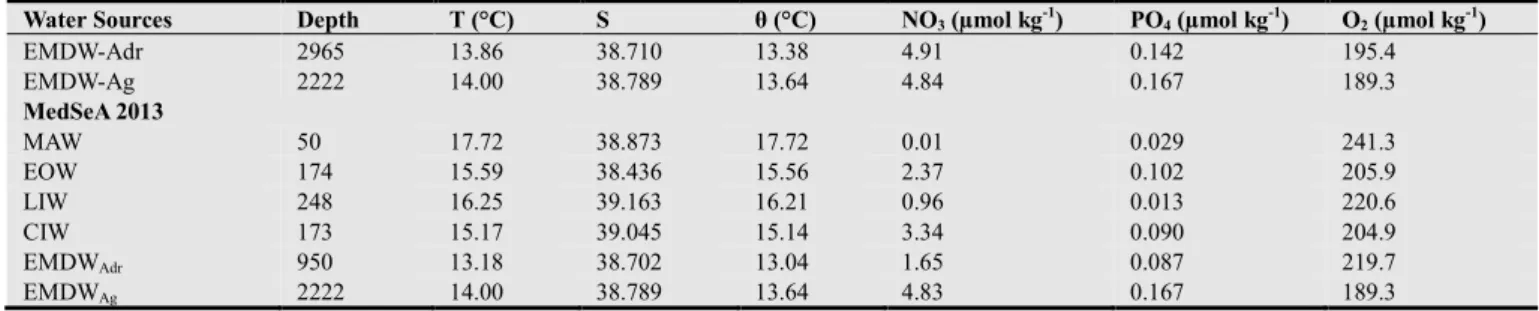
For the Western basin, we used five water sources (n = 5). Whereas, six ones were used for the Eastern basin (n = 6). The physical and chemical properties of these water sources, for both BOUM 2008 and MedSeA 2013 cruises, are shown in Tables 1 and 2 for the Western and the Eastern Mediterranean basins respectively. These water sources were identified based on the data of the two cruises and on the availability of the input parameters (S, θ, O2, NO3, PO4) manipulated by MIX
approach to calculate the mixing coefficients. The main water
sources are indicated on the corresponding θ/S diagrams of the Western and Eastern basins (Fig. 3 and 6). When the water sources of the MedSeA cruise have similar θ/S characteristics compared to the BOUM ones, we decided to take into consideration the characteristics of the BOUM water masses in our mixing coefficients calculation to maintain the same ratios previously calculated for the Mediterranean Sea based on the 2008 BOUM cruise.
Table 2. Physical and chemical properties of water sources used by the MIX approach in the Eastern Mediterranean basin for BOUM 2008 and MedSeA 2013.
Water Sources Depth T (°C) S θ (°C) NO3 (µmol kg-1) PO4 (µmol kg-1) O2 (µmol kg-1)
BOUM 2008
MAW 73 15.73 37.618 15.72 0.00 0.001 239.7
EOW 174 15.59 38.436 15.56 2.37 0.102 205.9
LIW 248 16.25 39.163 16.21 0.96 0.013 220.6
Water Sources Depth T (°C) S θ (°C) NO3 (µmol kg-1) PO4 (µmol kg-1) O2 (µmol kg-1) EMDW-Adr 2965 13.86 38.710 13.38 4.91 0.142 195.4 EMDW-Ag 2222 14.00 38.789 13.64 4.84 0.167 189.3 MedSeA 2013 MAW 50 17.72 38.873 17.72 0.01 0.029 241.3 EOW 174 15.59 38.436 15.56 2.37 0.102 205.9 LIW 248 16.25 39.163 16.21 0.96 0.013 220.6 CIW 173 15.17 39.045 15.14 3.34 0.090 204.9 EMDWAdr 950 13.18 38.702 13.04 1.65 0.087 219.7 EMDWAg 2222 14.00 38.789 13.64 4.83 0.167 189.3
MAW, Modified Atlantic Water ; EOW, Effluent Outflow Water ; LIW, Levantine Intermediate Water ; CIW, Cretan Intermediate Water ;
EMDWAdr, Eastern Mediterranean Water-Adriatic origin ; EMDWAg, Eastern Mediterranean Deep Water-Aegean origin.
2.5. Determination of the Redfield Ratios RON and ROP
Typical values given by [33] are RON = 8.6 and ROP = 138
(molar ratios). However, these ratios cannot be representative for the Mediterranean waters since [33] never used observations from this region. In this paper, we use the RON
and ROP ratios previously estimated, specifically for the
Mediterranean Sea by [35] using the 2008 BOUM database. The best results for the regressions between the nutrients and O2 were obtained after considering two different layers for
both the Western and the Eastern basins : the surface/intermediate layer (from 50 up to 750 m), and the deep layer (from 750 m to the bottom). We hypothesize that these layers are related to the traditional Mediterranean circulation scheme which is described by two cells [36] : the well ventilated surface cell which contains water masses like MAW, WIW, and LIW ; and the deep cells which contains the WMDW and TDW in the Western basin, and the EMDWAdr
and EMDWAg in the Eastern basin.
3. Results and Discussion
In order to assess the goodness of the solutions and to check possible errors due to the water-source description and to uncertainties associated with the measurements, the residual vector was calculated for each of the four conservative tracers. This vector corresponds to the
difference between the predicted and the measured data. For BOUM 2008 and MedSeA 2013, the MIX method performs well, producing unbiased small residuals (always less than 10%) for all measures.
Hereafter, we discuss the evolution of the main water sources mixing coefficients for the Western and Eastern Mediterranean basins.
3.1. Western Basin 3.1.1. Atlantic Water, AW
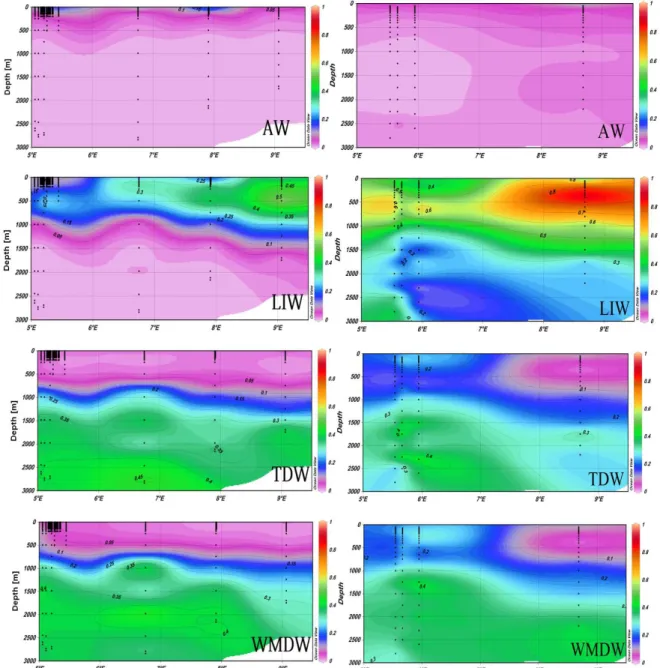
The mixing coefficients of the surface water masses did not change significantly since 2008 till 2013 (Fig.5). The Mediterranean Sea has an active water exchange with the Northern Atlantic through the Strait of Gibraltar. The surface Atlantic flow entering the Mediterranean Sea does not only fill the water deficit of 1 m per year, but it also replaces the Mediterranean deep outflow, which represents a loss of 20 m of water per year for the whole Mediterranean Sea [37]. As a consequence of the excess of evaporation over precipitation (~ 0.62 – 1.16 m year-1) [38], heating and various physical phenomena (gyres, eddies,...), the proportion of the AW decreases progressively because its characteristics change while propagating Eastward to be referred as Modified Atlantic Water (MAW). This trend was comparable during the two oceanographic surveys (BOUM 2008 and MedSeA 2013).
Figure 3. θ/S diagram illustrating the main water masses detected in the Western basin during the MedSeA cruise in May 2013 (AW: Atlantic Water, LIW: Levantine Intermediate Water, TDW: Tyrrhenian Deep Water, WMDW: Western Mediterranean Deep Water).
3.1.2. Levantine Intermediate Water, LIW
The amount of this water mass has increased during the study period (2008-2013). For example, its proportion increased from 0.55 in 2008 to 0.9 in 2013 within the intermediate layers (~ 300 m) of the Sardinia Strait (Fig.5). The LIW contributes predominately to the non-returning efflux, mixed with both EMDW and WMDW in the Strait of Gibraltar, and to the outflow into the Atlantic Ocean [2] [8]
[39]. Our results show recent changes in the Mediterranean outflow. These increasing proportions could be caused by the excessive evaporation and the decrease in precipitation and freshwater supplies to the Eastern Mediterranean Sea [40] which can be direct consequences of the unequivocal global warming [41]. Decreasing trends of river discharges in the Eastern Mediterranean Sea [42] has been observed, as in the Adriatic Sub-basin [43].
Figure 4. θ/S diagram illustrating the main water masses detected in the Eastern basin during the MedSeA cruise in May 2013 (MAW: Modified Atlantic Water, LIW: Levantine Intermediate Water, CIW: Cretan Intermediate Water, EMDW-Ag: Eastern Mediterranean Deep Water originated from the Aegean Sub-basin, EMDW-Adr: Eastern Mediterranean Deep Water originated from the Adriatic Sub-basin).
3.1.3. Tyrrhenian Deep Water, TDW
The proportion of this water mass has clearly decreased below 1000 m in the Western basin. Its amount during 2013 become less abundant in the Southern sub-basins compared to the one recorded for 2008 (Fig.5). This water, which is a product of the mixing between Eastern (LIW and EMDW) and western waters (WMDW), fills the Tyrrhenian Sub-basin down to the bottom [44]. Thus, this decrease could be attributed to the modification in the EMDW formation, since the Adriatic Sub-basin seems to retrieve its role as a main contributor in the deep water mass formation in the Eastern basin instead of the Aegean during the EMT (Eastern Mediterranean Transient ; data of the MedSeA cruise 2013). However, [45] argue that the TDW might result from a dense water formation process occurring within the Tyrrhenian itself, in the East of the Bonifacio Strait. This means that the decrease in the mixing proportion could also be attributed to climatic changes affecting temperature and salinity, thus the deep water formation.
Nevertheless, the mixing coefficients proportions of the TDW have slightly increased from 0.05 in 2008 to 0.2 in 2013, exclusively in the North of the Western basin between 0 and 500 m. This fact could be firstly related to the harsh winter convective mixing in this wind-driven area [46]. Secondly, this smooth proportions increase could be also connected to
the mixing caused by heavy freshwater inputs from the Northern rivers during May (time of the snow melting) [47].
3.1.4. Western Mediterranean Deep Water, WMDW
The mixing coefficients schemes of this water mass (Fig.5) show that its amount decreased slightly below 1000 m, between 2008 and 2013, particularly in the South of the Western basin. The WMDW remains well distributed in the Western basin with higher proportions in the North of this basin, where it is originated (Fig.5). The observed decrease could be due to the significant warming and salinification, widely mentioned in the literature [48] [49] [50] [51] [52]. However, at a station in the south of the Tyrrhenian Sub-basin sampled in September 1999 during the PROSOPE cruise [53], the total alkalinity in deep water was higher than in deep water at the Dyfamed site [54]. If it is confirmed that the Tyrrhenian deep water contributes to the deep water in the Liguro-Provençal Sub-basin, this observation could explain the modifications in the WMDW proportions which could also be attributed to the changes in the TDW linked to the Eastern deep water formation. Based on 23 years eddy-permitting reanalysis, [55] argued that the largest water mass formation event of the past 23 years occurred in the Western Mediterranean basin in 2005-2006. This event was presumably preconditioned by the EMT which modified the characteristics of the LIW crossing the Sicily Strait.
Figure 5. Profiles of the mixing coefficients of water masses in the Western Mediterranean basin during the 2013 MedSeA cruise (right column) and the 2008 BOUM cruise (left column
3.2. Eastern Basin
However, similarly to the TDW, a slight rise of the mixing coefficients has been registered within the layer above 1000 m in the Northern part of the Western basin. This boost could
also be attached to the vertical mixing related to the tough meteorological winter conditions in the Gulf of Lions, as well as in Balearic and Liguro-Provençal Sub-basins [46] [56].
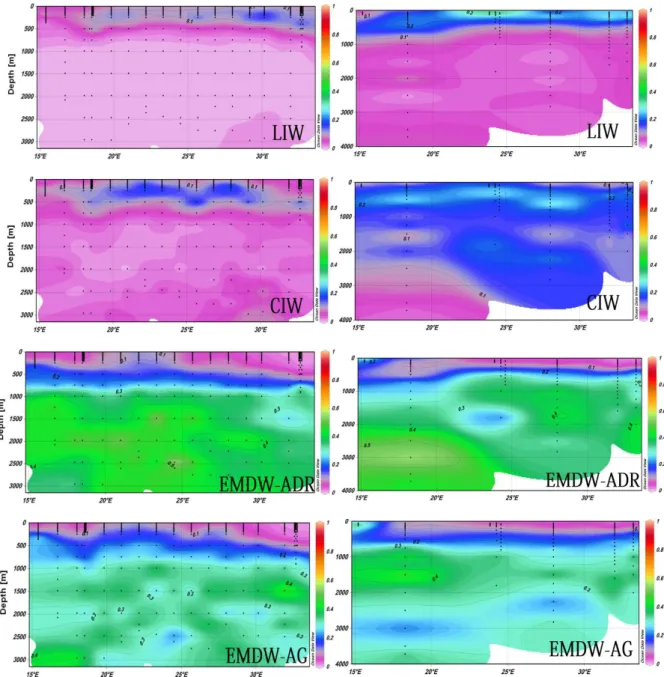
Figure 6. Profiles of the mixing coefficients of water masses in the Eastern Mediterranean basin during the 2013 MedSeA cruise (right column) and the 2008 BOUM cruise (left column).
3.2.1. Modified Atlantic Water, MAW
The proportion of the MAW increased from 2008 to 2013. During 2013, it is clear that its amount increases while propagating Eastward from the Sicily Strait (Fig.6). This water mass is initially made as a result of the mixing of comparatively fresh Atlantic water (S < 36.5) flowing via the Strait of Gibraltar into the Mediterranean Sea with the surface waters of the Alboran Sub-basin [57]. The incoming MAW is continuously modified by interactions with the atmosphere and mixing with older surface waters and with the waters underneath. All along its course, it is seasonally warmed or cooled, but overall its salt content increases and it becomes denser [58]. Thus, its increasing proportion could be attributed to the excessive evaporation trend in the context of global warming occurring in the Mediterranean Sea [59] [60]. Satellite observations from 1985–2006 indicate that in the last
two decades the temperature in the upper layer of the Mediterranean Sea has been increasing at an average (± SD) rate of 0.03 ± 0.008°C yr–1 for the Western basin and 0.05 ± 0.009°C yr–1 for the Eastern basin [60]. Nevertheless, these changes could also be due to the modifications in circulation patterns leading to blocking situations during the EMT (i.e. gyres, eddies, …), to the Adriatic-Ionian Bimodal Oscillating System (BiOS) [61] and/or to variations in the fresher water of Black Sea origin input through the Strait of Dardanelles [8].
3.2.2. Levantine Intermediate Water, LIW
The amount of this water mass has increased during the study period (2008-2013; Fig.6). Its proportion increased from 0.27 in 2008 to 0.37 in 2013 within the intermediate layers (~ 175 m) in the South of Cyprus. The increasing proportion could be related to the occurrence of high amount of MAW in this area which becomes denser. Thus, this latter sinks more
quickly to participate in the formation of the LIW. This fact could be caused by the excessive evaporation and the decrease in precipitation and freshwater supplies to the Mediterranean Sea. This can be direct consequences of the global warming, well described in literature [62] [63] [64].
3.2.3. Cretan Intermediate Water, CIW
The proportion of this intermediate water mass has increased in the entire Eastern basin, particularly in the South of Crete where it has the highest proportions (~ 0.35 at ~ 170 m; Fig. 6). This fact is due to changes in circulation patterns leading to blocking situations concerning the MAW and the LIW, and to variations in the fresher water of Black Sea origin input through the Strait of Dardanelles [8] [42]. These results could also be attributed to specific atmospheric conditions which created large buoyancy fluxes from the Aegean Sub-basin, similarly to the ones mentioned by [65] during winters 1991/1992 and 1992/1993 (the "enhanced EMT winters"), intensifying intermediate and deep water production, although with modified characteristics [66].
3.2.4. Eastern Mediterranean Deep Water Originated in the
Adriatic Sub-Basin, EMDWAdr
During the study period, it is clear that the mixing coefficients of the EMDWAdr decreased in the Levantine
Sub-basin from a range of 0.33-0.4 to 0.2-0.39 in deep layers (below 1000 m ; Fig. 6). However, its mixing proportion remains high in the South of the Ionian Sub-basin (~ 0.54). These results indicate that the EMDWAdr stays a minor deep
water mass in the Levantine Sub-basin. Moreover, it shows that the EMDW originated from the Adriatic Sub-basin is reaching the South of the Ionian Sub-basin but maybe physical phenomena (like the more defined open ocean, free jet intensified structures mentioned by [55] : the Atlantic-Ionian Stream and the Mid-Mediterranean Jet in the Eastern basin) are disabling its dissemination all over the Eastern basin.
3.2.5. Eastern Mediterranean Deep Water Originated in the
Aegean Sub-Basin, EMDWAg
The mixing coefficients of this water mass show a remarkable increase, particularly in the Levantine Sub-basin (from 0.29 to 0.54 at 1500 m ; Fig.6). The steady occurrence of this dominant deep water mass in the Levantine Sub-basin, instead of EMDWAdr, could be due to many factors : 1- the
waters formed in the Aegean Sub-basin still sufficiently denser than those originated in the Adriatic one, hence, it is able to enter the deep layers of the Eastern basin and not address the intermediate water range depth [67], 2- the deep water formation in the Adriatic Sub-basin seems to be significantly impacted by the EMT [68], thus it is not able to match its previous distribution in the Eastern basin, 3- the atmospheric and physical conditions favorable for the formation of this dense water still dominant in this area, 4- our results could also be attributed to the long residence time of deep water masses in the Levantine Sub-basin due the robust topography which could trap the deep waters for a long period (~ 100 years) [69] [70].
4. Conclusion
Overall, based upon data from the 2008 BOUM and 2013 MedSeA cruises, the present study shows a significant evolution of some water masses mixing coefficients, calculated via the MIX approach. Surface water mass proportions did not change significantly. However, intermediate and deep water mass mixing coefficients of both Eastern and Western basins were noticeably modified. Moreover, these results indicate that the mixing coefficient of the EMDWAdr is always high in the Ionian Sub-basin, while it
remains low in the Levantine Sub-basin compared to the EMDWAg. Furthermore, the observed decrease of the mixing
coefficient in the deep Western water masses (TDW, WMDW) is mainly attributed to changes in the deep Eastern water masses circulation. This study proves that the hypothesis of “steady state” situation for the Mediterranean Sea is far from being validated. This sea witnesses continuous and significant water masses changes [ex. The Eastern Mediterranean Transient, EMT [66] [71] [72] [73] [74], changes in circulation pattern in the Ionian Sub-basin which affect the contiguous sub-basins [61] [75]. Therefore, this work could be an incentive for further studies to innovate new oceanic models that take into considerations the unsteady state situation of the water masses circulation in the Mediterranean Sea (and probably in other oceanic areas). In the context of the global warming, further measurements of these water masses properties are necessary, to assess their evolutions and to evaluate the consequences of any modification on the global circulation.
Acknowledgements
This work was funded by the EC FP7 “Mediterranean Sea Acidification in a changing climate – MEDSEA” project (MedSeA ; grant agreement 265103 ; medsea-project.eu). The authors are pleased to thank the captains and the crew of the Spanish research vessel R/V Ángeles Alvariño. They would like furthermore to thank Mr. Michael GRELAUD for uploading the data of this cruise on Pangaea data repository [76, 77, 78, 79, 80]. Authors are grateful to the National Council for Scientific Research (CNRS) in Lebanon for the Ph.D. thesis scholarship granted to Mr. Abed El Rahman HASSOUN.
References
[1] Mariotti A., Struglia M.V., Zeng N., Lau K.-M., 2002. The Hydrological Cycle in the Mediterranean Region and Implications for the Water Budget of the Mediterranean Sea. Journal of Climate, 15, 1674–1690.
[2] Manca B., Burca M., Giorgetti A., Coatanoan C., Garcia M.-J., Iona A., 2004. Physical and biochemical averaged vertical profiles in the Mediterranean regions: an important tool to trace the climatology of water masses and to validate incoming data from operational oceanography. Journal of Marine Systems, 48, 83–116.
[3] Castellari S., Pinardi N., Leaman K., 2000. Simulation of water mass formation processes in the Mediterranean Sea : influence of the time frequency of the atmospheric forcing. Journal of Geophysical research, 105 (C10), 24157-24181.
[4] Malanotte-Rizzoli P., 1991. The Northern Adriatic Sea as a prototype of convection and water mass formation on the continental shelf. In: Chu, P.C., Gascard, J.C. (Eds.), Deep Convection and Deep Water Formation in the Oceans. Elsevier Oceanography Series. 57. Elsevier, Amsterdam, pp. 229– 239. [5] POEM Group, 1992. General circulation of the Eastern
Mediterranean Sea. Earth-Science Reviews, 32, 285–308. [6] Moore W.S., 2006 a. The role of submarine groundwater
discharge in coastal biogeochemistry. Journal of Geochemical Exploration, 88, 389–393, doi:10.1016/j.gexplo.2005.08.082. [7] Moore W. S., 2006 b. Radium isotopes as tracers of submarine
groundwater discharge in Sicily. Continental Shelf Research, 26, 852–861, doi:10.1016/j.csr.2005.12.004.
[8] Robinson A.R., Leslie W., Theocharis A., Lascaratos A., 2001. Mediterranean Sea circulation. Encyclopedia of Ocean Science, Vol. 3. Academic Press, San Diego, CA, pp. 1689–1705. [9] Lacombe H. and Richez C., 1982. The Regime of the Strait of
Gibraltar. Hydrodynamics of Semi-Enclosed Seas. Proceedings of the 13th International Liege Colloquium on Ocean Hydrodynamics. Elsevier Oceanography Series, 34, 13–73. [10] Bergamasco A. and Malanotte-Rizzoli P., 2010. The circulation
of the Mediterranean Sea: a historical review of experimental investigations. Advances in Oceanography and Limnology, 1 (1), 11–28.
[11] Candela J., 2001. Mediterranean water and the global circulation. In: Siedler, G., Chuch, J., Gould, J., (Eds.), Ocean circulation and Climate. Observing and modeling the global ocean. Academic Press, New York, pp. 419–429.
[12] Malanotte-Rizzoli P. and the Pan-Med Group, 2012. Physical forcing and physical/biochemical variability of the Mediterranean Sea: A review of unresolved issues and directions of future research. Report of the Workshop “Variability of the Eastern and Western Mediterranean circulation and thermohaline properties: similarities and differences”, Rome, 7-9 November, 2011, pp. 48.
[13] Cardin V., Bensi M., and Pacciaroni M., 2011. Variability of water mass properties in the last two decades in the South Adriatic Sea with emphasis on the period 2006–2009. Continental Shelf Research, 5 (31), 951–965.
[14] Kovačević V., Manca B.B., Ursella L., Schroeder K., Cozzi S., Burca M., Mauri E., Gerin R., Notarstefano G., and Deponte D., 2012. Water mass properties and dynamic conditions of the Eastern Mediterranean in June 2007. Progress in Oceanography, 104, 59–79.
[15] Schroeder K., Borghini M., Cerrati G., Difesca V., Delfanti R., Santinelli C., et Gasparini G.P., 2008. Multiparametric mixing analysis of the deep waters in the western Mediterranean Sea. Chemistry and Ecology, 24 (1), 47–56.
[16] Hainbucher D., Rubino A., Cardin V., Tanhua T., Schroeder K., and Bensi M., 2013. Hydrographic situation during cruise M84/3 and P414 (spring 2011) in the Mediterranean Sea. Ocean Science Discussion, 10, 2399–2432, doi:10.5194/osd-10-2399-2013
[17] Goyet C., Coatanoan C., Eischeid G., Amaoka T., Okuda K., Healy R., and Tsunogai S., 1999. Spatial variation of total CO2
and total alkalinity in the northern Indian Ocean: A novel approach for the quantification of anthropogenic CO2 in
seawater. Journal Of Marine Research, 57, 135–163, doi: 10.1357/002224099765038599.
[18] BOUM (Biogeochemistry from the Oligotrophic to the Ultra-oligotrophic Mediterranean): http://www.com.univ-mrs.fr/BOUM/. Moutin T. and Torre M.P., Centre d'oceanologie de Marseille - Campus de Luminy. [19] Moutin T., Van Wambeke F., and Prieur L., 2012. Introduction
to the Biogeochemistry from the Oligotrophic to the Ultraoligotrophic Mediterranean (BOUM) experiment. Biogeosciences, 9, 3817–3825, doi:10.5194/bg-9-3817-2012 [20] MedSeA (Mediterranean Sea Acidification in a changing
climate) project, 2015 : http://medsea-project.eu/
[21] 2013 MedSeA research cruise on ocean acidification and warming : http://medseaoceancruise.wordpress.com/
[22] Pujo-Pay M., Conan P., Oriol L., Cornet-Barthaux V., Falco C., Ghiglione J.-F., Goyet C., Moutin T., and Prieur L., 2011. Integrated survey of elemental stoichiometry (C, N, P) from the western to eastern Mediterranean Sea. Biogeosciences, 8, 883–899, doi: 10.5194/bg-8-883-2011.
[23] Crombet Y., Leblanc K., Quéguiner B., Moutin T., Rimmelin P., Ras J., Claustre H., Leblond N., Oriol L., and Pujo-Pay M., 2011. Deep silicon maxima in the stratified oligotrophic Mediterranean Sea. Biogeosciences, 8, 459–475, doi: 10.5194/bg-8-459-2011.
[24] Hansen H.P., 1999. Determination of oxygen. In: Grasshoff, K., Kremling, K., Ehrhardt, M., Methods of Seawater Analysis, 3rd Edition, Wiley-VCH, Weinheim, pp. 600.
[25] Outdot C., Gerard R., Morin P., 1988. Precise shipboard determination of dissolved oxygen (Winkler procedure) for productivity studies with commercial system. Limnology and Oceanography, 33, 146-150. Edition, Wiley-VCH, Weinheim, pp. 600.
[26] Grasshoff K., Kremling K., Ehrhardt M., 1999. Methods of Seawater Analysis, 3rd ed. Wiley-VCH, Weinheim, Germany. [27] Tomczak M., 1981. A multiparameter extension of
temperature/salinity diagram techniques for the analysis of non-isopycnal mixing. Progress in Oceanography, 10, 147–171.
[28] Tomczak M. and Large D.G.B., 1989. Optimum multiparameter analysis of mixing in the thermocline of the Eastern Indian Ocean. Journal of Geophysical Research, 94 (C11), 16141–16149.
[29] Budillon G., Pacciaroni M., Cozzi S., Rivaro P., Catalano G., Ianni C. and Cantoni C., 2003. An optimum multiparameter mixing analysis of the shelf waters in the Ross Sea. Antarctic Science, 15,105–118.
[30] Tomczak M. and Liefrink S., 2005. Interannual variations of water mass volumes in the Southern Ocean. Journal of Atmospheric and Ocean Science, 10, 31–42.
[31] Tomczak M. and Poole R., 1999. Optimum multiparameter analysis of the water mass structure in the Atlantic Ocean thermocline. Deep Sea Research Part I: Oceanographic Research Papers, 46, 1895–1921.
[32] Broecker W. S., 1974. “NO”, a conservative water-mass tracer, Earth and Planetary Science Letters, 23, 100–107, doi: 10.1016/0012-821X(74)90036-3.
[33] Redfield A.C., Ketchum B.H., and Richards F.A., 1963. The influence of organisms on the composition of seawater, in: The Sea, Hill M. N., pp. 26–77.
[34] Gill P.E., Murray W., Wright M.H., 1991. Numerical Linear Algebra and Optimization, Addison Wesley.
[35] Touratier F., Guglielmi V., Goyet C., Prieur L., Pujo-Pay M., Conan P., Falco C., 2012. Distributions of the carbonate system properties, anthropogenic CO2, and acidification during the
2008 BOUM cruise (Mediterranean Sea). Biogeosciences Discussions, 9, 2709-2753, doi:10.5194/bgd-9-2709-2012. [36] Malanotte-Rizzoli P., Manca B.B., D’ Alcala M.R., Theocharis
A., Brenner S., Budillon G., and Ozsoy E., 1999. The Eastern Mediterranean in the 80s and in the 90s: the big transition in the intermediate and deep circulations. Dynamics of Atmospheres and Oceans, 29, 365–395, doi: 10.1016/S0377-0265(99)00011-1.
[37] Béthoux J.-P., 1980. Mean water fluxes across sections in the Mediterranean Sea, evaluated on the basis of water and salt budget and of observed salinities. Oceanologica Acta, 3, 79–88.
[38] Hopkins T.S., 1978. Physical Processes in the Mediterranean basins. In: Kjerfve, B. (Eds.), Estuarine Transport Processes. Univ. of South Carolina Press, Columbia, SC. pp. 269–310. [39] Özsoy E., Hecht A., Unluata U., Brenner S., Sur H.I., Bishop J.,
Latif M.A., Rozentraub Z., Oguz T., 1993. A synthesis of the Levantine Basin circulation and hydrography, 1985– 1990. Deep-Sea Research Part II: Topical Studies in Oceanography, 40, 1075–1119.
[40] Marcos M. and Tsimplis M.N., 2008. Comparison of results of AOGCMs in the Mediterranean Sea during the 21st century. Journal of Geophysical Research: Oceans, 113 (C12), doi: 10.1029/2008JC004820.
[41] IPCC, 2014. Climate Change 2014: Impacts, Adaptation, and Vulnerability. The Fifth Assessment Report of the Intergovernmental Panel on Climate Change.
[42] Ludwig W., Dumont E., Meybeck M., Heussner S., 2009. River discharges of water and nutrients to the Mediterranean and Black Sea : Major drivers for ecosystem changes during past and future decades? Progress in Oceanography, 80, 199–217. [43] Cozzi S. and Giani M., 2011. River water and nutrient
discharges in the northern Adriatic Sea : current importance and long term changes. Continental Shelf Research, 31, 1881–1893.
[44] Sparnocchia S., Gasparini G.P., Astraldi M., Borghini M., Pistek P., 1999. Dynamics and mixing of the Eastern Mediterranean outflow in the Tyrrhenian Sea. Journal of Marine Systems, 20, 301–317.
[45] Fuda J.-L., Etiope G., Millot C., Favali P., Calcara M., Smriglio G. and Boschi E., 2002. Warming, salting and origin of the Tyrrhenian Deep Water. Geophysical Research Letters, 29 (19), 41–44, doi: 10.1029/2001GL014072.
[46] Bakun A. and Agostini V.N., 2001. Seasonal patterns of wind-induced upwelling/downwelling in the Mediterranean Sea. Scientia Marina, 65, 243–257.
[47] Estrada M., 1996. Primary production in the northwestern Mediterranean. Scientia Marina, 60 (2), 55–64.
[48] Lacombe H., Tchernia P., Gamberoni L., 1985. Variable bottom water in the Western Mediterranean basin. Progress in Oceanography, 14, 319–338.
[49] Béthoux J.P., Gentili B., Raunet J., and Tailliez D., 1990. Warming trend in the western Mediterranean deep water. Nature, 347, 660–662, doi: 10.1038/347660a0.
[50] Rohling E.J. and Bryden H.L., 1992. Man-induced salinity and temperature increases in Western Mediterranean deep water. Journal of Geophysical Research, 97, 11191-11198.
[51] Vargas-Yáñez M., Moya F., García-Martínez M.C., Tel E., Zunino P., Plaza F., Salat J., Pascual J., López-Jurado J. L., and Serra M., 2010. Climate change in the Western Mediterranean Sea 1900–2008. Journal of Marine Systems, 82, 171–176. [52] Malanotte-Rizzoli P., Artale V., Borzelli-Eusebi G.L., Brenner
S., Crise A., Gacic M., Kress N., Marullo S., Ribera d’Alcalà M., Sofianos S., Tanhua T., Theocharis A., Alvarez M., Ashkenazy Y., Bergamasco A., Cardin V., Carniel S., Civitarese G., D’Ortenzio F., Font J., Garcia-Ladona E., Garcia-Lafuente J.M., Gogou A., Gregoire M., Hainbucher D., Kontoyannis H., Kovacevic V., Kraskapoulou E., Kroskos G., Incarbona A., Mazzocchi M.G., Orlic M., Ozsoy E., Pascual A., Poulain P.-M., Roether W., Rubino A., Schroeder K., Siokou-Frangou J., Souvermezoglou E., Sprovieri M., Tintoré J., and Triantafyllou G., 2014. Physical forcing and physical/biochemical variability of the Mediterranean Sea: a review of unresolved issues and directions for future research. Ocean Science, 10, 281–322, doi: 10.5194/os-10-281-2014.
[53] PROOF program, 2015,
http://www.obsvlfr.fr/jgofs/html/prosope/home.htm.
[54] Copin-Montégut C. and Bégovic M., 2002. Distributions of carbonate properties and oxygen along the water column (0-2000 m) in the central part of the NW Mediterranean Sea (Dyfamed site): influence of winter vertical mixing on air-sea CO2 and O2 exchanges. Deep-Sea Research Part II: Topical Studies in Oceanography, 49 (11), 2049–2066.
[55] Pinardi N., Zavatarelli M., Adani M., Coppini G., Fratianni C., Oddo P., Simoncelli S., Tonani M., Lyubartsev V., Dobricic S. and Bonaduce A., 2013. Mediterranean Sea large-scale low-frequency ocean variability and water mass formation rates from 1987 to 2007: A retrospective analysis. Progress in Oceanography, doi:10.1016/j.pocean.2013.11.003 (In Press). [56] Millot C., 1979. Wind induced upwellings in the Gulf of Lions.
Oceanologica Acta, 2, 261–274.
[57] Gascard J.C. and Richez C., 1985. Water masses and circulation in the western Alboran Sea and in the Strait of Gibraltar. Progress in Oceanography, 15, 157–216.
[58] Zavatarelli M., and Mellor G.L., 1995. A Numerical Study of the Mediterranean Sea Circulation. American Meteorological Society, 2013 GRID-Arendal.
[59] Millot C., Candela J., Jean-Luc F. and Youssef T., 2006. Large warming and salinification of the Mediterranean outflow due to changes in its composition. Deep Sea Research Part I: Oceanographic Research Papers, 53, 656–666.
[60] Nykjaer L., 2009. Mediterranean Sea surface warming 1985–2006. Climate Research, 39, 11–17, doi: 10.3354/cr00794
[61] Civitarese G., Gačić M., Lipizer M., and Eusebi Borzelli G. L., 2010. On the impact of the Bimodal Oscillating System (BiOS) on the biogeochemistry and biology of the Adriatic and Ionian Seas (Eastern Mediterranean). Biogeosciences, 7, 3987–3997, doi:10.5194/bg-7-3987-2010.
[62] Abboud-Abi Saab M., Romano J.-C., Bensoussan N., Fakhri M., 2004. Suivis temporels comparés de la structure thermique d'eaux côtières libanaises (Batroun) et françaises (Marseille) entre juin 1999 et octobre 2002. Comptes Rendus Geoscience, 336 (15), 1379–1390.
[63] IUCN and MedPanA, 2012. Changing mediterranean coastal marine environment under predicted climate-change scenarios. www.medpan.org and www.iucn.org/mediterranean
[64] Lelieveld J., Hadjinicolaou P., Kostopoulou E., El Maayar M., Hannides C., Lange M.A., Tanarhte M., Tyrlis E., Xoplaki E., 2012. Climate change and impacts in the Eastern Mediterranean and the Middle East. Climatic Change, 114 (3), 667–687, http://dx.doi.org/10.1007/s10584-012-0418-4. [65] Romanski J., Romanou A., Bauer M., and Tselioudis G., 2012.
Atmospheric forcing of the Eastern Mediterranean Transient by midlatitude cyclones. Geophysical Research Letters, 39 (L03703), doi: 10.1029/2011GL050298.
[66] Theocharis A., Klein B., Nittis K., Roether W., 2002. Evolution and status of the Eastern Mediterranean Transient (1997–1999). Journal of Marine Systems, 33–34, 91–116.
[67] Borzelli G. E., Gacic M., Lionello P., Malanotte-Rizzoli P., 2014. The Mediterranean Sea: Temporal Variability and Spatial Patterns. Geophysical Monograph Series. Editors: John Wiley & Sons, 2014, pp. 75-82.
[68] Vilibić I., Matijević S., Šepić J., and Kušpilić G., 2012. Changes in the Adriatic oceanographic properties induced by the Eastern Mediterranean Transient. Biogeosciences, 9, 2085–2097, doi: 10.5194/bg-9-2085-2012.
[69] Roether W., Manca B.B., Klein B., Bregant D., Georgopoulos D., Beitzel V., Kovačević V., and Luchetta A., 1996. Recent Changes in Eastern Mediterranean Deep Waters. Science, 271, 333–335, doi: 10.1126/science.271.5247.333.
[70] Stratford K., Williams R.G., and Drakopoulos P.G., 1998. Estimating climatological age from a model-derived oxygen-age relationship in the Mediterranean. Journal of Marine Systems, 18, 215–226.
[71] Gasparini G.P., Ortonab A., Budillon G., Astraldi M. and Sansone E., 2005. The effect of the Eastern Mediterranean Transient on the hydrographic characteristics in the Strait of
Sicily and in the Tyrrhenian Sea. Deep Sea Research Part I: Oceanographic Research Papers, 52 (6), 915–935.
[72] Schröder K., Gasparini G.P., Tangherlini M., and Astraldi M., 2006. Deep and intermediate water in the western Mediterranean under the influence of the Eastern Mediterranean Transient. Geophysical Research Letters, 33 (L21607, doi: 10.1029/2006GL027121.
[73] Touratier, F. and Goyet, C., 2011. Impact of the Eastern Mediterranean Transient on the distribution of anthropogenic CO2 and first estimate of acidification for the Mediterranean Sea. Deep Sea Research Part I: Oceanographic Research Papers, 58, 1–15.
[74] Tanhua T., Hainbucher D., Schroeder K., Cardin V., Alvarez M., and Civitarese G., 2013. The Mediterranean Sea system: a review and an introduction to the special issue. Ocean Sciences, 9, 789–803, doi:10.5194/os-9-789-2013.
[75] Gačić M., Civitarese G., Eusebi Borzelli G.L., Kovačević V.,Poulain P.-M.,Theocharis A., Menna M., Catucci A., Zarokanellos N., 2011.On the relationship between the decadal oscillations of the northern Ionian Sea and the salinity distributions in the eastern Mediterranean. Journal of Geophysical Research: Oceans, 116 (C12002), doi: 10.1029/2011JC007280.
[76] Goyet C., Hassoun A.E.R., Gemayel E., 2015. Carbonate system during the May 2013 MedSeA cruise. Dataset #841933 (DOI registration in progress).
[77] Goyet C., Gemayel E., Hassoun A.E.R., 2015. Underway pCO2 in surface water during the 2013 MedSEA cruise. Dataset #841928 (DOI registration in progress).
[78] Ziveri P., and Grelaud M., 2013. Continuous thermosalinograph oceanography along Ángeles Alvariño cruise track MedSeA2013. Universitat Autònoma de Barcelona, doi:10.1594/PANGAEA.822153.
[79] Ziveri P., and Grelaud M., 2013. Physical oceanography during Ángeles Alvariño cruise MedSeA2013. Universitat Autònoma de Barcelona, doi:10.1594/PANGAEA.822162. [80] Ziveri P., and Grelaud M., 2013. Physical oceanography
measured on water bottle samples during Ángeles Alvariño cruise MedSeA2013. Universitat Autònoma de Barcelona, doi:10.1594/PANGAEA.822163.