HAL Id: hal-03193882
https://hal.archives-ouvertes.fr/hal-03193882
Submitted on 9 Apr 2021
HAL is a multi-disciplinary open access
archive for the deposit and dissemination of
sci-entific research documents, whether they are
pub-lished or not. The documents may come from
teaching and research institutions in France or
abroad, or from public or private research centers.
L’archive ouverte pluridisciplinaire HAL, est
destinée au dépôt et à la diffusion de documents
scientifiques de niveau recherche, publiés ou non,
émanant des établissements d’enseignement et de
recherche français ou étrangers, des laboratoires
publics ou privés.
Long-term measurements of carbonaceous aerosols in
the Eastern Mediterranean: evidence of long-range
transport of biomass burning
J. Sciare, K. Oikonomou, O. Favez, E. Liakakou, Z. Markaki, H. Cachier, N.
Mihalopoulos
To cite this version:
J. Sciare, K. Oikonomou, O. Favez, E. Liakakou, Z. Markaki, et al.. Long-term measurements of
carbonaceous aerosols in the Eastern Mediterranean: evidence of long-range transport of biomass
burning. Atmospheric Chemistry and Physics, European Geosciences Union, 2008, 8 (18),
pp.5551-5563. �10.5194/acp-8-5551-2008�. �hal-03193882�
Atmos. Chem. Phys., 8, 5551–5563, 2008 www.atmos-chem-phys.net/8/5551/2008/ © Author(s) 2008. This work is distributed under the Creative Commons Attribution 3.0 License.
Atmospheric
Chemistry
and Physics
Long-term measurements of carbonaceous aerosols in the Eastern
Mediterranean: evidence of long-range transport of biomass
burning
J. Sciare1, K. Oikonomou1, O. Favez1, E. Liakakou2, Z. Markaki2, H. Cachier1, and N. Mihalopoulos2 1Laboratoire des Sciences du Climat et de l’Environnement (LSCE, CNRS-CEA), Gif-sur-Yvette, France 2Department of Chemistry, University of Crete, Heraklion, Crete, Greece
Received: 16 January 2008 – Published in Atmos. Chem. Phys. Discuss.: 9 April 2008 Revised: 5 August 2008 – Accepted: 20 August 2008 – Published: 17 September 2008
Abstract. Long-term (5-year) measurements of Elemen-tal Carbon (EC) and Organic Carbon (OC) in bulk aerosols are presented here for the first time in the Mediterranean Basin (Crete Island). A multi-analytical approach (including thermal, optical, and thermo-optical techniques) was applied for these EC and OC measurements. Light absorbing dust aerosols were shown to poorly contribute (+12% on a yearly average) to light absorption coefficient (babs) measurements
performed by an optical method (aethalometer). Long-range transport of agricultural waste burning from European coun-tries surrounding the Black Sea was shown for each year during two periods (March–April and July–September). The contribution of biomass burning to the concentrations of EC and OC was shown to be rather small (20 and 14%, respec-tively, on a yearly basis), although this contribution could be much higher on a monthly basis and showed important sea-sonal and interannual variability. By removing the biomass burning influence, our data revealed an important seasonal variation of OC, with an increase by almost a factor of two for the spring months of May and June, whereas BC was found to be quite stable throughout the year. Preliminary measurements of Water Soluble Organic Carbon (WSOC) have shown that the monthly mean WSOC/OC ratio remains stable throughout the year (0.45±0.12), suggesting that the partitioning between water soluble and water insoluble or-ganic matter is not significantly affected by biomass burning and secondary organic aerosol (SOA) formation. A chemical mass closure performed in the fine mode (Aerodynamic Di-ameter, A.D.<1.5µm) showed that the mass contribution of organic matter (POM) was found to be essentially invariable during the year (monthly average of 26±5%).
Correspondence to: N. Mihalopoulos
(mihalo@chemistry.uoc.gr)
1 Introduction
Recent studies demonstrate the significant role of elemental carbon (EC) aerosols in the Eastern Mediterranean (Lelieveld et al., 2002; Sciare et al., 2003b) with negative surface ra-diative forcing and large positive atmospheric forcing val-ues nearly identical to the highly absorbing south Asian haze observed over the Arabian Sea (Markowicz et al., 2002). The contribution of these light absorbing particles is partic-ularly important during the summer period when most of air masses over the Eastern Mediterranean originate from the Balkans, Turkey and Central/Eastern Europe (Vrekoussis et al., 2005; Bryant et al., 2006). During this period, con-tinental (anthropogenic) aerosols, mainly composed of sul-fate and carbonaceous material, contribute for almost 2/3 of the Aerosol Optical Depth (AOD) over the Greek-Turkish coastal region (Barnaba and Gobbi, 2004). Extensive for-est fires from southern Europe and desert dust plumes from North Africa may also be significantly contributing to large-scale aerosol emissions in the Mediterranean environment. Since aerosol types emitted from the above mentioned phe-nomena significantly absorb solar radiation and contain trace elements such as phosphorus and iron, they can influence the atmospheric physics and the marine biogeochemistry of the Mediterranean (Guieu et al., 2005; Meloni et al., 2006; Bon-net and Guieu, 2006).
Most of studies clearly indicate the major role of carbona-ceous material on aerosol optical properties in the Mediter-ranean region but still few are based on field observations which are particularly scarce and time limited (Sciare et al., 2003a and 2005). The few of them performed in the East-ern part of Mediterranean have shown that a proper analyti-cal determination of their concentrations remains a difficult task primarily due to the complexity of the aerosol mixtures (Sciare et al., 2003b; Bardouki et al., 2003).
5552 J. Sciare: Carbonaceous aerosols in the Eastern Mediterranean
32
Wind direction (W sector)
0 10 20 30 40 50 60 70 80 90 100 1 2 3 4 5 6 7 8 9 10 11 12 % O c c u re n c e
Wind direction (N sector)
0 10 20 30 40 50 60 70 80 90 100 1 2 3 4 5 6 7 8 9 10 11 12 % O c c u re n c e
Wind direction (E sector)
0 10 20 30 40 50 60 70 80 90 1 2 3 4 5 6 7 8 9 10 11 12 MOY % O c c u re n c e
Wind direction (S sector)
0 10 20 30 40 50 60 70 80 90 1 2 3 4 5 6 7 8 9 10 11 12 MOY % O ccur e nce Figure 1: M.O.Y. M.O.Y.
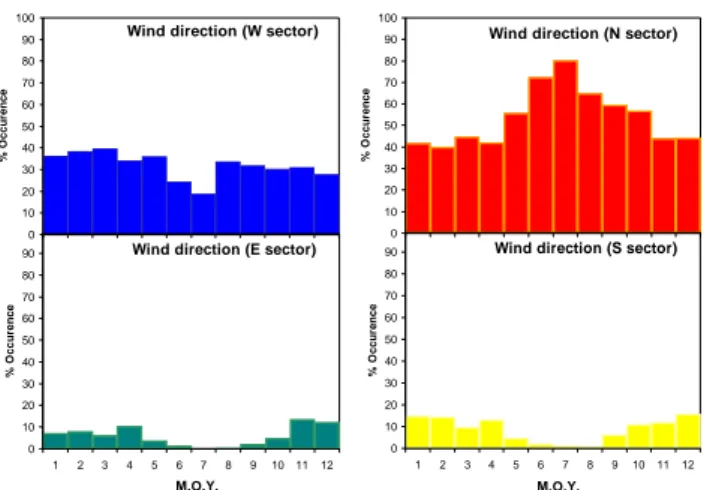
Fig. 1. Yearly-based wind direction occurrences for the 4 sectors (North, West, East, and South) at Finokalia station in Crete Isl. M.O.Y stands for Month Of the Year.
Soot is determined either optically or chemically. The tical method relies on light absorption; the corresponding op-erational definition for soot is black carbon (BC). The chem-ical (thermal and thermo-optchem-ical) measurements measure the mass concentration of total carbon, in which the fraction that is refractory and does not volatilize below 400◦in air is de-fined as elemental carbon (EC) (Birch and Cary, 1996). Dis-tinction is done in the following between EC and BC since they refer to somewhat different fractions of light absorbing carbon.
Among the major outcomes from carbonaceous aerosol studies in the Mediterranean, important discrepancies were observed in the determination of summertime EC concentra-tions from the use of different analytical protocols. EC con-centrations derived from the IMPROVE thermo-optical pro-tocol (Chow et al., 1993) and light absorption measurements (PSAP, Radiance Research) showed a very good correlation with non-sea-salt potassium (nss-K+), considered to be a tracer of biomass burning. On the other hand, EC concentra-tions derived from a 2-step thermal method (Cachier et al., 1989) and performed on the same filter samples showed to better correlate with non-sea-salt sulfate (nss-SO2−4 ) which is considered as a tracer for fossil fuel combustion. The proper analysis of carbonaceous aerosols over the Mediterranean is even more complicated by the presence of important dust concentrations deposited on quartz filter matrix that inter-fere in many ways with light absorption measurements as well as on thermo-optical measurements of EC and OC. The above drawbacks originate either from the presence of ab-sorbing ferric iron oxides (hematite and goethite) contained in the dust particles and/or release of oxygen contained in the metallic oxides that compose dust aerosols during the He step of the thermo-optical method. All these results indicate that the proper determination of the different carbonaceous frac-tions (EC and OC) in the dusty environment of the Mediter-ranean remains a challenge.
Long-term measurements of carbonaceous aerosols are presented here for the first time over the Mediterranean Sea (Crete Isl.). Their concentrations and seasonal variations are discussed from the use of different analytical methods. Their relative mass contribution to the fine aerosol mass (A.D.< 1.5µm) is evaluated from a chemical mass closure (CMC) study. The multi-year record of EC and OC obtained here is used to investigate the role of long-range transport of biomass burning aerosols in the region as well as the role of secondary organic aerosol formation.
2 Instrumentation
2.1 Sampling site and climatology
The atmospheric station of Finokalia (Crete Isl., Greece) is located in the marine boundary layer (35◦200N, 25◦400E;
200 m above sea level), facing the Aegean Sea and located at approximately 500m from the shore. A detailed description of the climatology of this site can be found in Kouvarakis et al. (2000) and Gerasopoulos et al. (2006).
Seasonal variations of wind sectors at Finokalia station are reported in Fig. 1. They are calculated from backtrajec-tory analysis every 12h, with the Hysplit Dispersion Model (Hybrid Single – Particle Lagrangian Integrated Trajectory; Draxler and Hess, 1998) using the location of air parcels 24 h before arrival at Finokalia Station. Seasonal variations of wind sectors are computed for the duration of the filter sampling reported here (from September 2001 to December 2006). Each wind sector covers a 90◦sector centred on each
direction (North, East, South, and West). On a yearly ba-sis, more than half of the air masses arriving in Crete orig-inate from the North sector, which covers Central and East-ern Europe as well as part of westEast-ern Turkey. This northEast-ern contribution reaches almost 75% during the summer months, when the photochemistry is at its highest. This pattern clearly shows that the Eastern Mediterranean Basin is strongly influ-enced by long-range transport of continental air masses and makes Finokalia station a particularly well-suited receptor site to characterize the poorly documented emissions from Central/Eastern Europe as well as their ageing.
2.2 Aerosol sampling
The long-term aerosol chemical measurements presented here are based on the filter sampling devices that have been used during the MINOS campaign in August 2001 (see Sciare et al., 2003b and 2005 for more details). Briefly, total suspended particulate (TSP) samples are collected on 47-mm diameter quartz fiber filters (QMA, Whatman) at a flowrate of approximately 2.8 m3/h for carbon analysis (BC, OC, WSOC). Co-located Stacked Filter Units (SFUs) using polycarbonate filters are used in parallel for gravimetric mea-surements and ion analysis. SFU filters consist of an 8 µm pore size 47-mm diameter Nuclepore filter mounted in front
J. Sciare: Carbonaceous aerosols in the Eastern Mediterranean 5553 of a 0.4 µm pore size 47-mm diameter Nuclepore filter. The
50% cut point diameter (D50) of the 8µm Nuclepore filter
was estimated to be of the order of 1.5±0.5µm based on the adopted flowrate of 1.5 m3/h. In this paper, the aerosol coarse fraction will refer to the particles collected on the 8µm pore size filters and thus having an A.D. larger than 1.5µm. Con-versely, the fine fraction refers to particles collected on the 0.4 µm pore size filters and corresponds to particles with an A.D. below 1.5 µm.
Typical filter sampling time is of the order of 1 week (7.7 ±2.9 days). It covers a 3.5-year period (09/2001– 04/2004) for SFU filters and a 5-year period for QMA fil-ters (09/2001–11/2006). SFU and QMA filfil-ters have been sampled in parallel during the period (09/2001–04/2004). A sequential sampling of 15min every 1 h was applied for both SFU and QMA filters, which corresponds to less than 2 days of continuous sampling. This was performed to minimize fil-ter clogging that may appear for long time sampling of SFUs and that may induce a rapid decrease of flowrate. Flowrate of SFU filters was checked carefully at the beginning and the end of each sampling for that purpose.
3 Analysis
3.1 Thermal and thermo-optical carbon analyses
One thermal and two thermo-optical techniques have been used to determine the EC and OC contents on the quartz fil-ters. They are presented and discussed in details by Sciare et al. (2003b) and are briefly reported here. To avoid in-terference by carbonates, all samples were initially treated with HCl fumes using the protocol designed by Cachier et al. (1989). Artifacts due to the absorption of gas-phase or-ganic compounds on the sample substrate were minimized by heating filters for 20 minutes at 60◦C prior to the analy-ses. The EC and OC concentrations for the quartz filters were measured with a thermo-optical light transmission technique (Sunset Carbon Analyzer Instrument; Birch and Cary, 1996). Two temperature programs were implemented in the Sun-set instrument and correspond to the temperature programs used in the IMPROVE and NIOSH protocols, respectively (Chow et al., 1993; NIOSH, 1996 and 1998). EC measure-ments from these two temperature programs are reported as EC(NIOSH) and EC(IMPROVE) in the following. Finally, EC was also determined using a 2-step thermal method de-veloped by Cachier et al. (1989) and is reported later as EC(2-STEP). Filters taken regularly in the field (and used as blanks) did not show a detectable amount of EC but showed OC concentrations of 0.8µgC/cm2, on average. Blank cor-rections were then performed only for OC and represent on average less than 5% of the OC measurements performed during the study. Uncertainties in the BC and OC measure-ments given by the manufacturer (Sunset Lab, OR) are esti-mated to be of the order of 5% ±0.2µgC/cm2.
3.2 Light absorption measurements
A circle punch of 18 mm diameter was taken on each QMA filter to perform a non-destructive optical measurement of the light absorption using a modified aethalometer model AE-9 manufactured by Magee Scientific (Hansen et al., 1AE-982). This Aethalometer is working with an incandescent light with a broad spectral distribution. The spectral response of a similar instrument (AE-10) is given by Weingartner et al. (2003). The aerosol absorption coefficient (bATN)
de-termined in this way may differ significantly from the true aerosol absorption coefficient (babs) of airborne particles
(Weingartner et al., 2003). Therefore, calibration factors C and R(ATN) are introduced, which can convert aethalometer attenuation measurements to “real” absorption coefficients following the equation:
babs=σabs×bATN/(σATN×R(ATN)) (1)
where σabsand σATN(equal to σabs×C) are the mass specific
absorption and attenuation cross-section (in units of m2g−1),
respectively. Following the recommendation of the construc-tor a σATNvalue of 19 m2g−1was used in this work.
Wein-gartner et al. (2003) have proposed an R-value close to 1 for aged atmospheric aerosols at remote site, as the high amount of scattering aerosol material in the fiber matrix compensat-ing the shadowcompensat-ing effect related to R. The same authors have also proposed a C value of 1.9 corresponding to aged atmo-spheric particles. Following these results, our absorption co-efficients were calculated with R and C values of 1 and 1.9, respectively. Aethalometer BC measurements are reported in the following as BC(AETHALO).
3.3 Water Soluble Organic Carbon analysis
Water Soluble Organic Carbon analyses were performed on 49 samples covering the period (10/2005–07/2006). Three quarter of the quartz filter (previously used for EC and OC determinations) was dedicated for this analysis by using a total organic carbon analyser (TOC, Model Sievers 900, Ionics Ltd, USA). Filter extraction was conducted through overnight soft shaking of the filter portion placed in borosili-cate Erlenmeyer flasks with 25 mL of ultra pure water (ob-tained by ELGA maxima HPLC). Prior to analysis, the extract solution was filtered through Teflon (PTFE) filters (0.2µm pore size diameter), to remove suspended particles. The measurement uncertainty given by the manufacturer is of the order of 7%. Blank values for the water (used for the filter extraction) and blank values for the filters were found to be on average 50±20 ppb and 250±50 ppb, respectively. The overall blank value of the order of 300±70 ppb corresponds on average to 16.4±8.5% of the mean WSOC value deter-mined for the 49 sampled QMA filters. Analyses were dupli-cated for each QMA sample and good reproducibility (devi-ation of the order of 1%) was obtained. Water Insoluble Or-ganic Carbon (WIOC) mass concentrations were calculated
5554 J. Sciare: Carbonaceous aerosols in the Eastern Mediterranean
Table 1. Monthly mean concentrations of the major aerosol chemical components, particulate matter (PM), and reconstructed PM from the chemical mass closure (PMCMC) in the fine mode (A.D.<1.5 µm). Standard deviations (1σ ) are reported in brackets. Data collected for the
3.5-year period (09/2001–04/2004).
Month of the Year EC (IMPROVE) OC (IMPROVE) nss-SO4Fine NH4Fine NO3Fine sea salt Fine dust Fine PMCMCFine PM Fine
µgC/m3 µgC/m3 µg/m3 µg/m3 µg/m3 µg/m3 µg/m3 µg/m3 µg/m3 January 0.18 (0.07) 1.13 (0.07) 1.99 (1.14) 0.39 (0.40) 0.11 (0.13) 2.07 (2.56) 1.44 (1.84) 9.66 (5.30) 10.45 (4.98) February 0.30 (0.12) 1.38 (0.31) 3.34 (1.00) 0.94 (0.33) 0.03 (0.00) 0.40 (0.15) 0.37 (0.38) 8.68 (2.50) 7.77 (4.89) March 0.37 (0.13) 1.81 (0.25) 3.25 (0.22) 0.86 (0.10) 0.04 (0.01) 0.36 (0.09) 1.57 (0.23) 9.18 (0.03) 9.42 (0.87) April 0.37 (0.11) 1.78 (0.48) 3.97 (0.17) 1.11 (0.05) 0.05 (0.04) 0.34 (0.04) 1.22 (0.92) 9.71 (1.81) 9.09 (0.40) May 0.27 (0.04) 1.68 (0.65) 3.26 (0.80) 0.98 (0.25) 0.03 (0.01) 0.26 (0.01) 0.75 (0.39) 0.75 (2.31) 6.47 (2.98) June 0.26 (0.04) 2.04 (0.48) 4.85 (0.27) 1.34 (0.08) 0.06 (0.04) 0.29 (0.06) 1.17 (0.03) 8.93 (0.20) 9.09 (1.39) July 0.36 (0.17) 2.18 (0.65) 4.61 (1.05) 1.18 (0.29) 0.04 (0.01) 0.36 (0.01) 0.59 (0.06) 10.88 (0.13) 9.57 (0.39) August 0.39 (0.02) 2.16 (0.91) 5.33 (1.43) 1.27 (0.30) 0.06 (0.03) 0.38 (0.10) 1.33 (0.29) 10.35 (1.80) 9.46 (1.63) September 0.40 (0.09) 2.16 (0.39) 2.94 (0.64) 0.72 (0.09) 0.04 (0.03) 0.23 (0.12) 1.12 (1.03) 11.40 (2.28) 7.65 (2.89) October 0.35 (0.11) 1.67 (0.33) 3.65 (1.98) 0.97 (0.58) 0.04 (0.02) 0.27 (0.08) 0.59 (0.50) 7.29 (2.92) 8.91 (2.48) November 0.23 (0.03) 1.51 (0.65) 2.27 (0.03) 0.51 (0.02) 0.08 (0.03) 0.44 (0.02) 1.60 (0.02) 8.29 (0.46) 7.41 (0.31) December 0.25 (0.11) 1.35 (0.50) 1.00 (1.13) 0.18 (0.21) 0.08 (0.06) 1.43 (1.28) 1.08 (0.92) 6.97 (1.19) 6.40 (2.93) Yearly average 0.31 (0.07) 1.74 (0.35) 3.37 (1.24) 0.87 (0.36) 0.05 (0.02) 0.57 (0.57) 1.07 (0.41) 8.88 (1.75) 8.47 (1.30)
as the difference between OC and WSOC mass concentra-tions.
3.4 Ion Chromatography analysis
Ion chromatography analysis of SFU filters was performed at LSCE in order to determine selected anions (Acetate, Propi-onate, Formate, MethanesulfPropi-onate, Glutarate, Succinate, Ox-alate, Chloride, Sulfate, nitrate, and Phosphate) and cations (Sodium, Ammonium, Potassium, Magnesium, Calcium) us-ing the protocol reported in detail by Sciare et al. (2007). The overall measurement uncertainty in the determination of ionic species is of the order of 5% and takes into account the filter blank variability, the filter extraction efficiency, and the calibration precision. The contribution of sea salt to the levels of SO2−4 , Ca2+and K+was estimated using their
cor-responding seawater mass ratios to Na+of 0.252, 0.038, and 0.037, respectively. Non-sea-salt potassium (nss-K) concen-trations reported later are those calculated in the fine aerosol mode (A.D.<1.5 µm) and represent on average more than 75% of nss-K bulk concentrations.
3.5 Gravimetric analysis
The Nuclepore filters from the SFUs were weighed at LSCE after 24 h equilibration at room temperature and RH be-low 10% to minimize the bias due to water uptake onto hy-drophilic aerosol species deposited on the filters. Measure-ments have been performed using a Mettler Microbalance UMT3 with 1 µg sensitivity. The uncertainty in the gravi-metric measurement is typically of the order of 10 µg, which represents here an average measurement uncertainty below 2% for particulate mass (PM) measurements in the fine and coarse size fractions.
3.6 Chemical Mass Closure (CMC)
The weekly SFU filter sampling covering a 3.5-year period (09/2001–04/2004), and co-located QMA filters sampled in parallel are used in the following to perform a CMC in the fine aerosol mode. All the hypotheses using here to perform the CMC were taken from the mass closure study reported in Sciare et al. (2005) for the MINOS campaign and are briefly reported here. Non-sea-salt-Calcium is used as a dust tracer and its concentrations, determined by IC, are divided by 0.09 to obtain mass concentration of dust. Sea salt sulfate (ss-SO4), potassium (ss-K), and calcium (ss-Ca) were calculated
using Na as reference and the SO4/Na, K/Na, and Ca/Na
ra-tios in bulk seawater. Finally sea salt was calculated using the following equation:
[seasalt]=1.326[Na]+[Cl]+[Mg] (2)
Mass Contribution of carbonaceous aerosols is derived us-ing EC(IMPROVE) and OC(IMPROVE). The mass contri-bution of particulate organic matter (POM) is estimated as-suming an OC-to-POM conversion factor of 1.8. Concentra-tions of EC and OC in the fine mode are estimated from bulk concentrations assuming that 70% and 90% of bulk OC and EC concentrations, respectively, are present in the fine mode. Based on these hypotheses, reconstruction of the particulate mass (PM) in the fine from CMC (PMCMC) is then calculated
as:
PMCMC=[EC]+[POM]
J. Sciare: Carbonaceous aerosols in the Eastern Mediterranean 5555
4 Results and discussion
4.1 Chemical Mass Closure of fine aerosols
Monthly mean concentrations of the major aerosol species, PM and PMCMCare given for the fine mode in Table 1 and
are calculated for the 3.5-year period, when SFU filter mea-surements are available (09/2001–04/2004). PMCMCdata
re-ported in this Table 1 stand for monthly mean of PMCMC
calculated from each individual filter sample.
On a yearly average, sulfate aerosols (NH+4+nss-SO2−4 ) are, by far, the major component in the fine mode, con-tributing to 50% of the PM mass; the carbonaceous aerosols (EC+POM) and primary particles (sea salt + dust) contribut-ing only to 29% and 19% of PM, respectively, for the same period. The mass contribution of organic matter (POM) to the total fine mass is found to be quite stable during the year (monthly average of 26±5%) despite the fact that the highest EC and OC concentrations are found for the summer months. The contribution of nitrate aerosols is not significant (0.05µg/m3on a yearly average) and can reasonably be ex-plained by the fact that the warmer temperatures of the East-ern Mediterranean are likely to prevent most of the time con-densation of semi-volatile ammonium nitrate. All these re-sults, and in particular the major role of sulfate aerosols, are consistent with those reported at the same location by Bar-douki et al. (2003) which are based on the chemical compo-sition of size-resolved atmospheric aerosols during summer and winter. A mean standard deviation of 0.7 ±0.5 µg/m3 (8.4±6.0%) is calculated between monthly mean PM and PMCMC(Table 1), demonstrating the consistencies of the
hy-potheses used in the CMC of fine aerosols (Sect. 3.6). The yearly PM average of 8.5 µg/m3obtained for the fine mode for the period (09/2001–04/2004) is close to the PM aver-age value of 10.1µg/m3 reported at the same location for a 2-year period (07/2004–07/2006) for submicron aerosols (A.D.<1 µm) obtained from aerosol samples collected using a Small-Deposit-area low-pressure-Impactor (Gerasopoulos et al., 2007).
Based on the PM contribution of sulfate and organic aerosols in the fine mode (of 50 and 26%, respectively, on a yearly average) and assuming that light scattering properties of sulfate aerosols will be enhanced by water uptake onto par-ticles in the humid environment of the Mediterranean, it may be assumed that sulfate aerosols (more than organics) will play a major role on the direct radiative forcing by aerosols in the Eastern Mediterranean. This statement is consistent with the light scattering coefficient contribution of 2/3 calculated by Sciare et al. (2005) for sulfate aerosols during the MI-NOS campaign. It is also consistent with the results reported by Vrekoussis et al. (2005) who have noticed significant cor-relations between nss-SO4and light scattering coefficient for
the remote marine atmosphere of the Eastern Mediterranean. Although the light scattering contribution of organics is ex-pected to be rather small (relatively to sulfates) over the E.
Figure 2:
0 1 2 3 4 5 6 0 1 2 3 4 5 6 7 8 9 10 11 12 M.O.Y. L ig h t A b s o rp tio n c o e ffic ie n t (b ab s ), M m -1 Fe concent rat ion, µ g /m 3 babs (Aethalo.)babs (Aethalo.) corrected from babs(Fe2O3)
Fe
babs (Fe2O3)
Fig. 2. Seasonal variations of iron concentration in dust aerosols and light absorption measurements obtained from aethalometer (babs(AETHALO)) corrected and uncorrected from the light
ab-sorption due to dust aerosols (babs(Fe2O3)). Grey bands refer to the
two biomass burning periods (March/April) and (July–September).
Mediterranean, the role of black carbon on aerosol absorp-tion properties is expected to be quite significant. For this reason, the emphasis is given on EC concentration levels, variability and origin, in the next section.
4.2 Light absorption coefficient babs
The high loadings of Saharan dust aerosols over the Mediter-ranean are expected to play a significant role on the light ab-sorbing properties of aerosols due to the presence of hematite (Fe2O3) in dust particles. Dust aerosol absorption may be
then deduced from the light absorption coefficient (babs)
measurements performed by the aethalometer. The correc-tion referring to the absorpcorrec-tion of dust aerosols can be written as:
babs(Fe2O3) = αFe2O3×[Fe2O3] (4) where [Fe2O3] refers to the atmospheric concentration of
hematite in dust aerosols (in µg/m3) and αFe2O3 to the light absorption cross-section of hematite. Assuming that the ma-jor fraction of iron is found in dust aerosols as hematite, equation (4) can be re-written using [Fe] and αFe (instead
of [Fe2O3] and αFe2O3). Concentrations of Fe in our sam-ples were derived from an [Fe]/[nss-Ca2+] mass ratio of 0.52 found in dust aerosols collected in Crete (Sciare et
5556 J. Sciare: Carbonaceous aerosols in the Eastern Mediterranean
Table 2. Intercomparison of soot carbon measurements from 4 different methods: Two thermo-optical techniques (IMPROVE, NIOSH), one optical (AETHALO), and one thermal (2-STEP). (σ ) stands for the precision as defined by Lewtas et al. (2001)
Y vs X N Period Slope Intercept µgC/m3 r2 X Average µgC/m3 (X-Y) bias µgC/m3 σ µgC/m3 σ% EC(NIOSH) vs 151 (09/2001–04/2004) & 0.80±0.04 0.03±0.02 0.68 0.33 0.06 0.10 32.4 EC(IMPROVE) (10/2005–12/2006) 0.86±0.02 0 0.67 BC(AETHALO) vs 257 (09/2001–10/2005) 1.16±0.04 0.06±0.02 0.76 0.34 0.10 0.07 18.27 EC(IMPROVE) 1.29±0.02 0 0.75 EC(2-STEP) vs 61 (09/2001–03/2003) 1.54±0.22 0.01±0.08 0.46 0.32 0.16 0.22 53.0 EC(IMPROVE) 1.56±0.09 0 0.46 BC(AETHALO) vs 86 (09/2001–04/2004) 1.09±0.09 0.13±0.02 0.65 0.24 0.11 0.13 40.5 EC(NIOSH) 1.54±0.05 0 0.52
al., 2005 and Mihalopoulos et al., unpublished results) and [nss-Ca2+] obtained from the IC analysis of SFU filters. A light absorption cross-section of 2.55 m2g−1(at 550 nm) was obtained from the elemental iron calibration constant KFe of 0.234±0.022 µm4m2g−1 determined by Fialho et
al. (2005) for Saharan dust aerosols. Seasonal variations of babs(Fe2O3), babs(AETHALO) and [Fe] were derived from
the 3.5-year period when SFU filter measurements were available and are given in Fig. 2. The difference between babs(AETHALO) and babs(Fe2O3) is also shown in this
fig-ure and stands for the corrected babs(AETHALO). The light
absorption coefficient due to dust aerosols shows a weak seasonal variation with a minimum of 0.5 Mm−1during the summer months and two maxima of the order of 0.8 Mm−1in
spring and fall, respectively. This seasonal variation is in ac-cordance with the seasonal variations of air mass origin with the highest occurrence during both spring and fall (Fig. 1). As depicted in Fig. 2, light absorption coefficient due to dust aerosols is observed during the whole year and represents 12.6±3.5% of the light absorption coefficient measured by the aethalometer on a yearly basis. It should be noted that the contribution of dust aerosols can account for more than half of the light absorption coefficient during short but in-tense dust events (Vrekoussis et al., 2005).
4.3 Comparison of BC measurements from different ana-lytical protocols
Each dataset of EC measurements obtained using thermo-optical (IMPROVE & NIOSH), thermo-optical (AETHALO), and thermal (2-STEP) methods has been compared by linear regression analysis. In this analysis, both the regression-calculated intercept and a slope with a zero intercept were calculated. The results of these various statistical analyses are given in Table 2. Precision (σ ) is defined following the equation reported in Lewtas et al. (2001). Periods of compar-ison are also reported in the Table, as all the methods were not available for the duration of the study. BC concentrations derived from aethalometer and reported in Table 2 were not corrected for dust absorption influence, since iron
measure-ments were available only for the period (09/2001–04/2004). As shown in this Table, comparison between the two thermo-optical methods is not satisfactory as r2and precision (σ ) were found to be 0.68 and 32.4%, respectively. In addi-tion, EC(NIOSH) concentrations were 15–20% lower com-pared to EC(IMPROVE). This discrepancy might originate from the primary difference between the two thermo-optical protocols which is the allocation, at the NIOSH protocol, of carbon evolving at 870◦ temperature in a helium atmo-sphere to OC rather than to EC (Chow et al., 2001). The most probable explanation of such whitening of the filter is that mineral oxides from dust aerosols – deposited on the fil-ter – are supplying oxygen to neighboring carbon particles at this high temperature (Sciare et al., 2003b). Interestingly, the best correlation coefficient and precision for EC measure-ments are found between IMPROVE and AETHALO meth-ods (r2=0.76, σ =18.3%), whereas the comparison between NIOSH and AETHALO methods is much less satisfactory (r2=0.65, σ =40.5%). This result confirms that the IMPROVE protocol relates in a more quantitative way the light absorb-ing properties of BC in our Mediterranean samples.
Comparison between IMPROVE and 2-STEP protocols showed the lowest correlation coefficient and precision (r2=0.46, σ =53.0%) with the EC levels from the 2-STEP method being 50% higher. This poor agreement is somehow expectable considering the major discrepancies that have been observed between these two methods during the MI-NOS campaign (Sciare et al., 2003b) and that have pointed out a more-pronounced sensivity of the EC(2-STEP) to com-bustion aerosols of fossil fuel origin (rather than of biomass burning origin).
4.4 Seasonal variation of black carbon: evidence of biomass burning
Agriculture waste burning and forest fires are likely to present an important temporal and interannual variability mainly related to weather conditions. This variability may shift the maximum of biomass burning for several weeks. To
J. Sciare: Carbonaceous aerosols in the Eastern Mediterranean 5557
Figure 3:
0.0 0.1 0.2 0.3 0.4 0.5 0.6 0 1 2 3 4 5 6 7 8 9 10 11 12 MOY EC & BC, µ g C/ m 3 0 25 50 75 nss-K , ng/ m 3 EC (2-STEP) BC (AETHALO) EC (IMPROVE) EC (NIOSH) nss-K M.O.Y.Fig. 3. Weighed seasonal variations of EC concentrations de-rived from two thermo-optical (IMPROVE and NIOSH) one op-tical (AETHALO) and one thermal (2-STEP) protocol. Non-sea-salt potassium (nss-K) concentrations are those from the fine mode (<1.5 µm). Grey bands refer to the two biomass burning periods (March/April) and (July–September).
take into account this variability a smoothing was applied to monthly mean concentrations following the equation: Ci=(2 × Ci+Ci−1+Ci+1)/4 (5)
where Ci stands for the smoothed monthly mean
concentra-tion of species C for the month i. Ci−1, Ci and Ci+1 are
the monthly averages corresponding to month i minus one, month i and month i plus one, respectively.
Temporal variations of EC from the four different analyt-ical methods described previously are given on a seasonal basis in Fig. 3, for the periods when these measurements are available (report to Table 1). Seasonal variations of nss-K are also given in this figure and show that two periods of the year are influenced by biomass burning, the early spring (March/April) and the summer months (July/September). Despite the discrepancies observed between the different EC measurements techniques, all measurements exhibit the two peaks of biomass burning periods although of different strengths.
Several observations were used in the following to bet-ter depict the origin of the two distinct periods of biomass burning (early spring and summer). First, hotspots/fire map products were obtained using data from the MODIS (Moder-ate Resolution Imaging Spectroradiometer) instrument and were downloaded from the web fire mapper built by the NASA funded Fire Information for Resource Management
35
Jul.-Sep.
Oct.-Dec.
Mar.-Apr.
Jan.-Feb.
May-Jun.
Figure 4:
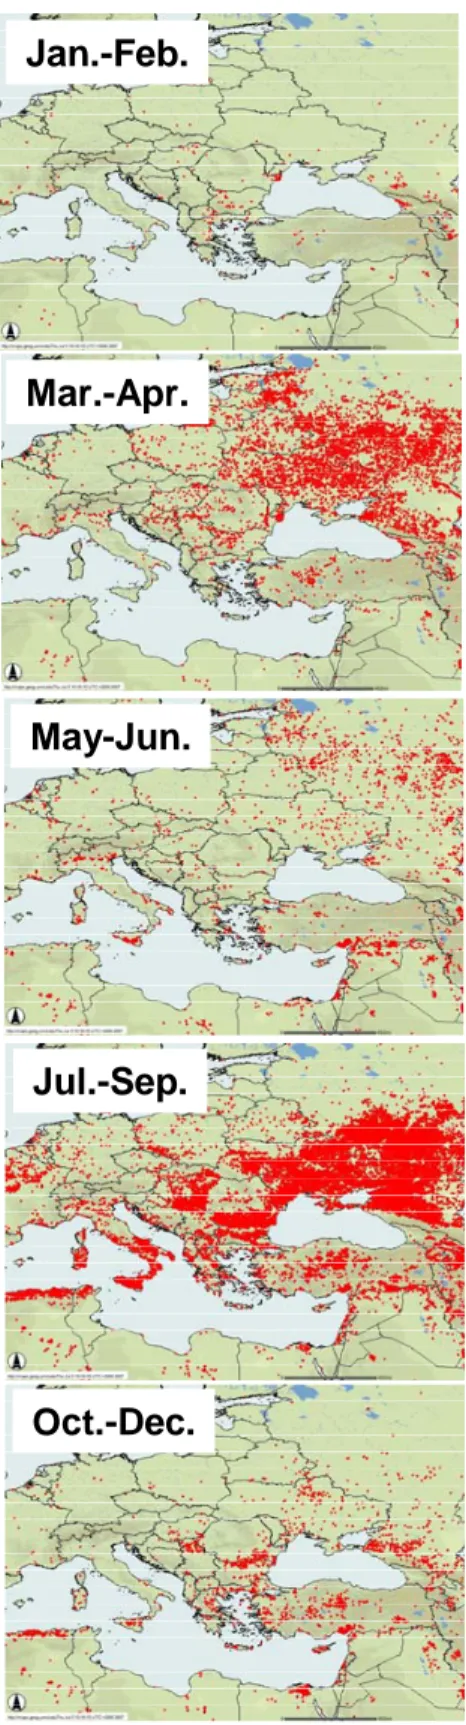
Fig. 4. Hotspot fire maps (FIRMS data) for the year 2004.
System (FIRMS, http://maps.geog.umd.edu/firms/). These hotspots/fire maps are given in Fig. 4 for different peri-ods of the year 2004 and point out important fires in the
5558 J. Sciare: Carbonaceous aerosols in the Eastern Mediterranean Year OC, µgC/m 3 EC, µgC/m 3 nss-K, ng/m 3 Figure 5: 0 25 50 75 100 125 nss-K nss-K (seasonalised) 0.0 0.5 1.0 1.5 2.0 2.5 3.0 3.5 2001 2002 2003 2004 2005 2006 2007 OC OC (seasonalised) 0.0 0.1 0.2 0.3 0.4 0.5 EC EC (seasonalised)
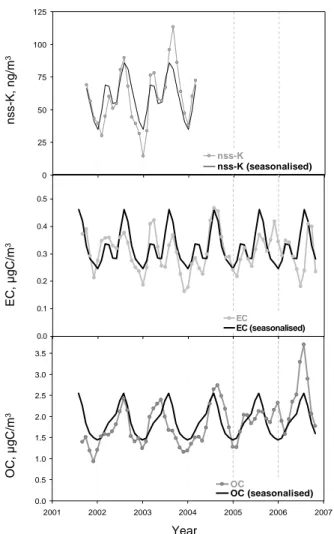
Fig. 5. Temporal variations of monthly mean EC and OC (IM-PROVE) and nss-K concentrations in Crete Isl. Seasonalised varia-tions of these compounds derived from Eq. (5) are reported in black lines.
surrounding regions of the Black Sea (Bulgaria, Romania, Moldavia, Ukraine, and Russia). Two periods with an in-creasing number of fire spots are clearly visible in this fig-ure that correspond to the same periods reported previously (early spring and summer). Similar patterns can be obtained from the study of map products for other years (2001–2006) with, however, strong interannual variability in the number of hotspots/fires. These fires are likely to correspond to agricul-tural waste burning practices (post-harvesting for the summer months) and they are in agreement with the results reported by Van der Werf et al. (2006) for monthly fire emissions over Europe derived from satellite and model data. These biomass burning emissions from countries bordering the Black Sea are expected to have a significant impact over the E. Mediter-ranean since they are located in the northern wind sector of Crete Isl. which has the highest occurrence at the monitor-ing station (Fig. 1). Consequently, the stronger maximum of EC observed during summertime may originate from the higher occurrence of North sectors during this season.
Alter-natively, the occurrence of fire spots shown in Fig. 4 is higher for the period July-September than for the period March– April and could also explain the intensity of our two EC and nss-K maxima in Fig. 3.
Multi-year Aerosol Optical Depth (AOD) measurements available in Moldova (i.e. within the region affected by the major fire spots reported in Fig. 4) and in Northern Greece (i.e. at half way between this region and our receptor site) were also used to assess the extent of biomass burning emis-sions over the E. Mediterranean. AOD, Angstrom exponent and Absorption measurements obtained at the Moldovan sta-tion (Aculinin et al., 2004 and AERONET almucantar re-trieval products) exhibit very similar seasonal patterns with two concomitant peaks in March–April and July–September (data not show here). These results strongly suggest that the major aerosol source in Moldova at these two periods could be of combustion (biomass burning) origin. Similar results are obtained from AOD measurements in Northern Greece (Kazadzis et al., 2007) when air masses originating from the regions surrounding the Black Sea are investigated. All these optical measurements gathered with the seasonal EC vari-ations in Crete contribute to the idea that biomass burning aerosols emitted in the regions surrounding the Black Sea are likely to significantly impact the aerosol absorbing prop-erties in remote areas of E. Mediterranean located as far as 1500–2000 km downwind. Further evidence of these large-scale biomass-burning aerosol emissions from Eastern Eu-rope was also found by Niemi et al. (2004, 2005), Arola et al. (2007), Saarikoski et al. (2007), and Stohl et al. (2007) over Northern Europe (Finland) and Arctic zone.
4.5 Temporal variability of carbonaceous aerosols
EC and OC concentrations obtained from the IMPROVE method are used in the following to investigate the temporal variability of carbonaceous aerosols as well as their different origins. This choice is motivated primarily by the fact that this IMPROVE method is less affected by analytical artifacts due to dust aerosols and that it shows the best agreement with absorption (AETHALO) measurements. Finally, this is the only time series of EC and OC that covers the entire sampling period. The monthly mean variations of EC(IMPROVE) and OC(IMPROVE) are reported in Fig. 5 for the 5-year period (09/2001–12/2006) together with 3.5-year record of nss-K. Seasonal variations of these compounds derived from equa-tion (5) are also reported in the same figure to better highlight their important year-to-year variations. The important sea-sonal and interannual variations observed for both EC and OC can possibly be explained by the occurrence of North wind sectors, but also by the fact that biomass burning emis-sions, by nature, often last for short periods (typically less than a couple of days). These fugitive emissions are also known to have very important seasonal and interannual vari-ations (van der Werf et al., 2006).
J. Sciare: Carbonaceous aerosols in the Eastern Mediterranean 5559 Interestingly, the two peaks of biomass burning coincide
with increase of nss-K+ and EC and not with OC
con-centrations that exhibit one broad peak during the summer months. Other contributions than biomass burning should then account for this OC peak and could possibly originate from the formation of secondary organic aerosols (of bio-genic/anthropogenic origin) as this season is associated with more intense photochemistry. Deconvolution of carbona-ceous aerosols sources is tentatively performed in the next section to better characterize sources for organic aerosols other than biomass burning.
4.6 Deconvolution of the source origin of carbonaceous aerosols
Time duration of the fugitive emissions of biomass burning is expected to differ significantly at the sampling station from the more permanent and homogeneous anthropogenic fossil fuel emissions. Based on the time limited duration of these biomass burning episodes, and using the temporal resolution of filter sampling, each biomass burning event was isolated from the whole dataset using an arbitrary threshold nss-K concentration of 50 ng/m3, corresponding to a round aver-age using the monthly mean nss-K concentrations for May and June (Fig. 3), two months which are poorly affected by biomass burning (Fig. 4). Each filter batch with nss-K con-centrations higher than 50 ng/m3was then defined as affected by biomass burning.
Data selection was then performed when nss-K is avail-able (09/2001-04/2004) and 50% of the whole initial dataset (i.e. 53 samples) has been consequently retained and used to calculate non-biomass burning concentrations of EC and OC (noted later as background EC* and background OC*). Sea-sonal variations of EC* and OC* were then calculated using the smoothing of equation (5). Smoothed seasonal variations of EC and OC during the periods impacted by biomass burn-ing origin (noted later as bb-EC and bb-OC) were then cal-culated on a monthly basis as:
bb−EC=EC(IMPROVE)−EC ∗ (6)
bb−OC=OC(IMROVE)−OC ∗ (7)
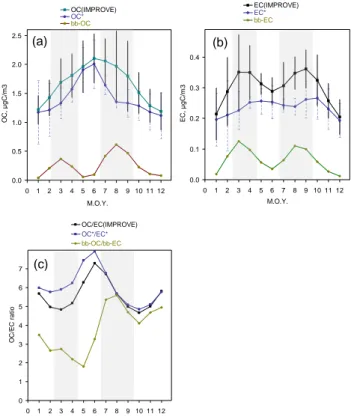
The hypothesis used for this deconvolution assumes that carbonaceous aerosol concentrations result from the addition of the two different and independent sources (background and biomass burning) and that this mixing will not further alter the composition/concentration of each source. Thus, it is assumed that OC/EC ratios for each source will remain unchanged with no extra formation of SOA due to the mix-ing of the two sources. The seasonal cycles of background (EC* and OC*) and biomass burning (bb-EC and bb-OC) carbonaceous aerosols and corresponding OC/EC ratios are presented in Fig. 6 with 1 standard deviation (1σ ) and are discussed below. 0 1 2 3 4 5 6 7 0 1 2 3 4 5 6 7 8 9 10 11 12 M.O.Y. O C /E C ra ti o OC/EC(IMPROVE) OC*/EC* bb-OC/bb-EC 0.0 0.5 1.0 1.5 2.0 2.5 0 1 2 3 4 5 6 7 8 9 10 11 12 M.O.Y. OC , µ g C /m 3 OC(IMPROVE) OC* bb-OC 0.0 0.1 0.2 0.3 0.4 0 1 2 3 4 5 6 7 8 9 10 11 12 M.O.Y. EC , µg C /m 3 EC(IMPROVE) EC* bb-EC Figure 6: (a) (b) (c)
Fig. 6. Seasonal variations of EC, OC, and OC/EC derived from the IMPROVE temperature program, biomass burning (noted with bb-), and non-biomass burning (noted with *). Error bars stand for 1 standard deviation (1σ ). Grey bands refer to the two biomass burning periods (March/April) and (July–September).
4.6.1 Biomass burning carbonaceous aerosols
The choice of a threshold value of 50 ng/m3for nss-K may be critical and can potentially alter the levels of deconvo-luted bb-EC and bb-OC. Several sensitivity tests have been performed for that purpose, using different nss-K threshold values ranging from 40 to 60 ng/m3. These two limit val-ues correspond to a restrained dataset (free of biomass burn-ing events) that represents roughly 1/3 and 2/3 of the initial dataset, respectively. By varying the threshold value from 40 to 60 ng/m3, the levels of bb-EC and bb-OC were found to remain almost unchanged (compared to those obtained with a threshold value of 50 ng/m3) with month-to-month devi-ations of ±0.01 and ±0.04 µgC/m3, respectively. Then, it appears that results on the seasonal variations of both bb-EC and bb-OC are not significantly altered by the choice of a threshold value of 50 ng/m3for nss-K and give further con-fidence on the levels of bb-EC and bb-OC that are presented here.
As shown in Fig. 6, both bb-EC and bb-OC show a very similar seasonal cycle although they have been calculated in-dependently. The observed two maxima (early spring and summer months) coincide exactly with our previous obser-vations on the seasonality of biomass burning emissions.
5560 J. Sciare: Carbonaceous aerosols in the Eastern Mediterranean 38 y = 0.42x + 0.08 R2 = 0.91 0 1 2 3 4 0 1 2 3 4 5 6 7 8 9 OC, µgC/m3 WSO C , µ g C /m 3 Figure 7: 1:1 N= 49
Fig. 7. OC versus WSOC for bulk aerosol samples collected during the period (10/2005–07/2006).
Although biomass burning is clearly identified as the only source responsible for the major seasonal variation of EC, its contribution on a monthly mean basis is quite variable, rang-ing from 6 to 40% (20±10% on average) with two maxima in March and August. Although biomass burning aerosols are characterized by high levels of OC relatively to EC, their contribution to the measured OC levels is slightly lower (compared to BC) with monthly mean values ranging from 3 to 32% (14±10% on average) and a maximum for Au-gust. Noteworthy these calculations are averaged on a 3.5-year period (09/2001–04/2004) and are expected to exhibit much more variability on a seasonal or interannual basis, de-pending on the source strength of biomass burning. The cal-culated bb-OC/bb-EC ratio is 3.8±1.3 on a yearly average but shows an important seasonal variation with average val-ues from 2.6 to 5.6 for winter and summer, respectively. Al-though this ratio is known to be highly variable depending on the different combustion stages (from flaming to smolder-ing), it is rather small compared to wood burning ratios com-monly reported in the literature. Discrepancies between these two different ratios are even larger if we consider that the biomass burning aerosols collected in Crete have been highly processed during their transport, probably leading to an in-crease of the initial OC/EC ratio resulting from condensation of secondary organic aerosols (oxidation and condensation of biomass burning emitted VOCs). On the other hand, several studies have reported that open agricultural waste burning is likely to produce rather low OC/EC ratios ranging from 2.4 for wheat crop residuals (Hays et al., 2005) to 4.8 (Andreae and Merlet, 2001). Despite the different analytical protocols used for the determination of OC and EC, the OC/EC ratios reported in the literature are in the range of those reported here and fit with our findings on the agriculture origin of our biomass burning aerosols.
4.6.2 Background carbonaceous aerosols (EC* and OC*) Background carbonaceous aerosols can originate from vari-ous anthropogenic and natural sources. Fossil fuel is
prob-ably a major source for EC* over the E. Mediterranean in which coal burning should be a significant contributor as pre-viously reported for SO2in this region (Zerefos et al., 2000;
Sciare et al., 2003a). As shown in Fig. 6, the seasonal varia-tion of EC* remains fairly constant with a yearly average of 0.24±0.04 µgC/m3, which is consistent with the general idea that fossil fuel emissions should be more or less the same during the year.
The seasonal variation of the OC*/EC* ratio (Fig. 6) shows a sharp peak of 7.9 for the late spring (June) and a min-imum of 4.8 for the month of October. The variations of this ratio are almost entirely related to OC* as the levels of EC* remain quite stable over the year. Contrary to EC*, the origin of OC* is more uncertain and a significant secondary origin could account for the seasonal variation of OC* which ex-hibits maximum values in late spring. Such seasonal pattern is not related in EC* and thus should originate from other sources. Secondary aerosol formation driven by photochem-istry could be proposed to explain the OC* peak value in May-June. On the other hand, it hardly explains why OC* is decreasing during summer, when photochemistry is at its maximum. Alternatively, a temperature driven mechanism leading to a volatilization of organic aerosols could be pro-posed as the summer months in Crete Isl. are characterized by high temperatures (typically higher than 35◦at mid-day).
4.7 WSOC
Assuming that a significant fraction of SOA originating from gas-to-particle formation can be related to WSOC (Weber et al., 2007; Kondo et al., 2007), a significant seasonal varia-tion of the WSOC/OC ratio should be expected with a max-imum during the summer months. This is not observed here since a quite stable sample-to-sample WSOC/OC ratio of 0.45±0.12 was found for whole period when WSOC is avail-able (10/2005–07/2006). This lack of seasonal pattern in the WSOC/OC ratio is further confirmed by the very good agree-ment found between WSOC and OC measureagree-ments (r2=0.91, Fig. 7). This result indicates that the OC* increase (relative to EC*) observed in May-June (Fig. 6) is almost equally com-posed of water soluble and insoluble organic material. In other words, if this OC* increase is due to SOA formation, it implies that this SOA comprise almost equally water insolu-ble and water soluinsolu-ble organic material, which is in contradic-tion with the previous studies suggesting that SOA is mainly composed of WSOC.
Similarly, biomass burning aerosols collected at our site seem to weakly affect the WSOC/OC ratio. All these re-sults show the complexity of organic sources and ageing in the Mediterranean and point out the need for more time- and size-resolved measurements of BC, OC, and WSOC in order to further make conclusions on the mechanisms responsible for the enhancement of organic aerosols in late spring / early summer.
J. Sciare: Carbonaceous aerosols in the Eastern Mediterranean 5561
5 Conclusions and perspectives
Long-term (5-year) measurements of carbonaceous (EC, OC) aerosols were reported here for the first time in the Mediterranean Basin (Crete Island). Light absorbing dust aerosols have shown to weakly contribute to the light scat-tering coefficient (babs) measurements performed by an
aethalometer (+12% on a yearly average). Comparison of soot carbon measurements performed with 4 different ana-lytical protocols (2 thermo-optical, 1 optical, 1 thermal) have shown important discrepancies from one method to another. However, their seasonal trends were found to be quite similar showing two peaks (early spring and summer) correspond-ing to long-range transported biomass burncorrespond-ing aerosols orig-inating from apart to agriculture (post-harvest wheat resid-ual) waste burning in the countries surrounding the Black Sea (i.e. at 1000–2000 km upwind of Crete). The contri-bution of biomass burning to the concentrations of EC and OC have been shown to be rather small on a yearly ba-sis (20 and 14%, respectively) but could be significant for some months (34 and 32% of EC and OC, respectively, for the month of August) and are expected to present a strong seasonal/interannual variability. Noteworthy, these biomass burning aerosols are expected to have an even more impor-tant impact at the emission sources (mainly in Ukraine and surroundings countries) as observed from Aerosol Optical Depth measurements performed in Moldova.
Rabbinge and van Diepen (2000) suggested that the wheat yields in Ukraine have the potential to double, at least in the long run. As this country has the largest agriculture land area in Europe (FAO, 2003) and the highest European val-ues for energy-crop potential (Ericsson & Nilsson, 2006), agriculture (wheat crop residual) waste burning in this re-gion is likely to represent a non-negligible source of com-bustion aerosols in the near future. Large emissions from biomass burning aerosols and corresponding influence on aerosol radiative forcing over the Ukraine and downwind re-gions (including the E. Mediterranean) is thus expected to remain significant for the coming years and should be taken into account in modeling studies of EC and OC over Europe. A quite similar statement can be provided for carbonaceous aerosols of fossil fuel origin. European countries bordering the Black Sea have particularly high SO2 emissions,
con-tributing to more than one third of the total SO2emissions
reported over Europe in 2004 (Vestreng et al., 2007). Al-though SO2emissions from these countries have drastically
decreased in the nineties, they are expected to slightly in-crease (+10%) at the end of 2010. It is likely that levels of carbonaceous aerosols having the same origin as SO2 will
remain high the coming years.
By removing the biomass burning influence, an important seasonal variation of organic aerosols was observed, with an increase by almost a factor of two for the spring months of May and June. Our preliminary measurements of WSOC have shown that the WSOC/OC ratio of 0.45±0.12 remains
unchanged, suggesting that water soluble and water insoluble organic matter do contribute almost equally to OC through-out the year.
All these results contribute to the general idea that E. Mediterranean has a complex mixture of highly processed carbonaceous aerosols of various origins. Further efforts will be required in the future to better characterize these carbona-ceous aerosols as they may significantly alter the overall ra-diative forcing over the Mediterranean Sea and downwind regions.
Acknowledgements. This work has been funded by EGIDE (French
Ministry of Foreign Affairs), EU-ACCENT program and partially by EU-ADIOS program, ECPL, CEA, and CNRS. The authors want to express their acknowledgement to the two anonymous reviewers for their suggestions and remarks and the ECPL team involved in the filter sampling and analysis.
Edited by: V.-M. Kerminen
References
Aculinin, A., Holben, B., Smirnov, A., and Eck, T., Measurements of aerosol optical properties at the Kishinev site, Moldova, Mol-davian J. of Phys. Sci., 3, 2, 2004.
Andreae, M.O., and Merlet, P., Emission of trace gases and aerosols from biomass burning. Global Biogeochem. Cycles, 15, 955– 966, 2001.
Arola, A., Lindfors, A., Natunen, A., and Lehtinen, K. E. J., A case study on long-range transported aerosols of biomass burning: ef-fects on aerosol optical properties and surface radiation levels, Atmos. Chem. Phys., 7, 4257-4266, 2007
Bardouki, H., Liakakou, H., Economou, C., Sciare, J., Smolik, J., Zdimal, V., Eleftheriadis, K., Lazaridis, M., Dye, C., and Mi-halopoulos, N., Chemical composition of size-resolved of atmo-spheric aerosols in the Eastern Mediterranean during summer and winter, Atmos. Environ., 37, 195-203, 2003.
Barnaba, F., and Gobbi, G. P., Aerosol seasonal variability over the Mediterranean region and relative impact of maritime, continen-tal and Saharan dust particles over the basin from MODIS data in the year 2001, Atmos. Chem. Phys., 4, 2367–2391, 2004, http://www.atmos-chem-phys.net/4/2367/2004/.
Birch, M.E., Cary, R.A., Elemental carbon-base method for mon-itoring occupational exposures to particulate diesel exhaust, Aerosol Sci. Technol., 25, 221-241, 1996.
Bonnet, S. and Guieu, C., Atmospheric forcing on the annual iron cycle in the western Mediterranean Sea: A 1-year survey, J. of Geophys. Res., 111, 2006.
Bryant, C., Eleftheriadis, K., Smolik, J., Zdimal, V., Mihalopou-los, N., and Colbeck, I., Optical properties of aerosols over the eastern Mediterranean, Atmos. Environ., 40, 6229–6244, 2006. Cachier, H., Br´emond, M.P., Buat-M´enard, P., Determination of
atmospheric soot carbon with a simple thermal method. Tellus 41B, 379-390, 1989.
Chow, J.C., Watson, J.G., Pritchett, L.T., Pierson, W.R., Frazier, C.A., and Purcell, R.G., The DRI Thermal/Optical Reflectance Carbon Analysis System : Evaluation and Applications in U.S. Air Quality Studies, Atmos. Environ., 27A, 1185-1201, 1993.
5562 J. Sciare: Carbonaceous aerosols in the Eastern Mediterranean Chow, J.C., Watson, J.G., Crow, D., Lowenthal, D. H., and
Merri-field, T., Comparison of IMPROVE and NIOSH carbon measure-ments, Aer. Sci. Technol., 34, 23-34, 2001.
Draxler, R.R., and Hess, G.D., An overview of the HYSPLIT 4 modelling system for trajectories, dispersion and deposition, Aust. Met. Mag. 47, 295-308, 1998.
Ericsson, K., and Nilsson, L.J., Assessment of the potential biomass supply in Europe using a resource-focused approach, Biomass and Bioenergy 30, 1–15, 2006.
FAO, FAOSTAT Agriculture Data, Food and Agricultural Organi-zation, the Statistics Division, 2003.
Fialho, P., Hansen, A. D. A., et al. Absorption coefficients by aerosols in remote areas: a new approach to decouple dust and black carbon absorption coefficients using seven-wavelength Aethalometer data, J. Aerosol Sci., 36, 267-282, 2005.
Guieu, C., Bonnet, S., and Wagener, T., Lo¨ye-Pilot, M.D, Biomass burning as a source of dissolved iron to open ocean? Geophys. Res. Let., 32, L1960810.1029/2005GL022962, 2005.
Gerasopoulos, E., Kouvarakis, G., Vrekoussis, M., Donoussis, C., Mihalopoulos, N., and Kanakidou, M., Photochemical ozone production in the Eastern Mediterranean , Atmos. Environ., 40, 3057-3069, 2006.
Gerasopoulos, E., Koulouri, E., Kalivitis, N., Kouvarakis, G., Saarikoski, S., M¨akel¨a, T. Hillamo, R., Mihalopoulos, N., Size-segregated mass distributions of aerosols over Eastern Mediter-ranean: seasonal variability and comparison with AERONET columnar size-distributions, Atmos. Chem. Phys., 7, 2551-2561, 2007,
http://www.atmos-chem-phys.net/7/2551/2007/.
Hansen, A.D.A., Rosen, H., and Novakov, T., Real-Time measure-ment of the absorption coefficient of aerosol particles, Appl. Opt., 21, 3060-3062, 1982.
Hays, M.D., Fine, P.M., Geron, C.D., Kleeman, M.J., and Gullett, B.K., Open burning of agricultural biomass: Physical and chem-ical properties of particle-phase emissions, Atmos. Environ., 39, 6747–6764, 2005.
Kazadzis, S., Bais, A., Amiridis, V., Balis, D., Meleti, C., Kouremeti, N., Zerefos, C. S., Rapsomanikis, S., Petrakakis, M., Kelesis, A., Tzoumaka, P., and Kelektsoglou, K., Nine years of UV aerosol optical depth measurements at Thessaloniki, Greece, Atmos. Chem. Phys., 7, 2091–2101, 2007,
http://www.atmos-chem-phys.net/7/2091/2007/.
Kondo, Y., Miyazaki, Y., Takegawa, N., Miyakawa, T., Weber, R. J., Jimenez, J. L., Zhang, Q., and Worsnop, D. R., Oxygenated and water-soluble organic aerosols in Tokyo, J. Geophys. Res., 112, D01203, 2007.
Kouvarakis G., Tsigaridis K., Kanakidou M., and N. Mihalopoulos, Temporal variations of surface regional background ozone over Crete Island in the Southeast Mediterranean. J. Geophys. Res., 105, 4,399 - 4,407, 2000.
Lelieveld , J. H. Berresheim, S. Borrmann, P. J. Crutzen, F. J. Den-tener, H. Fischer, J. Feichter, P. J. Flatau, J. Heland, R. Holzinger, R. Korrmann, M. G. Lawrence, Z. Levin, K. M. Markowicz, N. Mihalopoulos, A. Minikin, V. Ramanathan, M. de Reus, G. J. Roelofs, H. A. Scheeren, J. Sciare, H. Schlager, M. Schultz, P. Siegmund, B. Steil, E. G. Stephanou, P. Stier, M. Traub, C. Warneke, J. Williams, H. Ziereis, Global Air Pollution Cross-roads over the Mediterranean, Science, 298, 794-799, 2002. Lewtas, J., Pang, Y. B., et al., Comparison of sampling methods
for semi-volatile organic carbon associated with PM2.5, Aerosol Sci. and Technol. 34, 9-22, 2001.
Markowicz, K.M., Flatau, P.J., Ramana, M.V., Crutzen, P.J., Ra-manathan, V., Absorbing Mediterranean aerosols lead to a large reduction in the solar radiation at the surface, Geophys. Res. Lett., 10.1029/2002GL015767, 2002.
Meloni, D., di Sarra, A., et al., Aerosol optical properties at Lampe-dusa (Central Mediterranean). 2. Determination of single scatter-ing albedo at two wavelengths for different aerosol types, Atmos. Chem. Phys., 6, 715-727, 2006,
http://www.atmos-chem-phys.net/6/715/2006/.
NIOSH, Elemental Carbon (Diesel exhaust). In NIOSH Manual of Analytical Methods. National Institute of Occupational Safety and Health. Cincinnati, OH, 1996.
NIOSH Method 5040, In NIOSH Manual of Analytical Meth-ods (NMAM), 4t h ed., 2nd Supplement, ed. Cassinelli M.E., O’Connor P.F. [Supplement to DHHS (NIOSH) Publication No. 94-113], 1998.
Niemi, J., Tervahattu, H., Vehkamaki, H., Kulmala, M., Koskentalo, T., Sillanpaa, M., Rantamaki, M., Characterization and source identification of a fine particle episode in Finland, Atmos. Envi-ron., 38, 5003-5012, 2004.
Niemi, J., Tervahattu, V., H., et al., Characterization of aerosol par-ticle episodes in Finland caused by wildfires in Eastern Europe, Atmos. Chem. and Phys., 5, 2299-2310, 2005.
Rabbinge, R., and van Diepen, C.A., Changes in agriculture and land use in Europe, Euro. J. of Agron., 13, 85–99, 2000. Saarikoski, S., Sillanpaa, M., et al., Chemical composition of
aerosols during a major biomass burning episode over northern Europe in spring 2006: Experimental and modeling assessments, Atmos. Environ., 41, 3577-3589, 2007.
Sciare, J., Bardouki, H., Moulin, C., and Mihalopoulos, N., Aerosol sources and their contribution to the chemical composition of aerosols in the Eastern Mediterranean Sea during summertime, Atmos. Chem. Phys., 3, 291-302, 2003a,
http://www.atmos-chem-phys.net/3/291/2003/.
Sciare, J., Cachier, H., Oikonomou, K., Ausset, P., Sarda-Est`eve, R., and Mihalopoulos, N., Characterization of Carbonaceous Aerosols during the MINOS campaign in Crete, July-August 2001: a multi-analytical approach, Atmos. Chem. Phys., 3, 1743-1757, 2003b,
http://www.atmos-chem-phys.net/3/1743/2003/.
Sciare, J., Oikonomou, K., Cachier, H., Mihalopoulos, N., Andreae, M. O., Maenhaut, W., and Sarda-Est`eve, R., Aerosol mass clo-sure and reconstruction of the light scattering coefficient over the Eastern Mediterranean Sea during the MINOS campaign, Atmos. Chem. Phys., 5, 2253–2265, 2005,
http://www.atmos-chem-phys.net/5/2253/2005/.
Sciare, J., Cachier, H., Sarda-Est`eve, R., Yu, T., Semi-volatile aerosols in Beijing (R.P. China): Characterization and contribu-tion to various PM2.5, J. Geophys. Res., 112 (D18), D18202, 2007.
Stohl, A., Berg, T., Burkhart, J. F., Fjæraa, A. M., Forster, C., Her-ber, A., Hov, Ø., Lunder, C., McMillan, W. W., Oltmans, S., Shiobara, M., Simpson, D., Solberg, S., Stebel, K., Str¨om, J., Tørseth, K., Treffeisen, R., Virkkunen, K., Yttri, K. E.: Arctic smoke record high air pollution levels in the European Arctic due to agricultural fires in Eastern Europe, Atmos. Chem. Phys., 7, 511–534, 2007,
J. Sciare: Carbonaceous aerosols in the Eastern Mediterranean 5563 http://www.atmos-chem-phys.net/7/511/2007/.
Van der Werf, G. R., Randerson, J. T., Giglio, L., Collatz, G. J., Kasibhatla, P. S., and Arellano, A. F. Jr., Interannual variability in global biomass burning emissions from 1997 to 2004, Atmos. Chem. Phys., 6, 3423–3441, 2006,
http://www.atmos-chem-phys.net/6/3423/2006/.
Vrekoussis, M., Liakakou, E., Koc¸ak, M., Kubilay, N., Oikonomou, K., Sciare, J., and Mihalopoulos, N., Seasonal variability of op-tical properties of aerosols in the Eastern Mediterranean, Atmos. Environ., 39, 7083-7094, 2005.
Vestreng, V., Myhre, G., Fagerli, H., Reis, S., and Tarrason, L., Twenty-five years of continuous sulphur dioxide emission reduc-tion in Europe, Atmos. Chem. Phys., 7, 3663–3681, 2007, http://www.atmos-chem-phys.net/7/3663/2007/.
Weber, R. J., Sullivan, A. P., et al., A study of secondary organic aerosol formation in the anthropogenic-influenced southeastern United States, J. of Geophys. Res., 112, 2007.
Weingartner, E., Saathoff, H., et al., Absorption of light by soot particles: determination of the absorption coefficient by means of aethalometers, J. of Aer. Sci., 34, 1445-1463, 2003.
Zerefos, C., Ganev, K., Kourtidis, K., Tzortsiou, M., Vasaras, A., and Syrakov, E., On the origin of SO2above Northern Greece,