Publisher’s version / Version de l'éditeur:
Vous avez des questions? Nous pouvons vous aider. Pour communiquer directement avec un auteur, consultez la première page de la revue dans laquelle son article a été publié afin de trouver ses coordonnées. Si vous n’arrivez pas à les repérer, communiquez avec nous à PublicationsArchive-ArchivesPublications@nrc-cnrc.gc.ca.
Questions? Contact the NRC Publications Archive team at
PublicationsArchive-ArchivesPublications@nrc-cnrc.gc.ca. If you wish to email the authors directly, please see the first page of the publication for their contact information.
https://publications-cnrc.canada.ca/fra/droits
L’accès à ce site Web et l’utilisation de son contenu sont assujettis aux conditions présentées dans le site LISEZ CES CONDITIONS ATTENTIVEMENT AVANT D’UTILISER CE SITE WEB.
Experimental Mechanics, 21, 6, pp. 209-218, 1981-06
READ THESE TERMS AND CONDITIONS CAREFULLY BEFORE USING THIS WEBSITE. https://nrc-publications.canada.ca/eng/copyright
NRC Publications Archive Record / Notice des Archives des publications du CNRC :
https://nrc-publications.canada.ca/eng/view/object/?id=9588326e-cf53-46f4-a730-4edaee8786c6
https://publications-cnrc.canada.ca/fra/voir/objet/?id=9588326e-cf53-46f4-a730-4edaee8786c6
NRC Publications Archive
Archives des publications du CNRC
This publication could be one of several versions: author’s original, accepted manuscript or the publisher’s version. / La version de cette publication peut être l’une des suivantes : la version prépublication de l’auteur, la version acceptée du manuscrit ou la version de l’éditeur.
Access and use of this website and the material on it are subject to the Terms and Conditions set forth at
Rate sensitivity of compressive strength of columnar-grained ice
Ser
ITH1
N21d
I+
National Research
Conseil national
Council Canada
de recherches Canada
no.
1009
c.2
-
RATE SENSITIVITY O F COMPRESSIVE STRENGTH
O F COLU MNAR-GRAINED ICE
by N i r m a l K. Sinha
4= I
A'.
F <& p ~ b ~ ~ y z z g
1
IL I B R A R Y
Reprinted from
Experimental Mechanics
Vol. 21, No.6, June 1981
p.
209-
218
DBR P a p e r No, 1009
Division of Building R e s e a r c h
SOMMAIRE
Dn dgcrit les mzthodes de sElection e t de preparation des
fprouvettes et le dgtail des procEdures d'essai, y compris
l'examen microstructurel, que l'on applique 2 la rnesure de la
rfsistance la compression uniaxiale de
la
glace columno-grenue.O n d'emontre quc les vitesses de dgformation de llEprouvette ne sont pas constantes pour une vitesse de ddplacement transversal constante, et que, de ce fait, les rCsultats ne sont pas
representatifs d'une condition
B
vitesse de dGformationconstante. L'analyse met en lumiPre que les essais
B
vitesse dedCplacement transversal constante correspondent plus Ctroitement
5 une condition 03 la vitesse d'application des contraintes est
constante. Cette communication analyse aussi les d6formations
de rupture, les temps de rupture, le mode de ddfaillance et la
ddpendance possible des rdsistances sur la rigidit6 de
Rate Sensitivity of Compressive Strength of
Columnar-grained Ice
Dependence of the compressive strength of columnar-grained ice on strain rate, time, stress rate and machine stiffness is investigated for a loading condition of constant rate of cross-head displacement
by Nirmal K. Sinha
ABSTRACT-Methods of selecting and preparing spectmens E, = effective system modulus, and deta~ls of test procedures, lncludlng those for mlcro- , M N * m - ' = & , / i n
structural examlnat~on, are described for the lnvesttgatlon of untaxlal compresstve strength of columnar-gra~ned Ice It 1s
shown that sDeclmen stratn rates are not constant for constant
lnfr~ducfion
cross-head-d/splacement rate, and that consequently the resultsare not representative of the constant strain-rate condition. Analysis shows that constant cross-head-displacement tests are more closely representative of the constant stress-rate condition. The paper also discusses failure strains, fallure times, mode of failure and possible dependence of strength results on stiffness of the test system.
Symbols
A , B ,
C ,
D,
a ,p ,
0 , 6 = constants u = stress, MN m-2 u, = unit stress = 1 M N m-2 uj = upper yield or failure stress,MN m-'
t = time, s t, = unit time = 1 s tf = yield or failure time, s
2 = constant cross-head-displacement rate, cm s-'
L = specimen length, cm
E = strain
t j = upper yield or failure strain
(measured o n sample sides in direction parallel t o load axis) enf = nominal yield or failure strain
, = i n t j
iaj = average strain rate to yield or failure, s-' = ej/tf
k,
= peak strain rate (measured o n sample sides), s-Iin = nominal strain rate, s-' = i / L
= unit strain rate, 1 s-'
baf = average stress rate t o yield or failure, MN m'2 s-' = aj/tf &,, = effective stress rate during most
of loading, M N m-2 s-'
Ef
= failure modulus, MN m-' = of / efOne of the challenging engineering problems is that of estimating the maximum force a moving ice sheet might exert o n a structure. It is analogous t o the problem of the force a structure might exert in moving against a floating ice sheet, for example, in the operation of icebreaking ships. Its solution requires information on the strength and deformation of polycrystallinepe. In principle, it should be possible t o design structures with sufficient strength t o withstand the pressures of ice when it comes in contact with them. _
The s t r e n i r yield point of a mate';ial is defined in different ways; the c h o k e usually depends o n the nature of the engineering problem. With ice, it is the maximum st&ss in compression that is in many situations of prime engineering concern. In this paper the maximum stress is associated with failure or yield.
A program of observation was undertaken on the uni- axial compressive creep and recovery of columnar-grained
fresh-water ice, known as S-2 ice, with the load axis normal to the columns. This type of ice and stress con- dition is common for many field situations. The develop- ment of a rheological model, including transient creep, has been presented.' Many apparent inconsistencies in the results of earlier investigations of the flow law of poly- crystalline ice, particularly important t o engineering problems, appear to have been reconciled.' The present report is an extension of these investigations and examines the rate sensitivity of the uniaxial compressive strength of the same type of ice.
Information o n the strength of ice is rather scattered and difficult to interpret, due mainly t o lack of detailed information on experimental conditions and measure- ments. An additional purpose of this study was t o develop systematic methods of testing and analyzing such results in the hope that this would permit more critical examina- tion of available information and provide a better founda- tion for future investigations.
Preparation and Selection of Ice
A detailed description of the method of preparation
Nirmal K . Sinha (SESA Member) is Research Officer, Geotechnical and selection of inclusion-fI'ee (density = 917.7 f0.3*
Section, Division of Building Research, National Research Council of kg/m3), columnar-grained S-2 ice is available.' This was
Canada, Ottawa, Canada K I A OR6. strictly followed in the presenf study with one exception:
Paper was presented a1 1979 SESA Spring Meeting held in Sun Francisco,
C A on May 20-25.
Original manuscript submitted: May 1979. Author notrfied of acceptance: 'Since the submission of Ref. I , the method of measurement has been
May 1980. Final manuscript received: July 23, 1980. improved by M. Nakawo. The value given above was obtained at - 9 ° C .
the choice of grain size in the cross-sectional area of the, columnar grains.
It was anticipated that a large number of specimens would be required t o complete the study. It takes about four weeks t o prepare and grow ice from which only a few good specimens can be made. Previous experience showed that it is extremely difficult t o obtain the neces- sary large number of specimens of the same average grain size. It was decided, as a compromise born of practical necessity, t o use specimens with average grain diameter ranging from 4 to 5 mm.
Preparation of Specimens
Rectangular specimens 5
x
10 x 25 cm were prepared in a cold room a t - 10°C in such a way that the long direction of the grains was perpendicular to the 10x
25- cm face. The specimens were machined t o their final dimensions of 5x
10x
25 cm by careful milling. Sur- faces were then smoothed with fine emery paper o n a surface table and polished with tissue paper lightly moistened with alcohol. The transparent specimens were measured and weighed t o determine average density, which was then compared with the density of a sample measured by a more accurate method. The specimens were stored in a kerosene bath inside a cold room until the tests were conducted a week or more after preparation. Immediately before each test, the end faces, 5x
10 cm, were given a final polish t o remove any imperfections that might have been introduced during storage (kerosene is known to be slightly erosive for ice stored in it for a long time).Experimental Procedures
Compressive loads were applied t o the 5
x
10 cm faces by a screw-driven test machine of 100 kN capacity (In- stron, TTDM-L) with its load frame situated inside the cold room; the control panel was kept outside near a glass window. The temperature at any point in this cold room can be maintained constant for weeks and months within k0.25 "C of a required set temperature. The loading column consisted of two machined and ground steel platens (1.6x
7.6x
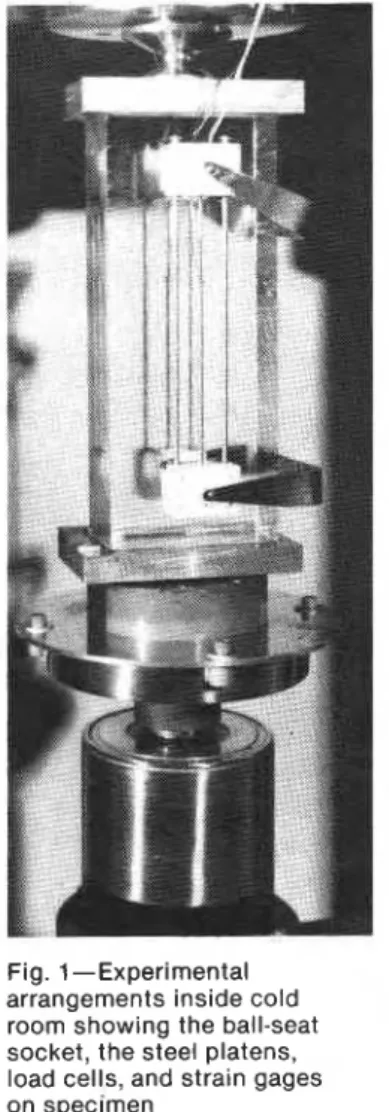
12.6 cm), one at the top and one at the bottom of the specimen, a 1.9-cm-diam steel ball and socket seat, and two 50-kN calibrated load cells (Instron and a n auxiliary) in series (Fig. 1).The Instron load cell recorded the load-time history o n a strip-chart recorder kept outside the cold environment and served as a visual guide of progress of a test. The output of the other load cell was recorded by a digital data-logging system also kept outside the cold room. Simultaneous recording was made of the movement of the cross head with respect t o a fixed reference point (using a direct-current linear-variable-differential . transformer, DCDT), the temperature of the specimen,, and the deformation in the central 3/5 of the specimen by means of a pair of strain gages (gage length = 15 cm) attached to the 10 x 25-cm faces. The strain gages and the pre- cautions necessary in installing them have been described' and may be seen in Fig. 1.
For tests lasting more than a few minutes, the specimens were wrapped with clear plastic sheets' to prevent sub- limation. A thin layer of kerosene o n the exposed surfaces was found sufficient to stop any sublimation for tests of shorter duration. This protection also helped to maintain the specimen temperature and to avoid thermal gradients produced by reduction of the specimen-surface temperature
Fig. 1-Experimental arrangements inside cold room showing the ball-seat socket, the steel platens, load cells, and strain gages on specimen
due to sublimation. Tests were conducted at - 10°C k0.25 "C.
During deformation columnar-grained ice has a marked tendency to develop long, narrow internal cracks parallel to the length of the columns. Their formation has a profound influence on compressive creep properties.) This prompted an investigation of cracking activity during the present test series and specimens were subjected to con- tinuous visual surveillance during loading. The times for the formation of the first and a few subsequent visible cracks were marked, using manually operated electrical pulses, o n the strip-chart recording-load history.
Immediately after the load reached its maximum value, depending o n the cross-head rate used, the specimen was unloaded very rapidly and allowed to recover until there was no further change in strain with time. This method was used to determine the permanent and recoverable strain at or near the yield point corresponding to a given loading condition.
The number of cracks intersecting the central 10
x
15- cm area of the two 10x
25-cm faces were then counted, using a low-power microscope. Total number of cracks in the specimen were also counted within the specified 3/5 of the specimen, provided all the cracks could be identified separately. The specimen was then sectioned in the middle plane parallel t o the 10x
25-cm faces. One of the cut surfaces was polished and the number of cracks in the section corresponding t o the above-mentioned area were counted. The average crack density per unit area in the plane containing the load axis and normal to the columnar grains was then estimated using all the above data. As the specimen was unloaded immediately after yielding, crack8
-
r . 2 E 7 - Z I6
6 - m:
5 - = + VI:
4 - 3 2-
4 L 3 - w 0 2 2 - " - u F O R in-
> o F O R iaf > T H I S S T U D Y 0 ST. L A W R E N C E I C E . F O R € " ' ' - ----m 0 " " " " I ' 1 1 1 1 1 " 1 ' ' " 1 " ' 1 " 1 1 1 " 1 ' ' i t l l ' l 1 0 - 7 lo.6 5 x S T R A I N R A T E . i, s - lFig. 2-Dependence of yield or failure stress on nominal strain rate, i , , and average strain rate to peak stress, if,, for columnar-grained ice of average graln size,
4-5 mm, at -10°C. Premature failures are
marked with asterisks
density provided a measure of the structural degradation at the yield point.
A thin section (10
x
10 cm) representing the middle plane was then made from the other half of the ~ p e c i m e n . ~ The section was photographed in transmitted light through cross-polaroids as well as in a combination of transmitted polarized light and scattered light in order to measure grain size and distribution. The latter method provided the better visual record of individual grains and the relative position of cracks. The upper surface of the thin section was then etched and replicated-or microstructural e ~ a m i n a t i o n . ~Average grain diameter of a specimen was estimated from the average grain area determined by counting the number of grains over the entire thin-section photograph. Results for specimens having average grain diameter differing by more than the error of measurement of k 0 . 2 mm from the intended range discussed earlier were ex- cluded from the present analysis and kept for future use.
Accepted Analysis
Dependence of Strength on Nominal Strain Rate
Except for the new generation of closed-loop systems, most universal test machines are designed to deliver con- stant rates of cross-head displacement,
x.
The ratio of this rate t o the length, L , of the specimen, for specimens of uniform cross section, will be defined as the nominal strain rate, i,. The range of i, ( = 1 / L ) to be discussed varied from 3.3x
to 3.3x
s-I, corresponding to the cross-head rates, 1 = 8.3x
lo-' to 8.3x
lo-' cm s-' for the specimen length of 25 cm.The failure response for i , higher than 2.5
x
tended to be brittle, leading to premature cleavage type of failure. It was concluded that the tolerances between the platens and the sample end surfaces will have t o be further reduced and that the geometry of the specimen itself will probably have to be changed before reliable results can be obtained for higher strain rates. For i, less than about 5x
lo-', the material behaved in a viscous manner, with negligible internal-cracking activity. In the intermediate range, however, a distinct upper yield was noticed, with load decreasing rapidly after reaching a maximum value. The material exhibited a n increasing number of uniformlydistributed internal cracks with increase in strain rate in this range. The former behavior will be called 'viscous yield' in order t o distinguish it from that showing 'upper yield'.
Experimental results are shown in Fig. 2; for the sake of clarity, the results of premature failures are purposely not shown, except for one, a n example of the general trend. As the total strains at failure (described later) were small, less than 3
x
the stresses estimated from the loads and cross-sectional areas could be considered the true stresses. The maximum stress, of, was found to vary with i,, as shown in Fig. 2, according to the following dimensionally balanced empirical relationwhere a , and i , are unit stress (MN m-') and unit strain rate (s-I), respectively. A and a are constants. Equation ( l a ) is given here in a form convenient for a direct com- parison, to be made later, with a similar relationship commonly used to describe the dependence of viscous strain rate o n stress under constant-stress-creep con- d i t i ~ n . ' , ~ The constant A is interpreted here as the applied strain rate under which the strength is unity.
The results of the regressional analysis of the experi- mental data o n the basis of eq ( l a ) are given in detail in
TABLE 1 -REGRESSION ANALYSES FOR T H E SERIES OF TESTS ON COLUMNAR-GRAINED ICE
Equation Correlation
No. Equation Coeff~cient Exponent Coefficient e m "f a (1 a) 7 = A
(-)
A = 3.37 x 1 0-7 cx = 3.03 0.994 t , "I+
0.34 x lo-' f 0.08 "f 0 (2a) -;-- = B(-)
B = 1.39 x 10'' 6 = 3.05 0.994 t ! "I 5 0 , 1 5 ~ 1 0 - ~ k 0 . 0 8 C = 3.35 x 10' 0 = 2.30 0.992 5 0 . 2 8 x10³ 5 0.07 b baf 6 (12a) "= D($
0 = 1.11 6 = 0.982 0.9999 61 5 0.02 +0.003Table 1. With A = 3.4
x
lo-' and a = 3.0, given in Table 1, eq ( l a ) becomesThe above results are in general agreement with the few highly scattered data o n natural S-2 ice reported by Gold and K r a ~ s z , ~ and a few o n laboratory-grown ice reported by several other The trend observed in the present investigation is similar to the characteristics reported for other types of ice.6,""
A previous set of testst2 o n naturally occurring S-2 ice from Lac St. Pierre in the St. Lawrence River (Canada) is of particular interest (Fig. 2). The tests were performed at DBR/NRC o n the same test machine and using the same components in the loading column except for the auxiliary load cell. Specimens were prepared in the same way, except for the final finishing (described previously) of the end surfaces, and were identical in dimension and similar in
Fig. 3(a)-Stress-strain, stress-time, and strain-time results on columnar-grained
ice at - 10" C for a constant cross-head
displacement rate of 1.25 x
lo-'
cm s'' ora nominal strain rate of 5 x ,10-5s-1. Strain
shown was the average value measured by two gages mounted on the specimen
grain size t o those used in the present study. They show good agreement in the yield region and exhibit uncertainty in the results of premature failures beyond i, greater than
1.3
x
S-1.Criticism
Specimen Strain Rate
Because strain gages' employing DCDT's are expensive, they were not installed initially o n the specimen, in fear (subsequently proved t o be wrong) of damaging them in cases when the specimen broke abruptly and violently. Initial tests were carried out with a pair of gages mounted between the top and the bottom platens. These measure- ments gave what might be called 'the strain at the sample ends'. The strain rate, measured in this way, was found to increase during the test until peak stress was reached under yield type of failures. Although the peak strain rate
0 2 4 6 8 10 1 2 14 16 18
S T R A I N . E . I t
was close to the nominal strain rate, the strain rate was very low in the beginning. Since the yield strains were very small, in the range of 0.1 percent in these tests, bulging of the specimen was not considered the main problem. In addition, bulging could not occur right at the beginning of the tests. Moreover, if bulging was a problem, then why did the specimen strain rate approach the corres- ponding nominal strain rate as the test progressed? The machine was, therefore, blamed for not maintaining a constant speed and a decision was made to examine the cross-head rate. Its rate of movement was measured during loading with respect to a fixed reference point. When the cross-head rate was found to be constant and equal to the set rate, then the unexpected behavior was ascribed to the end effects. The strain gages were then mounted on the 10 x 25 faces of the specimen (Fig. 1) so that the ascribed unknown end effects might be eliminated. However, the deformation rate of the sample sides (Fig. 3a) also showed variations during a test, similar to those observed in the previous tests. For confirmation, tests were then per- formed during which simultaneous recordings were made on the strain at the sample sides and the strain at the sample ends, the cross-head rate and a few other measure- ments related to the response of other components of the test system. An example of such a test result is shown in Fig. 3(b) which shows the stress and strain histories during loading as well as during recovery. The example shows that the two sets of strain measurements during loading were close to each other within experimental uncertainties, but both were far from what would have been expected if strain rate was constant at the nominal rate of 5
x
s-I, corresponding to the measured constant cross-headrate of 1.25
x
cm s-l. Since imperfections in the end-surface preparations of the samples were liable to intro- duce uncertainties in the measurements of the strain at the sample ends, it was decided to adopt the side-strain mea- surements as the standard procedure.
This discussion shows that the strain rate in the speci- mens monotonously increased with time in spite of the
observed constancy in cross-head-displacement rates and approached the nominal strain rate only after reaching maximum stress. The initial strain rates were about an order of magnitude less than the subsequent maximum strain rate. The peak strain rate in the specimen, i,, estimated from a narrow range of strain-time data near yield point or after maximum stress was reached (see Fig. 3) is compared with
in
in Fig. 4. In spite of the possible large error in the estimation ofi,,
the equivalency betweeni,
andin
is beyond question, as may be seen from the linei,
=in.
This indicates that the testing machine was able to impose the specified deformation rate on the specimen only when the specimen offered no more increase in resistance with further increase in deformation. The use ofin
as an independent variable can therefore be justified, and the systematic variation of of with it supports this. The results, however, cannot be construed as constant strain rate, although this is customarily a ~ s u m e d . ~ - " . ~ ~The occurrence of premature failure is often referred to in ice literature as 'ductile to brittle transition'. As such failures occur anywhere along the strain-time path, the strain rate in the specimen at the moment of failure can be significantly lower than the corresponding
in.
This behavior has never been recognized in glaciological litera- ture and premature failures are usually plotted as a function ofin,
as shown in Fig. 2. One example from the present series is shown in Fig. 4, corresponding to the example used in Fig. 2. In this case, the strain rate at failure was estimated to be only about 35 percent ofin.
It seems that the ratio of specimen strain rate at failure to
in
could be used as a measure of the 'degree of maturity' in this type of failure.The quality of the specimen preparation could control
how early premature failure occurs at higher
in
and,thereby, influence the outcome of strength results. This is evident in the trends, shown by the broken lines in Fig. 2, of the present series and that of the St. Lawrence River ice. Experimental evidence of this observation was seen and strongly emphasized by Hawks and Mellor" in
" 0 Y; 1 X S 3 I / WAS CONSTANT 7 8
0 AVERAGE STRAIN MEASURED B Y TWO GAGES MOUNTED O N THE SPECIMEN, GAGE LENGTH = 15 cm AVERAGE STRAIN MEASURED B Y TWO GAGES BETWEEN
TOP AND BOTTOM STEEL PLATENS, GAGE LENGTH = 25 cm
i
Fig. 3(b)-Stress and strain history of columnar-grained ice at - 10°C subjected to a constant cross-head displacement
rate of 1.25 x cm s-I or a nominal
strain rate of 5 x s-' during loading.
Details on strain measurements are given in the legend and the insert shows the experimental setup
an investigation on granular ice.
Average
StrainRate
toFailure
A better but still far from satisfactory representation of strain history might be obtained by considering the average strain rate t o yield or failure, i a f , (= t f / t f ) deter- mined from strain at peak stress, t f , and failure time t f .
The strain path in this presentation is equivalent to the line joining the origin and the yield point on the strain- time plot, as can be appreciated from Fig. 3.
Strength was again observed to vary systematically with
i a f except, as before, for premature failures (Fig. 2). The results are described by the following relation
where B and are constants. Results of regressional analysis of the experimental data gave B = 1.4 x lo-' and
0
= 3.1 with a correlation coefficient of 0.994 (see Table 1 for details). With these values of B and0 ,
eq (2a) can be written asOf 3 . 1
= 1.4
x
(-)
E 1 ' J l
Table 1 shows that the stress exponents a and
0
are equal t o each other within the reported scatter. The difference between the coefficients A and B are, however,Fig. 4-Comparison of the nominal strain rate and the corresponding peak strain rate measured with a pair of gages mounted on the specimen
U P P E R Y I E L D
,,I1 ' " ' 7 ' ' ' 1 ' . ' " ' ' ' I ' . " " ' ' l ' ' " " " 1 " , " ' " I ' ""J
100 i n 1 10, 10' l o 5 104
T l M t , I , , r
Fig. 5-Dependence of yield or failure time on yield or failure stress. Premature failures are marked with asterisks
significant. This indicates that the same yield strength would occur at different strain rates depending o n the way the strain rate for a given test is calculated. This raises the question: what would the strength be for a truly constant strain rate? It should be pointed out here that eq (2b) is remarkably close to the relation describing the dependence o f viscous flow of ice o n stress in creep proposed by this author'
'
and illustrated in Fig. 2.Reinterpretation
Failure Time
Strength-measuring systems are invariably equipped to record maximum load and many, like the present one, can record the load-time history. T h ~ s ~ i n f o r m a t i o n o n failure time is or can be made available. It would then be natural t o examine the dependence of failure time, t f , o n the imposed loading condition. Previous discussions, however, indicated the uncertainty in the quantification of the loading condition. It was, therefore, decided t o examine the inter-relationship between t f and o f . Once this was determined for a system the dependence of t f o n in or i a f can be formulated if required. Figure 5 is a plot of the failure stress and the time, t f , taken to reach it. There is a strong relation between of and tf for tests exhibiting upper yield, expressed as
where C and 0 are constants and t, is unit time (s). Results of regressional analysis of the experimental data gave C = 3.4
x
lo3 and 19 = 2.3 with a correlation coefficient of 0.992 (see Table 1 for details). With these values of C and 0 , eq (3a) can be written asAs the stress did not show during the test a reversal point for low rates of loading, the estimation of 'time of yield' was subjective for viscous yields. Thus there was a broad, but smooth, transition from yield in pure viscous flow to yield by a combination of viscous flow and internal cracking. The question of determining the time to reach maximum stress and the corresponding strain were thought t o be equivalent t o the question of ascertaining the time and the strain t o reach steady-state in constant stress creep tests. The time aspect of the latter subject has been dis- -*cussed a t length elsewhere2 o n the basis of the rheological
model proposed earlier.
'
Stress and
Strain atFailure
Failure strain, c f , is related t o the average strain rate t o peak stress, i a f , as defined earlier, by
Substituting i a f / i l and t f / t , , respectively, from eqs (2a) and (3a) in eq (4) gives
which reduces, o n substitution of the values of B , C, /3
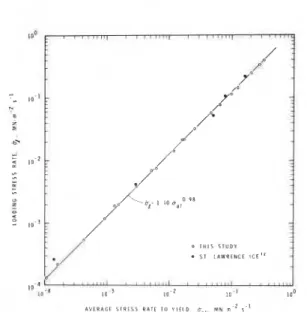
L O A D I N G S T R E S S R A T E . vl M N rn.' r ~ l
Fig. 9-Dependence of yield or failure stress on stress rate during loading. Note trends of premature failures, marked with asterisks, in the' two series of tests
Fig. 8-Interdependence of average stress rate to yield and stress rate during loading
Figure 8 also includes data points from tests o n river ice.12 Substituting 6 a f / b , from eq (10a) in eq (12a),
which reduces to, o n substitution of the values of the constants from Table 1,
Experimental results are compared with eq (13b) in Fig. 9.
Stress Rate and Failure Time
A major obstacle in using
6,
is that the actual failuretime, as may be seen from Fig. 3, is greater than u f / b i , . This is a dilemma and cannot be avoided under the present circumstances. It raises the question: what would the strength be if stress rate were maintained constant
until failure? The relation of tf and U , can, however, be
obtained from eqs (1 la) and (12a), giving
which, using Table 1, reduces to
Stress Rate and Failure Strain
The dependence of E, o n kaf can be obtained from eqs
(5a) and (lOa), giving
which reduces t o
L O A D I N G S T R E S S R i i T t 9 M N m
'
5Fig. 10-Dependence of strain at yield or failure on stress rate during loading
Equations (12a) and (15a) then give the dependence of
tf o n 6 ,
which reduces, using Table 1, t o
Both eqs (15b) and (16b) describe the experimental results satisfactorily. As they are interrelated, only one graphical comparison (Fig. 10) is considered sufficient t o illustrate their applicability. Note the stress-rate dependence of the strain to viscous yield or premature failure in Fig. 10. The trend shown for abrupt failures indicates a decrease in strain with increasing load rate, indicative of the increase in degree of prematurity.
Crack Formation
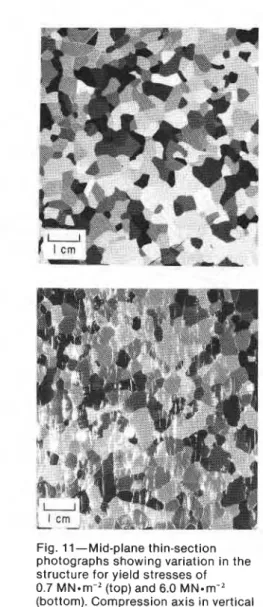
Although detailed discussion of this subject will be presented elsewhere, a few pertinent points are worth mentioning. Crack density increased rapidly from 0.007 cm-2 t o about 8 cm-2 for an increase in yield stress from 0.7 M N -m" t o about 7 MN m-2. Distinct upper yields also occurred when maximum stress exceeded about 1.0
Fig. 11-Mid-plane thin-section photographs showing variation in the structure for yield stresses of 0.7 MN-m-2 (top) and 6.0 MN-m-' (bottom). Compression axis in vertical direction. Note predominant orientation of cracks in bottom photograph
MN em-2. An increase in loading rate thus gradually changed the mode of failure from yield without cracks to total collapse of the structure as a result of internal cracks (Fig. 11). Premature failures, on the other hand, were characterized by the absence of a significant number of internal cracks in the broken segments that failed early.
Gold3 reported the formation of cracks in columnar- grained ice in uniaxial compressive creep when stress
exceeded about 0.6 MN-m-'. He also noted that struc-
tural deterioration due to crack formation caused the primary stage of creep to change directly to the accelerating stage when stress exceeded about 1.2 M N - m 2 . Such observations seem to be analogous to the strength level above which the cracks formed and the stress above which well-defined yield points developed.
Machine Stiffness
No doubt, deformation history influences the cracking activities and strength properties of ice. In turn, deforma- tion history must be influenced by the test conditions. It is desirable, therefore, to examine the response, particularly the stiffness, of the test system used and its possible effects on the results obtained.
N O M I N A L S T R A I N RATE. in. 5.'
Fig. 12-Dependence of stress rate during loading on nominal strain rate. Premature failures are marked with asterisks
The stiffness of a test system depends on the rigidity of all components and their junctions as well as the material properties of the specimen and its geometry. It is difficult to predict the response of the total system when the material in question is nonlinear viscoelastic. Several methods of analysis were investigated for the system. One of the simplest measures of its effective stiffness was
found by relating i, and the resultant &,. The choice was
prompted by the observed constancy in the cross-head- displacement rate and the nearly constant stress rate during a test. Moreover, it was useful in examining previous data.
Substitution of uf/ul from eq (la) in eq (13a) and re- arrangement gives
which reduces, using Table 1, to
Experimental results are compared with eq (17b) in Fig. 12. Except for very slow tests, a continuity in the loading response of the system is evident in all other tests, including premature failures, and strengthens further the concept of using stress rate for the analysis of the experimental data and the response of the system.
Equation (17b) leads to the effective modulus of the
system, E,, given by
It is convenient here to introduce the term 'failure
Substitution of ef from eq (5a) and a f / a l from eq ( l a ) in eq (19) and rearrangement gives
which relates the failure modulus in terms of nominal strain rate. This reduces, on substitution of the values of the constants from Table 1, t o
Both the eqs (18) and (20b) are nonlinear and show that
E, is smaller than Ef at any i n . This indicates that the total system is softer than the specimen. The E, value of 1.7 GN m-Z a t 1
x
lo-' s-I is considerably lower than theEf
value of 3.5 GN m-2 which, on the other hand, is appreciably lower than the Young's modulus of = 9.5 G N * m - = of ice used.' Abrupt splitting type of failures atin
just above lO-'s-' are therefore far from conditions of truly elastic loading and, hence, far from truly brittle behavior.An explanation as to why the strain rate in the specimen could be different from nominal strain rate is given in Ref. 14 which also discusses our test results on machines and systems of varying stiffness characteristics. It is shown that if there is n o change in any of the components in the loading column, including specimen geometry and type of ice, then test machines differing significantly in rigidity could have a marked influence o n system stiff- ness. A stiff machine could result in greater stress rate and therefore greater yield strength at the same in than a soft machine, and could shift the occurrence of premature failure to lower strain rate o n the i, scale. Preliminary experiments with two other test machines with 2.5 and
12.5 times greater load capacity than the machine used in this experiment confirmed this hypothesis.14
It is shown further that change in any of the system components, for example specimen g e o m e t r y , ' b r intro-
'
duction of compliant platenslVo improve end conditions,
.
affects system stiffness, stress rate and specimen strain rate and, thus, strength a t a given in. Available strengthI . l 3 reported as functions of nominal strain
rates therefore require reanalysis and reinterpretation. This conclusion is further strengthened by the fact that there is ample evidence in the literature of large dis- crepancies between nominal strain rates and corresponding strain rates in the specimen. The tabulated results in Ref. 11, for example, show the average strain rates to failure t o be 10 t o 100 times less than the corresponding nominal strain rates; these discrepancies were not, however, discussed. The deformation characteristics of ice during strength testing can now be described analyti~ally.'~
Conclusions
A conventional test machine capable of delivering constant displacement rates was used t o investigate the uniaxial compressive strength of columnar-grained ice a t a constant temperature. Although a definite relation was observed between yield stress, u3, and the nominal strain rate,
t , , the specimen strain rates were far from constant
during the tests and approachedin
only a t peak stresses.A strong dependence of failure time, t3, o n a3 was noted for conditions exhibiting upper yield.
in in conjunction
with t3, however, overestimated the failure strain, tf. Better but still not satisfactory representation of the deformation history was obtained by using the averagestrain rate to yield, iaf. This allowed a n interrelation to be formulated between the various measured quantities. A systematic dependence between af and tf was shown to
exist for upper yield conditions. Specimens that behaved viscously exhibited greater strain than that given by this relation, whereas those that failed abruptly underwent less strain. Analysis showed that the actual loading history comprised a nearly constant stress rate up t o about 90 percent of yield stress, followed thereafter by a path leading to a constant strain rate. It was more appropriate, therefore, to treat the tests as occurring at constant stress rate rather than at constant strain rate.
Results were reanalyzed in terms of stress rate. This allowed the effect of machine stiffness to be taken into consideration and a prediction to be made of its possible influence on measured strengths. A stiff machine could result in higher yield strength than a soft one at the same
i , and could shift the occurrence of abrupt failure to lower strain rates. The mode of failure was found t o be related t o structural deterioration resulting from internal crack formation. Introduction of the concept of a failure modulus for yield type of failures and the formulation of its dependence o n nominal strain rate helped to show that the apparently brittle, abrupt failures were not associated with truly elastic loading conditions.
Acknowledgments
The author is indebted to D. Wright for his assistance in designing and conducting the tests, and for performing some tedious measurements. H e is also grateful to R. Frederking for allowing the use of results o n St. Law- rence River ice, and to M. Nakawo for accurately mea- suring the density of the ice used.
This paper is a contribution from the Division of Building Research, National Research Council of Canada and is published with the approval of the Director of the Division.
References
1. Sinha, N.K., "Rheologv of Columnar-grained Ice, " E X P ~ R I M E N l A1 MECHANICS, 18 (12), 464-470 (1978).
2. Sinha, N.K., "Shorl-term Rheology of Polycrystalline Ice," J. Glaciology, 21 (85). 457-473 (1978).
3. Gold, L . W., "The Process of Failure of Columnar-grained Ice," Phil. Mag., 26 (2). 311-328 (1972).
4. Sinha, N.K., "Dislocations in Ice as Revealed by Elching, " Phil.
Mag., 36 (6), 1385-1404 (1977).
5. Sinha, N.K., "Observation of Basal Dislocations in Ice by Etching and Replicating, " J. Glaciology, 21 (851, 385-395 (1978).
6. Gold, L . W. and Krausz, A.S., "Investigalion of /he Mechanical Properlies of SI. Lawrence River Ice," Can. Geolech. J., 8 (2). 163-169 (1971).
7. Frederking, R., "Plane-strain Compressive Strength of Columnar- grained and Granular-snow Ice," J. Glaciology, 18 (80). 505-516 (1977).
8. Ramseier, R.O., "Growlh and Mechanical Properties of River and Lake Ice," Ph.D. Thesis, Lava1 Universily, Quebec, Canada (1976).
9. Muguruma, J., "Effects of Surface Conditions on the Mechanical Properlies of Ice Crystals," J. Phys., D , Ser. 2, 2, 151 7-1525 (1969).
10. Gold, L . W., "Engineering ProperIies of Fresh-water Ice," J. Glaciology, 19 (81). 197-212 (1977).
11. Hawkes, I . and Mellor, M . , "Deformation and Fracture of Ice under Uniaxiul Stress," J. Glaciology, 11 (61). 103-131 (1972).
12. Frederking, R., Privale communication.
13. Haynes, F.D. and Mellor, M . , "Memuring the Uniaxial Compressive Strength of lee," J. Glaciology, 19 (81). 213-223 (1977).
14. Sinha, N . K . and Frederking, R . M . W., "Effect of Tesl System Sliff- ness on Sfrength of Ice," Proc. 5th Inlernalional Conference on Port and Ocean Engineering under Arctic Conditions. Aug. 13-18, Trondheim, Norway; 1, 708-71 7 (1979).
15. Sinha, N . K . , "Applicalion of Creep Model of Ice to Predict Its Response During Slrength Tests. " Presenled a1 Fourth SESA Internalionol Congress on Experimental Mechanics, Boston, M A , May 25-30, 1980,
This publication is being distributed by the Division of Building R e s e a r c h of the National R e s e a r c h Council of Canada. I t should not be reproduced in whole o r in p a r t without p e r m i s s i o n of the original publisher. The Di- vision would b e glad to be of a s s i s t a n c e in obtaining s u c h permission.
Publications of the Division m a y be obtained by m a i l - ing the a p p r o p r i a t e r e m i t t a n c e ( a Bank, E x p r e s s , o r P o s t Office Money O r d e r , o r a cheque, m a d e payable t o the R e c e i v e r G e n e r a l of Canada, c r e d i t NRC) t o the National R e s e a r c h Council of Canada, Ottawa. K1A OR 6
.
Stamps a r e not acceptable.A l i s t of allpublications of the Division i s available and m a y be obtained f r o m the Publications Section, Division of Building R e s e a r c h , National R e s e a r c h Council of Canada, Ottawa. KIA 0R6.