Publisher’s version / Version de l'éditeur:
Vous avez des questions? Nous pouvons vous aider. Pour communiquer directement avec un auteur, consultez la
première page de la revue dans laquelle son article a été publié afin de trouver ses coordonnées. Si vous n’arrivez pas à les repérer, communiquez avec nous à PublicationsArchive-ArchivesPublications@nrc-cnrc.gc.ca.
Questions? Contact the NRC Publications Archive team at
PublicationsArchive-ArchivesPublications@nrc-cnrc.gc.ca. If you wish to email the authors directly, please see the first page of the publication for their contact information.
https://publications-cnrc.canada.ca/fra/droits
L’accès à ce site Web et l’utilisation de son contenu sont assujettis aux conditions présentées dans le site LISEZ CES CONDITIONS ATTENTIVEMENT AVANT D’UTILISER CE SITE WEB.
Journal of the Illuminating Engineering Society, 10, 3, pp. 178-184, 1981-04
READ THESE TERMS AND CONDITIONS CAREFULLY BEFORE USING THIS WEBSITE. https://nrc-publications.canada.ca/eng/copyright
NRC Publications Archive Record / Notice des Archives des publications du CNRC :
https://nrc-publications.canada.ca/eng/view/object/?id=1840892a-2b47-498a-b3b2-6cbc92e7958a https://publications-cnrc.canada.ca/fra/voir/objet/?id=1840892a-2b47-498a-b3b2-6cbc92e7958a
NRC Publications Archive
Archives des publications du CNRC
This publication could be one of several versions: author’s original, accepted manuscript or the publisher’s version. / La version de cette publication peut être l’une des suivantes : la version prépublication de l’auteur, la version acceptée du manuscrit ou la version de l’éditeur.
Access and use of this website and the material on it are subject to the Terms and Conditions set forth at
Monitoring lighting energy consumption: techniques and results
Levy, A. W.; Robertson, W.
Ser
TH1
N21d
no.
988
National Research Council of Canada
c . 2
Conseil national de recherches du Canada
BLDG
, . ~ -
MONITORING LIGHTING ENERGY CONSUMPTION:
TECHNIQUES AND RESULTS
by
A. W. Levy and W. Robertson
ANALYZED
Reprinted from
Journal of the Illuminating Engineering Society
Vol. 10, No. 3, April 198
1p.
178-183
I
N R C-
4 1 ~ ~ 1BLDG.
RES.
hlRR4P.X
-&-am
23-
BIBLIOTYZQUE
Rech. BCitim.
C N R C-
I C I S TDBR Paper No. 988
Division of Building Research
SOMMAIRE
Le rapport examine les rksultats d'ktudes sur
l'knergk d'kclairage effectuCes dans des imme-
ubles Ude bureaux &ant et apres l'installation de
nouveaux interrupteurs. Les auteurs expliquent
l'importance de mesurer avec precision la con-
sommation d'knergie d'kclairage. On
ydkcrit une
nouvelle technique pour mesurer la consommation
d'knergie d'kclairage que l'on compare ensuite
A
des mkthodes actuelles.
IES
TRANSACTION
Monitoring lighting energy consumption:
techniques and results
A.
W. Levy and W. Robertson
The results of lighting energy surveys in office buildings before and after the installation of additional lighting switches are discussed. The importance and value of accurately measuring lighting energy consumption is explained. A new technique to monitor lighting energy consumption is described and compared to existing methods.
Introduction
Since the oil embargo of 1973, artificial lighting has steadily received increasing attention as a large en- ergy consumer in buildings, but there have been very few attempts to accurately document the extent and magnitude of that consumption. There are perhaps a t least two reasons for this state of affairs: one is the absence of a convenient, inexpensive, and accurate method of measuring lighting consumption sepa- rately from the total building electrical eRergy use; and another is the widespread, but inaccurate prac- tice of documenting the installed lighting load while only estimating (or guessing) the hours of use of that load.
Reliable data on energy used by lights is essential in order to predict accurately pay-back periods prior t o the installation of new controls. A new Lighting Energy Monitor, LEM, developed jointly by the National Research Council of Canada, Bell-Northern Research Ltd., Ottawa, and Foundation Instruments, Ottawa, is being employed to gather this important information. Data have been collected by NRC in federal government buildings in Ottawa in coopera- tion with Public Works Canada. (Public Works Canada is the federal department which owns and manages Canadian federal buildings.) Public Works, National Capital Region, have been engaged in their own lighting energy conservation program since early 1978 and had, previous to the introduction of the Lighting Energy Monitor, LEM, used a number of other techniques to monitor energy consumption. Of
A paper presented a t the Annual IES Conl'ercnce, August 14 through 28, 1980, Dallas, Texas. AUTHORS: At the time the paper was written Dr. Levy was with the National Research Council of Canada. He is now with Engi- neering Interface Ltd., Willowdale, Ontario, Canada. Mr. Robertson is with l'uhlic Works of Canada, Ottawa. Ontario, Canada.
particular interest to Public Works Canada, was whether the installation of more light switches in buildings could be economically justified, hence the mutual interest in the development and use of the LEM.
The lighting energy monitor
For a detailed account of the design and principles of operation of the LEM, the reader is referred to Levy and Szanto, 1980.'
The LEM was designed as a remote, wireless, in- expensive, simple-to-install lighting energy monitor.
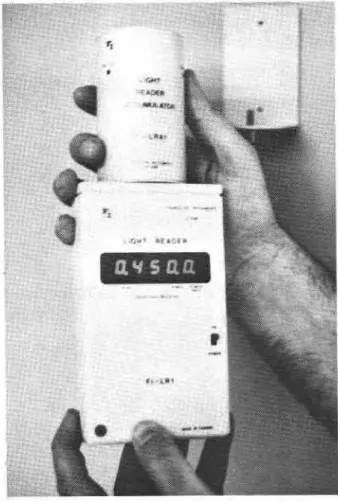
A current model is illustrated in Fig. 1 which shows its three components: a small bracket which attaches to the wall with a self-adhesive backing; a cylindrical accumulator which is affixed to the bracket by means of a screw; a light reader which is connected to the accumulator to read out the information stored in the accumulator.
The accumulator counts and records the number of hours a given lighting circuit is on. Energy con- sumption is then calculated as the product of the power load (lamps and ballasts) and the measured hours of use for that switch circuit. It is only neces- sary to monitor one luminaire on a given switch cir- cuit to obtain the energy consumption for that entire circuit. The number of units required in a given space is, therefore, equal to the number of switching cir- cuits.
The device does not react to daylight. It responds to light from incandescent, fluorescent, and high intensity discharge lamps that operate on alternating current supplies.
Alternate monitoring/measuring techniques
Several techniques are available to monitor or measure lighting energy consumption. All are in-
Figure 1. Time-elapsed meter and reader.
cluded with the LEM in Table 1, which indicates approximate costs, advantages, and disadvantages. Buildings monitored and results
Four buildings were monitored using a portable recording watt meter connected to the electrical
panel feeding the appropriate lighting circuit. The savings achieved through the introduction of switches are presented for these buildings by com- parison of the energy consumption before and after the extra controls were installed. These data indicate the potential for conservation in other similar buildings.
Data were collected in representative test areas in each of the buildings.
The Lester B. Pearson Building, which houses the
Department of External Affairs.
The Pearson Building is used for general office work but, because of the nature of work conducted by External Affairs, many of the employees are not in their offices for significant periods of time during normal working hours.
A study of lighting patterns in the Lester B. Pearson Building was made using a recording watt meter for a period of seven consecutive days. I t was found that the lights were controlled by two master switches, each controlling half of the lights on a floor. The first person to arrive in the morning would, therefore, turn on the lights on his or her half of the floor, and the lights would remain on until security staff switched them off after the last person had left in the evening. The irregular hours of the External Affairs staff compounded the problem, because one person coming to work in the evening meant half the floor would have to be lit. It was not unusual for 25 to 30 percent of the building to be lit at midnight or later, even though only a handful of people were on the premises.
The monitoring program demonstrated that the test area's total load of 16 kW was being turned on at about 08:OO hours and left on until about 20:OO hours (8:OO PM), see Fig. 2.
Between fifty and sixty switches were installed on the test floor. Subsequent monitoring revealed that, because of the new switching, lighting loads grew Table 1. Lighting energy consumption, monitoring/measuring techniques.
1. k w h meter 2. Recording W meter 3. AC elapsed time indicator 4. Time-lapse photography2 5. Estimate hours/calculate watts 6. Lighting Energy Estimated installed cost per circuit Advantages $250 Reads energy directly
$5,000 Profile
Separately records demand and hours of use $70 Separately gives hours
of use
$250 Detailed profile of use
0 lnexpensive
$85 lnexpensive
Separately records hours
Disadvantages
Expensive to install especially if discrimination between circuits required e.g., different offices, restricted locations for easy reading.
Expensive to purchase
Difficult to identify individual switch circuits. Expensive to install
Restricted location for easy readings Slow information retrieval
Research tool only
Accuracy depends on time between frames Inaccurate
C m s e profile *-
. .
Monitor"The cost of the Light Reader (approx. $200) is not included since only one required per building or organization
Figure 2. Kilowatt demand at Lester Pearson Building (before and after switching retrofit).
gradually each morning starting a t about 07:OO hours, and reached a peak of 13.5 kW between 12:OO and 16:OO hours. The final results of this study were en- couraging: after the switches were installed the test area's kilowatthour consumption dropped by 40 to 48 percent and the peak demand fell by about 15 percent.
The new switching arrangement was planned by breaking down each floor's circuits into the individ- ual areas to be switched. Flexibility was desirable because of periodic changes in the layout of the office space. Any additional line voltage returns were taken back to the main panels through loop conduit sys- tems installed around the test floors. Distribution boxes were located a t regular intervals on the ceiling. Additional connections were made with armored cable from the distribution boxes to the lumi- naires.
On each floor, the return to the main panel was connected to a low voltage relay, and the relay was controlled by a remote switch in the area being lit.
The LEM could have been used to some advantage in this building to check consumption on the other floors, thus creating a firmer data base for both the pre and post control installation. The test area was only one-half of the one floor in a building with a total of 23 floors. In addition, the LEM can distinguish whether the energy savings found are symmetrically distributed throughout the building or whether of- fices with daylight, for instance, have a strong in- fluence on the total savings. This information would be valuable for optimizing the installation of switches among the total office space and, therefore, mini- mizing installations costs.
T h e Jeanne Mance Building, which houses Health and Welfare Canada.
This building, also used for general office work, has a normal office occupancy pattern during regular working hours.
In the Jeanne Mance Building, an initial study of a test area on one floor using the recording watt meter revealed that the total 30 kW load was being turned on between 06:30 and 07:30 hours and left on until about 21:OO hours (9:OO PM), see Fig. 3. The switch- ing system on each floor consisted of a gang of six switches mounted on both sides of the floor. Because
the switches were remote from the lights they con- trolled, the first person to arrive in the morning would flick on all six switches on his or her half of the floor. The lights would then remain on until night security staff switched them off.
Sixty switches were installed in private offices on one floor of the building. The method for installing switches was identical to that employed in the Lester B. Pearson Building previously described.
At the completion of this retrofit stage, demand was reduced by five percent and energy consumption fell by 20 percent. These results were disappointing compared with the savings achieved in other build- ings. It was concluded that many of those with the new switches in their private offices were perhaps not making the best use of them. Automatic timing switches were considered as a possible solution.
However, after deploying 60 LEM's in the private offices, it was soon discovered that those with switches were making excellent use of them, typically consuming between eight and nine hours of lighting energy each day. In fact, the private office con- sumption had dropped by 40 percent, consistent with previous experience. The overall consumption in the office space remained relatively high because the lighting circuits in the corridors and circulation areas had not had additional switches installed.
National Library and Public Archives, a building which is used for document storage.
Activities routinely carried out in this building involve the filing and retrieval of documents by em- ployees and by the general public. The building is usually occupied only during normal working hours.
A building used for similar purposes, the Archives Storage Building, was selected for extra switching at a later date and will be discussed briefly in this paper.
Initial data from several LEM's installed indicate an average daily use of lighting between 16 and 17 hours. This justified investigating the installation of more switches.
Before the installation of the new switching system in the National Library and Public Archives, a re- cording watt metershowed that the test area's total load of 17 kW was turned off between 21:OO (9 PM)
Figure 3. Kilowatt demand at Jeanne Mance Building (be- fore and after switching retrofit).
Figure 4. Kilowatt demand at National Library and Archives (before and after switching retrofit).
and 22:OO (10 PM) hours, see Fig. 4. Each switch controlled three rows of shelving, each 10 ft long, which represents a load of 300 W.
It was decided to install switches in the library stack areas. Thus, the only lights left on were the aisle lights between stack rows. The stacks themselves remained unlit until they were required. After monitoring the new lighting patterns, it was discov- ered that the switches had reduced the maximum demand dramatically to 4 or 5 kW. The energy con- sumption was reduced by over 80 percent.
While planning the new switching system for the National Library and Public Archives, it was found that the circuit arrangement and the low number of luminaires per switch made it most practical to use line voltage three way switching, with a switch a t both entrances of each row.
An important consideration when using this type of switching is whether the area is normally occupied.
If it is, employees must be made aware of energy
conservation procedures in order to ensure that un- necessary lights will be turned off.
If the building is not normally occupied, then what is needed is a switching system similar to the one discussed below for the Archives Storage Building.
Another important point to consider was the need for good lighting levels in the main aisles. Because the stack lighting in this building had originally been designed to be switched on a t all times, a low level of lighting had been quite adequate for the main aisles. With the new system, however, aisle lighting became much more important, and it was found that existing levels were too low for reading identification codes on the stacks. As a result, there was a self-defeating tendency to leave stack lighting on to illuminate the aisles. Thus, a paradoxical situation emerged in that aisle lighting required upgrading in order to save energy.
The Archives Storage Building was also identified as a potential space for switch retrofit on the basis of data collected with the LEM's. When designing the switching arrangement for the Archives Storage Building test section, experience gained a t the Na- tional Library and Public Archives suggested that switches should be installed a t both ends of every row. Aisle lighting had to be adequate for safety and
for identifying the aisles. It was suspected, however, that because the building is not in steady use and because personnel are not assigned to areas on a regular basis, lights would not be switched as con- scientiously as in the National Library and Ar- chives.
Because of this and because the stack layout lent itself to low voltage switching, it was decided to in- stall a low voltage switching system and observe the results. Suspicions were confirmed when it was found that switches were not being used. In fact, lighting was on the same number of hours as before switching was installed.
T o compensate for this, an overriding master switch was installed in the off circuit. Security staff could then turn all lights off a t night, and employees could not turn all lights on simultaneously. When an employee switched on one row of shelving, he or she was more likely to turn it off again if the surrounding areas were in darkness.
The use of an overriding master switch had a tre- mendous effect on energy consumption in the Ar- chives Storage Building, making its results compa- rable to those of the National Library and Archives Building.
The Sir William Logan Building occupied by the
Department of Energy, Mines and Resources. The building is used for general office work and is the first building to undergo extensive monitoring using LEM's. Five floors of the 20 story office building were selected for monitoring. The switching on each floor had been upgraded from a single switch per floor to five. One switch controlled the lighting load in the elevator lobby (typically either 0.25 kW
or 0.70
kW),
and the remaining four switches dividedthe office area into four zones, each with a lighting load of approximately 5.5 kW. In total, five LEM's were required on each floor to monitor the major loads (i.e., excluding security lighting, washrooms, small conference rooms).
A sample of the results collected during a four week period in late winter are presented in Fig. 5.
The minimum hours of use were approximately 60 hours per 5 day week compared to a maximum of 80 hours. Overtime occupancy during the weekend varied up to 30 hours. The spread in hours among the zones in each floor indicates the savings with the zonal switches compared to a single switch per floor. The average saving in the week amounted to only five percent, whereas during the weekend it amounted to between 17 and 60 percent.
The switching arrangement at the Logan Building is of interest. A central control system a t the com- missionaire's desk on the ground floor allows the switching on and off of all lights on a floor but does not control individual zones on each floor. At the floors themselves, switch panels in the elevator lobby permit individual control of each of the five zones.
Personal interviews with the building maintenance manager revealed that the commissionaire turned all lights on a t each floor around O6:30 hours and then off again at 18:30 hours (6:30 PM). The data collected and presented in Fig. 5 confirm this usage pattern. Experience has shown from interviews in many other
L.0.nd nmmu NE quadrant
-
--
SE quadrant NW quadrant ur SW quadrant...
Lobby w 1 r ia+:*
1 I Weak 3rd. Floor 17th. F l o o rFigure 5. E.M.R. Logan Building (switching profiles). buildings that data obtained by personal interviews are not always as reliable as with this particular building.
On the basis of the information collected using the LEM's, some suggestions for reducing lighting con- sumption can be advanced. The most appealing suggestion involving no capital expenditure is to in- struct the commissionaire not to turn the entire building illumination system on a t 06:30 hours, but to allow the first occupants to switch their individual zones as they arrive at the working floors. Inspection of the security lighting in the building indicates that there is sufficient security illumination to permit this procedure. If this were not the case, the central con- trol could be altered to allow central switching of the individual zones on each floor. LEM's could be em- ployed to monitor the degree of success of this sug- gestion and any test areas selected for finer zone control by the introduction of more switches.
Other office spaces. Numerous office spaces in the National Research Council buildings have been monitored continuously for over 1 2 months to test the accuracy of the LEM's, battery life, durability of mounting bracket, etc. Results demonstrate that the units have performed excellently and, most impor- tant, do not require skilled technicians for installa- tion, maintenance, or data collection.
Pay-back periods. Throughout this paper, the different factors that led to decisions to install extra switching capacity have been mentioned in terms of lighting energy consumption only. However, some
very relevant considerations have been neglected quite deliberately. The effect of switching, for ex- ample, on building heating and cooling systems has not been examined.; nor has the calculation of cost recovery periods. The reason for this is that, while energy savings from light switching in a building will remain constant, all other factors are dependent on such variables as geographical location (climate), power costs, and local tradesmen labor rates. Therefore, each building must be evaluated sepa- rately to determine, first, whether light energy re- ductions help or hinder other building functions and, second, whether the energy cost being avoided can justify the additional expense.
The purpose of this paper has been to describe the method of data collection by which a building owner or operator can check whether the installation of switches can be justified and to illustrate the extent of lighting energy savings that can be achieved.
An additional important factor not discussed has been the motivation and training of the building occupants to take advantage of new switching con- trols. Initial acceptance of the new control system must be worked on as well as periodic reinforcement strategies to maintain good switching habits. Conclusion
Lighting controls have enormous potential to re- duce lighting energy consumption without in any way adversely affecting the comfort, safety and produc- tivity of building occupants.
In order to exploit this potential, it is necessary to document lighting consumption both prior to and after the installation of controls. Post control in- stallation monitoring is essential to ensure that initial savings are maintained.
The sample of buildings documented in this paper demonstrate the magnitude of the energy savings that can be achieved and should be interpreted as encouragement for those with the authority to install controls to seriously consider these installations. Using the inexpensive Lighting Energy Monitor a small test area can be monitored in order to project pay-back periods for larger retrofit.
Acknowledgments
The authors wish to acknowledge the technical assistance of Donna Kealey, Public Works Canada, and Ralston Jaekel, National Research of Canada, during the course of this project. They also wish to mention that this joint contribution is published with the approval of the Director, Division of Building Research of the National Research Council of Can- ada and the Chief of Energy Conservation Core Group, National Capital, Public Works Canada. References
1. A. W. Levy and A. J. Szanto, "A new lighting energy monitor," LIGHTING DESIGN AND APPLICATION, Vo1.10. NO. 9, September 1980, p. 36.
2. A. W. Levy, "Lighting controls, patterns of lighting consump- tion, and energy conservation," IEEE Transactions on Industry
DISCUSSION
D. G. LUCHACO:' The paper provides good examples of the po- tential for energy savings resulting from improved control of lighting. The easily installed and inexpensive Lighting Energy Monitor described is a significant advance in enabling evaluation of lighting usage patterns. The energy savings attained in the test installations were quite impressive.
One point which was not presented is the duration of the tests which found the basis of the reported energy savings. The novelty of the experiment may have encouraged good energy habits among the users of the space initially. The physical presence of the Lighting Energy Monitors may also haveserved as a psychological impetus to use the switches. As mentioned by the authors, the problem of motivating people to use the controls on a continuing basis must be solved to make any manual switching system useful over the long turn.
T. MCGOWAN:~ Presented in this paper are some useful and practical data which help to confirm the notion that substantial lighting energy reductions are possible simply by turning lighting off when it is not required. Further, the savings occur without sacrificing either lighting quality or quantity. Unfortunately, this idea has been neglectedin most of the guidelines, legislation, codes, studies, and other lightinglenergy information which has been presented up until now, so I commend the authors for docu- menting it so carefully with their studies. Perhaps it should have been given more emphasis in their first conclusion.
I t would appear that some additional conclusions could be drawn from their data. Would the authors agree with the fol- lowing?:
1. Most enerev savings occur a t the beginning and end of the
.,-
-
-
- day. Figures 2,3, and 4 indicate that early arrivals and people who forget or do not know how to turn off their lights when leaving a facility cause most of the addiiional lighting energy usage.2. A realistic goal for office building lighting energy reductions as a result of adding switches and user education is 40-50 percent. My own work with automatic switching systemsa indicated this and the data you report average out in this range (neglecting the anomaly in the Jeanne Mance Building).
Finally, I have a couple of questions. (1) Did you follow any particular criteria when deciding to use low voltage relays rather than line voltage switches such as length of run or number of switch points? (2) Where is the information on the Lighting En- ergy Monitor to be published?
Reference
a. T. K. McGowan and G. E. Feiker, "A new approach to lighting system control," JOURNAL OF THE ILLUMINATING ENGINEER- ING SOCIETY, Vol. 6, No. 1, October 1976, p. 38.
C. SNYDER? Can the LEM be operated with artificial sources operating from dc as well as high frequency. Also, any problems from lead-lag ballasts?
J. E. JEWELL:§ Canada's Public Works Department and National Research Council are to be congratulated for supporting the work reported in this paper. For too long, too much time has been spent on light levels and not enough on the issue of controlling lighting systems in time. Absolutely the finest way in the world to conserve energy in lighting is to turn off the lights. This paper reports on the happy outcome of the addition of light switches and the im- portant energy savings which resulted.
The application of a simple and inexpensive means of mea- surement of usage is an important aspect of this paper. Energy savings need to be documented in specific locations since it is difficult to draw exact conclusions from total utility "send out" figures or even from the usage figures for an entire building. The monitor described here should be of great help in documenta- tion.
Canada has set a great example in addressing controls as an "enormous potential" for energy conservation. Other nations should follow this example.
AUTHORS: We want to thank Mr. Luchaco, Mr. McGowan, and Mr. Snyder, for their thoughtful comments and discussion. Mr. Jewel1 is most generous in his remarks and they are appre- ciated.
We will first address the points raised by Mr. Luchaco. The duration of our tests varied widely. We installed LEM's on two floors of the Jeanne Mance building in December 1979 and as of September 1980 they were s t i m n g monitored. The average daily use referred to in the paper for these floors represents the average of readings taken over a six month period. After switches were installed in private offices (February 1980), LEM's were installed and have been monitored ever since. The usage patterns discussed in the paper cover the entire monitored period. The profile of lighting demand after switches were installed was obtained over a two week period with a recording watt meter.
Like Mr. Luchaco, we were a t first suspicious that the initial dramatic drop in light use was due to the conspicuous presence of the LEM's and to the weekly visits of our technician to read the LEM's. However, six months have passed, our technician now * Lutron Electronics Company, Coopersburg, Pa. t Sterner Lighting Systems Inc., Winsted, Minn.
+ General Electric Company, Cleveland, Ohio. 5 Pacific Gas and Electric Company, San Francisco, Cal.
appears monthly rather than weekly, and half of the test floor's population has moved out and been replaced by new people. In spite of this, the floor's average daily light use holds steady a t between seven and seven and a half hours. That is a very encour- aging sign that people are sufficiently motivated to make private office switching a success.
Regarding Mr. McGowan's observations, we agree that early arrivals and late departures account for a disproportionate amount of energy. Switching limits the number of lights affected in such cases and essentially eliminates the problem. We've found that people in private offices are very conscientious about switching off their lights. I t can be quite difficult, however, to get people to switch off lights that several people use. Corridors, reception areas, and open offices pose special problems that need careful attention. In the Jeanne Mance Building, we installed extra switches in all corridors and reception areas. While this increased our energy savings, results were still not as impressive as in the private offices. This is where the use of low voltage switching is superior to line voltage switching. We can, if we wish, automatically switch any circuits a t low additional cost and exert our own control over problem areas. That isn't possible with line voltage switching.
We used several criteria to choose between line and low voltage
switching. Initial cost, the need for central control, the number of switches, the length of runs, the lights per switch and the like- lihood of future changes to a floor's layout were major consider- ations. For example, because the Archives Storage Building is largely occupied, we installed low voltage switching with an overriding master switch in the off circuit. At the National Library and Archives, however, we installed line voltage switching because of the low number of lights per switch and because there were employees who could assume responsibility for turning lights off.
In answer to Mr. Snyder's enquiry, the LEM will not monitor lamps operated from dc supply. They only respond to lamps on ac supply and for a regular device up to frequencies of approxi- mately 1 kHz. A regular unit designed for 60 Hz response would have to be calibrated for any other frequency or alternatively a special LEM fabricated.
The devices do operate when exposed to lamps operated from lead-lag ballasts. Extensive testing has not been performed with these ballasts so it would be prudent to check calibration prior to taking actual readings. Calibration is accomplished by simply checking that after 10 or 15 minutes elapsed time with the lamps on, an equal period is recorded on the LEM.
This publication i s being distributed by the Division of Building R e s e a r c h of the National R e s e a r c h Council of Canada. I t should not be reproduced in whole o r in p a r t without permission of the original publisher. The Di- vision would be glad to be of a s s i s t a n c e in obtaining such permission.
Publications of the Division may be obtained by m a i l - ing the appropriate remittance ( a Bank, Express, o r P o s t Office Money Order, o r a cheque, made payable to the Receiver General of Canada, c r e d i t NRC) t o the National R e s e a r c h Council of Canada. Ottawa. K1A OR6. Stamps a r e not acceptable.
A l i s t of a l l publications of the Division i s available and may be obtained f r o m the Publications Section, Division of Building Research, National R e s e a r c h Council of Canada, Ottawa. KIA OR6.