Publisher’s version / Version de l'éditeur:
Vous avez des questions? Nous pouvons vous aider. Pour communiquer directement avec un auteur, consultez la première page de la revue dans laquelle son article a été publié afin de trouver ses coordonnées. Si vous n’arrivez pas à les repérer, communiquez avec nous à PublicationsArchive-ArchivesPublications@nrc-cnrc.gc.ca.
Questions? Contact the NRC Publications Archive team at
PublicationsArchive-ArchivesPublications@nrc-cnrc.gc.ca. If you wish to email the authors directly, please see the first page of the publication for their contact information.
https://publications-cnrc.canada.ca/fra/droits
L’accès à ce site Web et l’utilisation de son contenu sont assujettis aux conditions présentées dans le site
LISEZ CES CONDITIONS ATTENTIVEMENT AVANT D’UTILISER CE SITE WEB.
ASTM Special Technical Publication, 922, pp. 567-581, 1987
READ THESE TERMS AND CONDITIONS CAREFULLY BEFORE USING THIS WEBSITE. https://nrc-publications.canada.ca/eng/copyright
NRC Publications Archive Record / Notice des Archives des publications du CNRC :
https://nrc-publications.canada.ca/eng/view/object/?id=62444b73-412b-4ddd-a50d-03420f241a7b
https://publications-cnrc.canada.ca/fra/voir/objet/?id=62444b73-412b-4ddd-a50d-03420f241a7b
NRC Publications Archive
Archives des publications du CNRC
This publication could be one of several versions: author’s original, accepted manuscript or the publisher’s version. / La version de cette publication peut être l’une des suivantes : la version prépublication de l’auteur, la version acceptée du manuscrit ou la version de l’éditeur.
Access and use of this website and the material on it are subject to the Terms and Conditions set forth at
A Calorimeter for determining heat transmission characteristics of
windows
Ser
National Research Consell nationalT
il
C ouncll Canada de recherches CanadaM21d
no.
1544
Institute for Research in lnstitut de recherche enc - I Construction construction
BLDG
A
Calorimeter for Determining
Heat Transmission
Characteristics of Windows
by R.P. Bowen and K.R. SolvasonReprinted from
Thermal Insulation: Materials and Systems ASTM, STP 922,1987
p. 567
-
581(IRC Paper No. 1544)
NRCC 29068 NRC
-
C I S T II R C
iI
L l B R A R Y
S f
P
9
132L
~ r ~ t r o r t r ~ ~ u e
I R C
CNRC-
IctlBTLa perte de chaleur par les fenCtres preoccupe de plus en plus les consommateurs, les fabricants et les concepteurs de bitiments. La technologic tvolue et elle devrait apporter des am6liorations importances au plan de la performance .thermique. Pour aider
A
l'haluation des prcduits existants et des nouveaux, la Division des recherches en b5timent du Conseil national de recherches du Canada (DRBICNRC) a consu et c o n s n i t un nouveau calorimkwe destinC i son installation d'essais climatiques.
Ce document pn?sente une fapn de dttemher les caracttistiques des fenEtns du point de w e de la tmnsmission de la chaleur h I'aide des consrimants radiatifet convectif d t nansfert
de chaleur entre Ic calorimka et la surface de I'ichantillon. Gdce 5 des essais d'CtaIonnage avec des rnnrtSriaox de conductance connuc, on pcut dtterminer dcs expressions reprksentant I'Ccl~ange dt rnyonncrncnt entrt les surfaces du calorimtm t t l9&chandton et e n m I'air du calonmka tt 1'6chnrrtiKon. Ces expressions strvent ensuite,
lors du contr6le d'une fenCtrt, calcuItr une temptratwe supeficielle equivalente pour la fenhe. Cette technique s'impose du fait de la difficdt6 de dtterminer unc temptrature supcrficielle moyenne sur du vme.
Cette technique ? cornporte des ir diffkrentes tail1 u n calorimttre uniforme. On pn5lirninaires. en oeuvre zils pour au point ~pkrature rtsultats
Authorized Reprint 1988 from Special Technical Publication 922 1988
Copyright American Society for Testing and Materials, 1916 Race Street, Philadelphia, PA 19103
Robert
P. Bowen' and
K .
Richard ~olvason'
I
A
Calorimeter for Determining Heat
Transmission Characteristics of
Windows
REFERENCE: Bowen, R. P. and Solvason, K. R., "A Calorimeter for Determining Heat Trams- mission Characteristics of Windows," Thermal Insulation: Materials and Systems. ASTM STP 922. F . J. Powell and S. L. Matthews, Eds., American Society for Testing and Materials, Philadel- phia, 1987, pp. 567-581.
ABSTRACT: Heat loss through windows is receiving an increasing amount of attention from con- sumers, manufacturers, and building designers. The technology is changing and should lead to substantial improvements in thermal performance. To assist in the evaluation of existing as well as new products, the Division of Building Research, National Research Council of Canada (DBR/ NRCC), has designed and built a new calorimeter for use in their Environmental Test Facility.
This paper presents an approach for determining the heat transmission characteristics of win- dows using the radiative and convective components of heat transfer from the calorimeter to the specimen surface. Through calibration tests using materials of known conductance, expressions for the radiation exchange between the calorimeter surfaces and the specimen and the calorimeter air to the specimen can be determined. These expressions are then used when testing a window to calculate an equivalent surface temperature for the window. This approach is necessary because of the difficulty in determining an average surface temperature on glass.
Although the approach can be used with conventional calorimeter designs, uncertainties are introduced because of the changing calorimeter characteristics for different sizes of specimens. To reduce the uncertainties, the new calorimeter was designed to have a constant convection coeffi- cient and uniform temperature radiation field. The calibration program is discussed, and some preliminary results are given.
KEY WORD: windows, thermal performance, laboratory measurement, conductance, guarded hot boxes, calorimerers, thermal insulation
Consumers and manufacturers are placing more emphasis on the thermal performance of windows since they can constitute a substantial heat loss in winter. Consumers are demanding improved thermal performance, and manufacturers are responding with new techniques and products. A test to determine the heat transmission characteristic is required to assess the rela- tive therqal merits of window systems.
Presently, two ASTM test methods are used for determining the heat transmission of win- dows: the ASTM Test for Steady-State Thermal Performance of Building Assemblies by Means of a Guarded Hot Box (C 236-80) and the ASTM Test for Thermal Performance of Building Assemblies by Means of a Calibrated Hot Box (C 976-82). These standards, however, were not developed with windows in mind. Establishing the overall coefficient of heat transfer ( U value) or thermal conductance ( C value) of a window presents a number of unique problems that must be accounted for in the test method and test apparatus calibration. These problems include measurement of glass temperature, establishing the heat flow through the wall surrounding the
'Research officer and senior research officer, respectively, National Research Council of Canada, Divi- sion of Building Research, Ottawa, Ontario, Canada KIA 0R6.
568
THERMAL INSULATION: MATERIALS AND SYSTEMSwindow specimen, and determining the effect of specimen size on apparatus calibration and on possible air leakage through the specimen.
Ad hoc tests using the Division of Building Research (DBR). National Research Council of Canada (NRCC), Environmental Test Facility indicated a 1.3-degree-kelvin difference in ther- mocouple measurements of the same point on a glass surface resulting simply from varying the attachment to the glass. The attachment techniques compared were different lengths of 12-mm- wide aluminum tape and 12-mm-wide cloth tape. The method providing the highest reading was with 75-mm cloth tape only, and the lowest reading was obtained with 75-mm aluminum tape only. Figure 1 presents the isotherms on the room side surface of a sealed unit subjected t o a 56-degree-kelvin temperature difference. This is an indication of how difficult it would be to establish a single value for the room-side glass surface temperature by surface thermocouple measurements.
The objective of this paper is to present an approach for determining the heat transmission characteristics of windows and to discuss a new calorimeter design that will overcome some of the uncertainties associated with conventional calorimeter designs used with guarded hot box test facilities.
HERMETICALLY SEALED GLAZ l NG U N I T TRIPLE-GLAZED 2 - 6 mrn A I R SPACES WEATHER SIDE: -35 C: ROOM SIDE: 21' C ISOTHERMS A T 1 'C INTERVALS
BOWEN AND SOLVASON ON HEAT TRANSMISSION OF WINDOWS
569
TheoryThe heat transfer through a window, Q,, can be represented as
Q, = U A A T (1)
where
Cl
= the overall coefficient of heat transfer, in watts per square metre kelvin,A = the area of the specimen, in square metres, and
AT = the temperature difference across the specimen, in degrees kelvin.
The U value cannot be measured directly but can be derived from measured values of Q,, A ,
and AT.
The Q, can be determined by using a calorimeter or metering box placed over the room side of the window and support wall (Fig. 2). The total energy input to the calorimeter is measured after steady-state conditions are reached and represents the total loss from the calorimeter, QT. This total heat transfer can be expressed as
where
Qb = heat flow through the calorimeter walls, and
= heat flow through the support wall for the specimen (referred to as the mask loss). The net heat loss or gain through the calorimeter walls is minimized or made equal to zero by
STEEL TEST FRAME POLYSTYRENE SURROUND
R O O M S I D E W E A T H E R S I D E
FIG. 2-Conventional configuration for calorimeter mounted on the room side of the specimen and port wall.
570 THERMAL INSULATION: MATERIALS A N D SYSTEMS
controlling the guard box air temperature. so that the mean temperature difference across the calorimeter walls is practically zero. The heat flow through the specimen is then
Q,
is determined from calibration runs on the mask.The determination of A T is difficult because the heat flow through the specimen is trans- ferred from the calorimeter to the specimen surface by a combination of radiation and convec- tion. Therefore, the calorimeter surface temperatures as well as the mean air temperature must be determined to define the inside temperature to which the specimen is exposed. Care must also be taken in determining the weather side temperature. The following is a detailed discus- sion of this problem including a technique for determining the window surface temperature for use in calculating the heat transmission for a window.
The
U
values commonly used by designers and specifiers for windows are those recommended by the American Society of Heating, Refrigeration and Air-Conditioning Engineers (ASHRAE) [I]. Table 1 summarizes values for the overall coefficient of heat transfer, U value, and overall thermal resistance, R value, using data from Chapter 23, Table 8, of the ASHRAE Handbook of Fundamentals (R = I / U). The values were calculated using the surface film coefficients assumed for natural convection on the room sideIfi
= 8.29 W/(m2. K)] and forced convection on the weather side of the windowVo
= 34.1 W/(m2.
K)]. The combined resistance provided by the inside and outside air film, l/fi+
l/fo, is 0.15 ( K.
m2/W). Compared with the total R values, the inside and outside air film represents a significant component of the thermal resis- tance assumed for current window designs. Since the air films generated by a test setup will be facility dependent, they may not match the values used by ASHRAE or be the same from one apparatus to another. The air films will also vary for a given apparatus depending on the size of the specimen.Two different approaches to the air films are possible. One is to establish a test procedure that would involve adjusting the equipment to obtain an air film resistance similar to that of ASHRAE, and thereby yield an overall thermal transmission value, the
U
value. The other approach is to determine the air film resistance for a particular facility or test setup and deter- mine a C value. The C value is the heat transfer between defined surfaces (that is, no boundary air films). In the latter case, standard air film values could be added to obtain aU
value.Either approach would be satisfactory if the mean surface temperature of the glass could be measured accurately. The following factors indicate the difficulty in establishing a mean value for the specimen surface temperature from thermocouple measurements: two-dimensional heat flow at the perimeter of the glazing, the glass deflection associated with barometric changes. thermocouple contact error, and disturbance of the air film caused by the many thermocouple wires required to adequately establish the temperature profile.
TABLE 1-Thermal resistance. R value. of hermetically sealed glazing. -- - U Value, R Value. Glazing W / ( m 2
-
K) K. m2/W Double 6-mm air space 3.3 0.30 13-mm air space 2.8 0.36 Triple 6-mm air space 2.2 0.45 13-mm air space 1.8 0.56In the early stages of development of guarded hot box test facilities at the Division of Building Research 121, it was shown that the relationships describing radiant and convective components of the inside surface coefficient could be used to determine an equivalent inside surface temper- aturefor nonisotropic walls. The heat exchange,
Q,,
between the test specimen and the guarded hot box can be expressed aswhere
Q,
= the radiant heat exchange between the calorimeter surfaces and the specimen surface, anda
= the convective heat exchange between the calorimeter air and the specimen surface. In a gray enclosure, the radiation exchange between two surfaces can be expressed in the form I31where
A = area of Surface 1,
Slb = the overall interchange factor for radiation from Surface 1 to Surface b,
a = the Stefan-Boltzmann constant, and
Tb, T I = the absolute temperature of Surfaces b and 1.
For one source (guarded hot box), one sink (test wall), and no interconnecting surfaces, the 51b
is obtained from the following: From McAdams (Eq 4-33)
Solving for
Sib
Then, if the geometric view factor, Fib, equals 1
This expression for radiation heat exchange can be used to approximate the radiation exchange to a window specimen if the box surface temperatures remain uniform and the interchange between the box and the mask is definable. If not, the geometric view factor would not be one, and a more detailed analysis would be required. This will be addressed in more detail in a subsequent paper discussing the calibration of the window calorimeter. The convection compo- nent is approximated by
572
THERMAL INSULATION: MATERIALS AND SYSTEMSwhere
q, = convective heat transfer per square metre, Th = air temperature in the box. and
B. C = constants determined for the box.
The constants can be determined over a range of heat flows by calibration with specimens of known conductance similar to that of double or triple glazing.
Equations 5 and 7 can also be written as
where
q, = radiant heat exchange per square metre. h, = S I ~ U ( T ~
+
T:)(T~+
TI), andh, = C(Th
-
When Th
+
Tb, the sum of the two d ~ c i e n t s , h, and h,, provides the inside film coefficient.fi. If TI, = Tb, the total heat transfer to the specimen can be expressed asIf the constants for the box are known, specimens of nonuniform conductance, such as win- dows, can be evaluated. Measuring Q,, Th, and Tb, a mean specimen surface temperature, TI, can be found by using Eqs 4.5, and 7. Once TI, is calculated, the inside surface coefficient can be determined from Eqs 8 and 9.
The outside air film can be provided by forced convection. Previous unpublished develop- ment work on a test method to measure the condensation potential of metal window frames led to an understanding that local coefficients adjacent to the framing would affect the frame heat loss and thus the inside surface temperature. This work led to the design of the DBR wind machine (Fig. 3). which produces a very uniform and repeatable weather side air film. The air film can be established during calibration and used to calculate the outside surface tempera- ture. T2, by using measured outside air temperatures, T,. Unlike the room side temperatures. the weather side box temperatures in the view of the window (wind machine tubes and back wall) remain close to that of T, (within approximately 0.1 degree Celsius).
Probknu with a Conventional Calorimeter
Initial work on the development of a test method for the
U
value of windows (see the Appen- dix) showed that the conventional type of calorimeter design was not suitable. The main con- cern is the inability to maintain a uniform and definable calorimeter surface and air tempera- ture. Placing a window in a wall onto which the calorimeter is mounted produces a large difference between the heat transfer from the calorimeter to the window and to the support wall. This difference causes the temperature fields of Tb and Th, used in the preceding discussion, to be nonuniform. For example, in the test on the sealed double-glazing unit with a 55-degree-BOWEN AND SOLVASON ON HEAT TRANSMISSION OF WINDOWS 573
M A S K
S P E C l MEN
D I A M E T E R T U B E S
FIG. 3-Wind machine. Air is blown at t?ze face of the specimen through tubes spaced 115-mm on cen- ters. The bank of tubes rotate so that each tube is moved in a 76-mm-diameter circle.
kelvin temperature difference from calorimeter air to weather side air, Tb, as measured on the baffle immediately in front of the window, was 6.9 degrees kelvin lower than that measured directly in front of the support wall. A systematic error, AT, = 1 K , in establishing the weighted mean temperature of the baffle, Tbr results in an error of approximately 7% for the constant, C,
in Eq 6 and a 6% error in the value determined for the inside film,fi.
The establishment of the calorimeter air temperature, Th, can also introduce systematic er- rors. The air stream that flows down over the window and up behind the baffle is reheated by electric heaters running the full width of the calorimeter. Since electric heaters provide constant flux over their length, a horizontal gradient in the air caused by the convective losses from the air stream as it falls over the window and surrounding mask, will not be eliminated as the air flows over the heater.
DBR Window Calorimeter-Design and Construction
From experience using the calorimeter designed for testing walls, and consideration of the preceding approach for windows, it was clear that if an accurate, repeatable, and reproducible
574 THERMAL INSULATION: MATERIALS AND SYSTEMS
test procedure was to be developed, the uncertainty in the values used for the surface tempera- tures on the baffle in view of the window, Tb, and the air temperature. Th, had to be reduced. Also, consideration had to be given to the different sizes of windows that might be tested and the resulting impact on the temperature gradients associated with Tb and Th.
To meet these requirements, a new calorimeter was designed for measuring the heat trans- mission characteristics of windows with the following features:
( a ) a constant and uniform temperature baffle, and (b) a constant and uniform temperature convection heater.
I To achieve a constant and uniform temperature on the baffle, an evaporating/condensing :
panel using Refrigerant 12 was designed (Fig. 4). Three condensing panels (744 by 2632 mm)
,
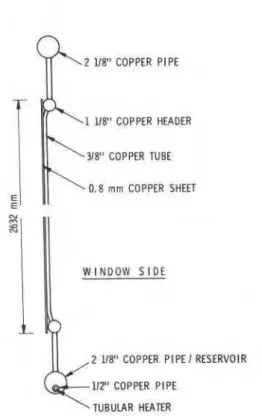
were connected together to form a baffle 2232 mm wide by 2632 mm high for the new calorime- ter. An electric tubular heater is contained in a pipe reservoir connected to the panels for boiling the refrigerant.The constant and uniform temperature convection heater was also obtained by evaporating and condensing the refrigerant (Fig. 5). The heater was constructed of two fin tubes connected to a copper pipe reservoir, which contained a second tubular heater of the same power rating as the one in the pipe reservoir of the baffle. The baffle and convection heaters were selected to have as short a cold end as possible and be capable of maintaining a 65-degree-kelvin tempera- ture difference across a specimen 2.44 by 2.44 m with a U value of 0.35 W/(m2.
K).
Theeon- stant temperature baffle and convection heater were installed in a new calorimeter box con- structed as shown in Fig. 6.2 118" COPPER PIPE I RESERVOIR 112" COPPER PIPE
TUBULAR HEATER
BOWEN AND SOLVASON ON HEAT TRANSMISSION OF WINDOWS 575
I T I I N 1 TUBING. 2285 rnrn LONG
1 U4" COPPER PlPE I RESERVOIR 117' COPPER PlPE
TUBULAR HEATER
FIG. 5-Uniform temperature convection heater.
Calibration
The objectives of the calibration program currently in progress are as follows:
( a ) to check the total power input measurements of the window calorimeter.
( b ) to determine the uniformity of the baffle and air temperatures, Tb and Thr and
( c ) to determine B and C constants (see Eq 7) for a range of power requirements and for different sizes and orientations of calibration specimens.
Using a homogeneous wall constructed of material with known conductivity, tests were con- ducted using the window calorimeter. The power and A T across the specimen at a number of different room side and weather side temperature conditions were measured. The thermal con- ductance of the specimen determined using the window calorimeter and the values obtained with the wall calorimeter are shown in Table 2.
Having established the ability to determine total power input to the calorimeter,
QT,
the sup- port wall for the window specimens was built without openings and tested to determine the conductance and mean temperature dependence. Calibration specimens simulating very simple windows I .O by 1.6 m and 1.0 by 0.8 m will be used to establish the values of B and C over the expected range of power requirements for the calorimeter. During these tests the performance of the baffle and convection heater will be established.Expanded polystyrene was used for the core of the wall since it represented a material that had a stable conductivity with time and could be sealed to maintain a low moisture content. TO protect the polystyrene from mechanical damage and to facilitate a modular construction with a spline connecting system, 17 mm of plywood was laminated to both sides, using a water-based contact cement. The wall was made in sections to allow initial calibration and subsequent inter- changing or substitution of wall sections for calibration specimens. The nominal conductance of the wall is 0.326 W/(m2
K)
at O°C mean temperature.The first calibration specimens were constructed of 11-mm extruded polystyrene laminated to 3-mm glass on each side. Thermocouples could be used to measure the temperature at the glass/polystyrene interface since problems discussed earlier regarding measurement of glass temperature at an air/glass interface would not be a factor. Thermocouples were placed be- tween the glass and the polystyrene (Fig. 7). The tips were soldered to 25 by 38-mm copper shims and then glued to the glass surface before the glass was glued to the polystyrene. After testing with glass surfaces on both sides, the room side surface will be modified to provide a low- emissivity surface. The low-emissivity surface reduces q, relative to q,, so that errors associated with it should have little effect on q,.
The calibration procedure involves the measurement of
QT,
Tb, T I , Tz, Th, andT,.
The mask loss is calculated from surface temperature measurements on the mask and the conductivityTABLE 2-Comparison of the DBR wall calorimeter and window
calorimeter for a 100-mm expanded polystyrene specimen 2.44 by
2.44 m. with latex coatings.
Thermal Conductance, W/(m2. K) Mean Temperature
of Specimen, 'C Wall Calorimeter Window Calorimeter
BOWEN AND SOLVASON ON HEAT TRANSMISSION OF WINDOWS
577
-3.2 mm GLASS/
,11 mm POLYSTYRENE 3.2 mm GLASS .@ TOTAL NUMBER ' 20 TYPE T THERMOCOUPLE 30-GAUGE. SOLDERED TO COPPER SHIM POLYSTYRENE FIG. 7-Calibration specimen.relationship established from the tests referred to earlier. With the calibration specimen in the mask, a new term must be added to Eq 3
where Q, is the additional heat loss around the edge of the calibration specimen, which is not included in
a.
This loss will be a function of the perimeter length of the calibration specimen, position in the mask, the method for holding the calibration specimen in the mask, and local film coefficients. Two techniques will be considered for determining the value ofQ,:
measure- ment using the calibration specimen as a heat flow meter and measurement by finite element analysis. The former is a preferred option because an analytical approach requires a number of assumptions regarding local film coefficients at the calibration specimen edge.Once
Q,
is determined for each test condition and set up. Q, is calculated (Eq 5) using Ti,, T I . and the measured surface emissivities of the baffle and window and q, established from Eqs 4 and 7. By using calibration specimens with both a high and low surface emissivity on the room side surface, B and C can be established over a broad range of q, and (Th- T I ) .The calorimeter is currently being calibrated. Initial testing has shown that with the 1.6 by 1.0-m specimen in the 2.4 by 2.4-m wall and 22OC room side/-3S°C weather side tempera- tures, the difference between the maximum and minimum thermocouple reading on the baffle is only 0.2 degree kelvin. The calorimeter air stream temperatures at similar elevation are con- stant to within 0.1 degree kelvin.
Flltare PI.nr
The work to date has demonstrated that the constant and uniform temperature baffle and convection heater does provide more uniform and definable characteristics for the calorimeter
578 THERMAL INSULATION: MATERIALS AND SYSTEMS
than the existing wall calorimeter. Once the calorimeter calibration is completed. a program of evaluating different sealed window units and windows will be undertaken. The objective of the program is to develop a standard procedure for determining a nominal thermal conductance for windows using the window calorimeter. Factors to be addressed will include the effect of speci- men size on results, reporting of results based on rough opening area or glazed area, and the effect of glass deflection on the U values arrived at for sealed units.
Acknowledgment
This paper is a contribution from the Division of Building Research, National Research Council of Canada, and is published with the approval of the director of the division.
APPENDIX
Window Tests Using
DBR
Wall Calorimeter:Apparatus and Test Setup
The DBR environmental chamber and calorimeter for wall heat flow measurements are shown in Figs. 8 and 9. The calorimeter box is constructed of isocyanurate foam covered inside and outside with fiberglass and polyester resin. A row of electric heaters is located between a baffle and the back wall just above the bottom of the baffle, so that the baffle shields the test specimen from direct radiation from the heaters. The heated air flows by natural convection up between the baffle and the back wall, through the gap at the top, down between the baffle and the test assembly, and back through the gap at the bottom. A thermopile with 64 uniformly spaced junctions is used to measure the mean temperature difference across the walls of the calorimeter. The output from the thermopile is used with a differential controller to control the temperature of the room side guard box surrounding the calorimeter box to maintain a near- zero mean temperature difference across the calorimeter box walls.
A steel test frame was used to construct a wall in which to mount the test windows. A cross
section of the wall and test window is shown in Fig. 10. All the joints in the plywood were sealed with caulking to prevent air leakage through the test assembly.
The conductivity of the support wall and a 25-mm painted plywood calibration specimen was established in a guarded hot plate apparatus. The calorimeter constants were determined using the calibration specimen prior to testing the windows. For the tests with the plywood calibration specimen, the same conditions were maintained as for the tests with the windows; that is, the weather side was adjusted and maintained at three nominal temperatures, -7, -21, and -
3S°C, and the calorimeter box was maintained close to 21°C with the heat input held constant after equilibrium had been reached. The heat input to the room side chamber was controlled so that the average temperature difference across the calorimeter walls was practically zero. This zero difference ensured that the heat exchange between the calorimeter and the room side chamber was negligibly small.
The heat transfer from the calorimeter heaters to the test wall was by natural convective air flow and radiation transfer from the calorimeter surfaces. The multinozzle wind machine lo- cated in the weather side chamber was used to provide a uniform air film over the weather side surface.
Upon completion of the calibration tests, the plywood blank was removed and the test win-
dow installed. A compressible sponge weatherstrip was placed between the stop and glass. Caulking was then applied to seal the stops to the frame and the glass to prevent air leakage.
Thermocouples were installed using aluminum tape on the room side and weather side glass surfaces. The calorimeter was instailed and operated as in the calibration run with the measure- ments taken after equilibrium was reached at each weather side temperature.
The U values established from the tests for double and triple-sealed units with nominal 6-mm air spaces and test temperatures of approximately 21°C room side and -3S°C weather side
o I N S I D E A I R TEMPERATURE THERMOCOUPLES BAFFLE TEMPERATURE THERMOCOUPLES 0 OUTSIDE A I R TEMPERATURE THERMOCOUPLES
I Xml
POLYSTYRENE SURROUND/
'j"
STEEL TEST FRAME FIG. 8-DBRINRCC environmental test facility, wrtiml section.
iERMAL INSULATION: MATERIALS AND SYSTEMS
0 INSIDE AIR TEMPERATURE THERMOCOUPLES
BAFFLE TEMPERATURE THERMOCOUPLES
FIG. 9-DBRINRCC wall calorimeter box. front view and side section.
PLYWOOD EXTRUDED
POLYSTYRENE
ROOM SIDE W E A T H E R SIDE
HORIZONTAL
CENTRELINE
-
-
-
-
-
--
I
DIMENSIONS I N m n
TABLE 3-High and low baffle temperaturesfor the plywood calibrariot~ specimen and the double- and triple-glazed sealed glazing units.
Baffle Temperatures. "C Weather High
Room Side Side Thermo- Low AT, K. Specimen Temperature. 'C Temperature, ' C couple No. 2 TC No. 3 No. 2
-
No. 3Plywood 21.6 21.7 21.6 Double-glazed unit 21.6 21.6 21.7 Triple-glazed unit 22.3 21.6 21.5
were 3.45 and 2.41 W/(m2 K), respectively. It should be noted that the absolute numbers were not as important as the technique and problems associated with testing of windows.
The first area of uncertainty was in establishing the baffle temperature, Tb. For wall testing, the baffle temperature remains uniform even when walls with high conductance studs are used. With windows, however, there is a large area of high conductance, which causes temperature gradients on the baffle in front of the window. Figure 9 shows the thermocouple locations on the baffle and the view of the window on the baffle. Table 3 summarizes the high and low baffle temperatures for the test conditions specified. The worst case resulted in a temperature differ- ence of 6.9 degrees kelvin between thermocouple Locations 2 and 3.
Although glass temperatures were measured, they were not used in the calculations. These thermocouples were used only to provide an indication of the temperature gradients on the glass. The effect of thermocouple attachment was investigated by comparing two thermocou- ples having the same reading and similar location. The attachment was varied by using different lengths of aluminum and black cloth tape and cloth tape on top of the aluminum tape. The temperature measured by the thermocouples for the different attachments varied by 1.3 degrees kelvin.
[I] ASHRAE Handbook of Fundamentals. American Society of Heating, Refrigerating, and Air-Condi- tioning Engineers, New York, 1981, Table 8, Chapter 23.
[2] Brown, W. C., Solvason, K. R., and Wilson, A. G . , A.S.H.R.A.E Transactions. Vol. 66, 1961, pp. 561-577.
T h i s p a p e r i s b e i n g d i s t r i b u t e d