HAL Id: hal-00687934
https://hal.archives-ouvertes.fr/hal-00687934
Submitted on 30 Oct 2020
HAL is a multi-disciplinary open access
archive for the deposit and dissemination of
sci-entific research documents, whether they are
pub-lished or not. The documents may come from
teaching and research institutions in France or
abroad, or from public or private research centers.
L’archive ouverte pluridisciplinaire HAL, est
destinée au dépôt et à la diffusion de documents
scientifiques de niveau recherche, publiés ou non,
émanant des établissements d’enseignement et de
recherche français ou étrangers, des laboratoires
publics ou privés.
dissolved primary production and metabolic state in
surface waters of three Mediterranean eddies
A. Lagaria, S. Psarra, Dominique Lefèvre, France van Wambeke, C. Courties,
Mireille Pujo-Pay, L. Oriol, T. Tanaka, Urania Christaki
To cite this version:
A. Lagaria, S. Psarra, Dominique Lefèvre, France van Wambeke, C. Courties, et al.. The effects of
nutrient additions on particulate and dissolved primary production and metabolic state in surface
waters of three Mediterranean eddies. Biogeosciences, European Geosciences Union, 2011, 8,
pp.2595-2607. �10.5194/bg-8-2595-2011�. �hal-00687934�
www.biogeosciences.net/8/2595/2011/ doi:10.5194/bg-8-2595-2011
© Author(s) 2011. CC Attribution 3.0 License.
Biogeosciences
The effects of nutrient additions on particulate and dissolved
primary production and metabolic state in surface waters
of three Mediterranean eddies
A. Lagaria1,2, S. Psarra2, D. Lef`evre3, F. Van Wambeke3, C. Courties4,5, M. Pujo-Pay6,7, L. Oriol6,7, T. Tanaka8,*,**, and U. Christaki1
1Laboratoire d’Oc´eanologie et des G´eosciences, UMR8187, INSU-CNRS – Universit´e Lille Nord de France, ULCO, 62930 Wimereux, France
2Hellenic Centre for Marine Research, Institute of Oceanography, 71003 Heraklion, Crete, Greece
3LMGEM, Laboratoire de Microbiologie, G´eochimie et Ecologie Marines, UMR6117, INSU-CNRS – Universit´e de la M´editerran´ee, Centre d’Oc´eanologie de Marseille, Campus de Luminy Case 901, 13288 Marseille cedex 9, France 4Observatoire Oc´eanologique de Banyuls, UMS2348, INSU-CNRS, 66650 Banyuls/mer, France
5Universit´e Pierre et Marie Curie-Paris VI, UMS2348, Observatoire Oc´eanologique de Banyuls, 66650 Banyuls/mer, France
6Laboratoire d’Oc´eanographie Microbienne, UMR7621, INSU-CNRS – Observatoire Oc´eanologique, 66650 Banyuls/mer, France
7Universit´e Pierre et Marie Curie-Paris VI, UMR7621, Laboratoire d’Oc´eanographie Microbienne, Observatoire Oc´eanologique, 66650 Banyuls/mer, France
8LOPB, Laboratoire d’Oc´eanographie Physique et Biog´eochimique, UMR6535, INSU-CNRS – Universit´e de la M´editerran´ee, Centre d’Oc´eanologie de Marseille, Campus de Luminy Case 901, 13288 Marseille cedex 9, France *present address: Laboratoire d’Oc´eanographie de Villefranche, UMR7093, INSU-CNRS,
06230 Villefranche-sur-Mer, France
**present address: Universit´e Pierre et Marie Curie-Paris VI, Laboratoire d’Oc´eanographie de Villefranche, UMR7093, 06230 Villefranche-sur-Mer, France
Received: 12 November 2010 – Published in Biogeosciences Discuss.: 9 December 2010 Revised: 7 June 2011 – Accepted: 6 September 2011 – Published: 14 September 2011
Abstract. We examined the effects of nutrient additions on
rates of 14C-based particulate and dissolved primary pro-duction as well as O2-based metabolic rates in surface wa-ters (8 m) of three anticyclonic eddies, located in the West-ern, Central and Eastern Mediterranean. Ship-board micro-cosm experiments employing additions of inorganic nitrogen (+N) and phosphorus (+P), alone and in combination (+NP), were conducted in June/July 2008 during the BOUM (Bio-geochemistry from the Oligotrophic to the Ultra-oligotrophic Mediterranean) cruise. In all three experiments, particulate primary production was significantly stimulated by the ad-ditions of nitrogen (+N, +NP) while no effect was observed with the addition of phosphorus alone (+P). Percent extra-cellular release of photosynthate (PER) displayed the low-est values (4–8 %) in the +NP treatment. Among the three
Correspondence to: S. Psarra
(spsarra@hcmr.gr)
treatments (+N, +P, +NP), the +NP had the strongest ef-fect on oxygen metabolic rates, leading to positive values of net community production (NCP > 0). These changes of NCP were mainly due to enhanced gross primary pro-duction (GPP) rather than reduced dark community respi-ration rates (DCR). In all three sites, in +NP treatment au-totrophic production (whether expressed as GPP or PPtotal) was sufficient to fulfil the estimated carbon requirements of heterotrophic prokaryotes, while addition of nitrogen alone (+N) had a weaker effect on GPP, resulting in metabolically balanced systems. At the three sites, in treatments with N (+N, +NP), phytoplankton and heterotrophic prokaryote pro-duction were positively correlated. Heterotrophic conditions were observed in the Control and +P treatment at the central and eastern sites, and autotrophic production was not suffi-cient to supply estimated bacterial carbon demand, evidence of a decoupling of phytoplankton production and consump-tion by heterotrophic prokaryotes.
1 Introduction
In the ocean, the bulk of organic matter produced by pho-tosynthesis is remineralised through respiration (del Gior-gio and Duarte, 2002). The amount respired relative to the amount produced describes the net metabolism of the ecosys-tem. Net community production (NCP) is then the balance between gross primary production (GPP) and dark commu-nity respiration (DCR). When NCP > 0, more organic carbon is produced than respired, so the ecosystem is in a state of net autotrophy. When NCP < 0, the ecosystem is heterotrophic, in situ respiration exceeds in situ carbon fixation.
Heterotrophic prokaryotes (Eubacteria and Archaea) are responsible for a significant portion of total respiration in the water column (Robinson, 2008). In the least productive ar-eas, their contribution may even exceed 50 % of total respi-ration (Lem´ee et al., 2002; Gonzalez et al., 2003; Reinthaler et al., 2006). Respiration of heterotrophic prokaryotes, the sum of maintenance and growth costs, is supported by the uptake of dissolved organic carbon. A variety of mecha-nisms within planktonic food webs produce dissolved or-ganic matter, through phytoplankton exudation, viral lysis, excretion/egestion and grazing processes by zooplankton and microzooplankton (Jumars et al., 1989; Nagata, 2008).
The dissolved component of primary production (PPd) can represent a significant amount of total primary produc-tion (Mara˜n´on et al., 2004; Mor´an and Estrada, 2001, 2002) though it is often neglected in primary production measure-ments which typically estimate only particulate primary pro-duction. The portion of total primary production which is excreted as PPd is termed the Percentage of Extracellular Release (PER) and varies greatly depending on environmen-tal conditions, including nutrient limitation (see review by Baines and Pace, 1991). PER reportedly increases when the phytoplankton are dominated by small-sized cells, most probably because their elevated surface/volume ratio pro-motes passive diffusion of small metabolites through the cell membrane (Bjørnsen, 1988).
Dissolved primary production (PPd) furnishes a labile, easily assimilated carbon source for heterotrophic prokary-otes (Carlson, 2002; Nagata, 2008) and its relative contribu-tion increases under condicontribu-tions of mineral nutrient limitacontribu-tion (Baines and Pace, 1991). Thus, under conditions of nutrient limitation, phytoplankton produce, through PPd, substrate for heterotrophic prokaryotes whose growth is then poten-tially limited by the same mineral nutrient restricting phy-toplankton growth. As the uptake of organic matter by het-erotrophic prokaryotes forms a major carbon-flow pathway, factors controlling this uptake and its variability can domi-nate overall carbon fluxes and determine the metabolic status of a system (Thingstad and Rassoulzadegan, 1995).
The coupling between phytoplankton and heterotrophic prokaryotes can be explored through the carbon budget re-lating the total (particulate and dissolved) organic matter pro-duced by photosynthesis and the amount of carbon consumed
by heterotrophic prokaryotes, the bacterial carbon demand (BCD). Comparing total primary production with BCD does not necessarily imply that all primary production is chan-neled through the microbial food web, but rather indicates the internal potential of a system to provide carbon sources to heterotrophic prokaryotes, in time and space. If the ratio of BCD to total primary production is >1 then the autotrophic production of the system is insufficient to support the carbon requirements of the heterotrophic prokaryotes, an evidence of spatio-temporal uncoupling between primary production and heterotrophic consumption of autochthonous dissolved organic carbon (Williams et al., 2004; Maixandeau et al., 2005).
Primary production in the Mediterranean Sea, especially in surface waters, is often limited by the availability of macronutrients, namely nitrogen (N) and/or phosphorus (P) (Krom et al., 1991; Thingstad and Rassoulgadegan, 1995; Thingstad et al., 2005). The Mediterranean is probably one of the most oligotrophic seas known and characterized by a west-east increasing oligotrophy gradient in terms of min-eral nutrients, biomass and production (Krom et al., 1991; Moutin and Raimbault, 2002; Ignatiades et al., 2009; Pujo-Pay et al., 2011). Circulation in the Mediterranean Sea is essentially constrained alongslope, being markedly unsta-ble and generating cyclonic and anticyclonic eddies (Mil-lot, 1999; Hamad et al., 2005). These permanent or semi-permanent sub-basin eddies are stable mesoscale features with a lifetime measured in years that transfer, along their drifting motion, waters far from the place of their original formation (Puillat et al., 2002).
In the Mediterranean Sea, heterotrophic prokaryotes were found to be P-limited in the east (Zohary and Robarts, 1998; Van Wambeke et al., 2002) or during the stratification period in the west (Thingstad et al., 1998; Alonso-Saez et al., 2008). The CYCLOPS experiment, performed in the core of the an-ticyclonic Cyprus eddy in the eastern Mediterranean during the stratified period, provided indications of P-limitation for heterotrophic prokaryotes but N and P co-limitation for au-totrophic phytoplankton (Thingstad et al., 2005; Zohary et al., 2005). These findings highlighted the complex interre-lations of the limiting character of the major macronutrients, both in space and time.
Here we report data on the effects of nutrient enrichment on the communities of three distinct anticyclonic eddies in different Mediterranean basins. The general objective of these experiments was to identify the most limiting nutri-ent and to determine how the structure of the pelagic micro-bial food web responds to enrichment of the limiting nutrient (Tanaka et al., 2011). In the present work, our aim was to de-termine if the metabolic responses to nutrient additions were similar in the surface waters of the three anticyclonic eddies and to define the potential key factor that would dictate these responses in each case. For this, we measured particulate (PPp) and dissolved primary production (PPd), gross primary production (GPP) and dark community respiration (DCR),
upon enrichment with N and P added separately and jointly. Through these measurements we further discuss the potential implications relative to metabolic balance and carbon bud-gets between autotrophic and heterotrophic osmotrophs.
2 Methods
2.1 Experimental set up and sampling
The three microcosm experiments were performed at the core of 3 anticyclonic eddies, in the Western (site A: 39◦5.960N– 5◦21.000E), the Ionian (site B: 34◦8.200N–18◦26.700E), and the Levantine (site C: 33◦37.500N–32◦39.200E) basins
dur-ing the BOUM (Biogeochemistry from the Oligotrophic to the Ultra-oligotrophic Mediterranean) cruise in June–July 2008, on board the French R/V Atalante. At each site, sea-water was collected from 8 m depth within the surface mixed layer and 4 series of triplicate 20 l polycarbonate Nalgene bottles (microcosms) were filled. The sampling depth was located at the lower part of the surface mixed layer (13.5 m at site A, 8.5 m at site B, 11.5 m at site C: Moutin et al., 2011). In three of the series, enrichments with addition of NH4(+N), PO4 (+P) and both NH4 and PO4 (+NP) were performed, while the fourth series was used as Control and no addition was made. 1.6 µM of NH4were added at site A and B, and 3.2 µM were added at site C, whereas, 0.1 µM of PO4 was added at each site, in the respective treatment. Nutrient addi-tions were chosen with the aim to satisfy N or P requirements of heterotrophic prokaryotes and phytoplankton for the dura-tion of the experiment (i.e. 3–4 days), and was based on an approximation of N:P ratio of 16 and 32 of the Western and the Eastern Basins, respectively (Tanaka et al., 2011). The microcosms were incubated in an on-deck flow-through wa-ter bath covered with a filwa-ter that reduced the incident light by approximately 50 % to approximate incident light condi-tions at the sampling depth. Sampling for determination of a suite of chemical and biological parameters took place on day 0 (prior to the additions), day 2, and at the end of the experiment. At site A, the experiment lasted 3 days and at site B and C the experiment lasted 4 days.
2.2 Analytical procedures 2.2.1 Inorganic mineral nutrients
Concentrations of nitrate + nitrite (NO3+ NO2)and soluble reactive phosphorus, referred to as phosphate (PO4)in this paper, were immediately measured on board with an auto-analyser (Bran+Luebbe autoauto-analyser II) according to the col-orimetric method (Tr´eguer and Le Corre, 1975). Concen-tration of NH4was also immediately measured on board by fluorometry according to Holmes et al. (1999). Precision of measurements was 2 nM, 20 nM, 5 nM and 5 nM for NH4, NO3, NO2and PO4, respectively and detections limits for the procedures were 3 nM, 20 nM, 10 nM and 10 nM for NH4,
NO3, NO2and PO4, respectively. Full details are given in Pujo-Pay et al. (2011).
2.2.2 Chlorophyll-a
Chlorophyll-a (chl-a) was measured fluorometrically, ac-cording to Yentsch and Menzel (1963). For each sample, approximately 0.5 l of seawater was filtered through 0.2 µm polycarbonate filters. Filters were kept frozen in the dark un-til extraction in 90 % acetone solution overnight. Measure-ments were performed on board with a Shimadzu RF5301 spectrofluorometer.
2.2.3 Particulate and dissolved primary production rates
Photosynthetic carbon fixation rates (particulate and dis-solved) were estimated by the 14C incorporation method (Steemann-Nielsen, 1952) according to Mara˜n´on et al. (2004) for the dissolved primary production (PPd) measurements. For each triplicate microcosm of the 4 series (the Control, +N, +P and +NP) three light and one dark 170-ml polycarbonate bottles were filled with sample water in the morning, around 09:00–10:00 a.m. (LT), inoculated with 20 µCi of NaH14CO3 tracer each and incubated for 4 h in the on-deck flow-through water bath. The incubation period was a compromise between the time needed in order to obtain a significant signal in the PPd phase, and at the same time, minimize the 14C-labeled dissolved organic carbon (DOC) assimilation by heterotrophic prokaryotes (Mor´an and Estrada, 2002). It should also be mentioned that the 14C-incorporation method cannot differentiate the origin of labeled DOC. Therefore, the physiological DOC production by phytoplankton and the release of labeled DOC of trophic-related processes -such as sloppy feeding by grazers -are both included in PPd measurements. However, short-time incubations minimise the contribution of trophic-related processes to DOC production. Because of the time constraints of sample treatment, PPd was measured only in one of the triplicate microcosms of each series.
At the end of the incubation, two 5-ml aliquots from each light/dark polycarbonate bottle were filtered through 0.2 µm polycarbonate filters (25 mm diameter) using very low vac-uum pressure (< 50 mmHg) in order to ensure a better man-agement of the filtration manifold (processing several 5 ml samples) and cut the pressure in time before the filter dries out. Both the filtrate and the filters were collected for mea-surements of the dissolved (PPd) measurement and particu-late primary production (hereinafter assigned as PPp(5 ml)). In order to remove excess14C-bicarbonate, filters were ex-posed to concentrated HCl fumes for 12 h, while filtrates col-lected in 20-ml scintillation vials were acidified with 100 µl of 50 % HCl and left open overnight in an orbital shaker. Then 10 ml of scintillation cocktail were added to the fil-trates on board and vials were stored for counting in the
laboratory. The rest of the 160-ml sample of the light/dark polycarbonate bottles was also filtered through 0.2 µm poly-carbonate filters (25 mm diameter) under low vacuum pres-sure (<200 mmHg) and filters were put in scintillation vials where 1 ml of 1 % HCl solution was immediately added in order to remove excess14C-bicarbonate overnight. These fil-ters were used for measurement of the particulate primary production (PPp) as well. After addition of 4 ml scintillation cocktail all vials containing filters were stored for counting in the laboratory in a scintillation counter.
PPp and PPd rates resulting from light and dark incubated samples were calculated from the radioactivity (cpm) mea-sured on filters and in the filtrates, respectively, as shown in the following equation:
PPp,PPd (mg C m−3h−1)=(incubated volume/filtered volume) ·[(cpmlight−cpmdark) ·DIC · 1.05]/(cpmtotal·h) (1)
cpmlight, cpmdark=counts per minute measured in the light and dark bottles, respectively, cpmtotal=counts per minute of the total amount of tracer inoculum, DIC = dissolved inorganic carbon = 24 000 mg C m−3, according to Copin-Montegut (1993), 1.05 = correction factor for the lower up-take of14C as compared to12C, h = duration of the incuba-tion in hours.
In the microcosms where only PPp was measured, the whole 170-ml sample of the light/dark polycarbonate bottles was filtered and treated as described above for the case of the remaining 160-ml sample. In this case, note that the first term in Eq. (1) that refers to the volumes would be 1.
The percentage extracellular release (PER, %) was calcu-lated as the ratio of dissolved to total primary production (particulate and dissolved) measured simultaneously in the 5-ml aliquots.
PER = PPd · 100/(PPp(5 ml)+PPd) (2)
A very good agreement existed between the two types of es-timates of particulate primary production, PPp(5 ml)and PPp: log-PPp(5 ml)=0.93 (±0.02 se) · log-PPp + 0.20 (±0.01 se),
r2=0.98, p < 0.001. For the analysis of our results we assumed as the actual PPp rate the one calculated from the whole (or the 160-ml) sample while from the PER obtained from Eq. (2) we calculated the corresponding PPd.
2.2.4 Gross primary production, dark community respiration and net community production
Rates of gross primary production (GPP), dark community respiration (DCR) and net community production (NCP) were calculated from changes in the dissolved oxygen con-centration during light/dark 24-h incubations, in two of the triplicate microcosms of each series. From each sampled mi-crocosm, twelve replicate BOD (biological oxygen demand) bottles of 125 or 60 ml were filled. From these BOD bottles,
four were fixed immediately to measure the oxygen concen-tration at time 0 (T0), and the rest were incubated in the on-deck incubators mentioned above for 24-h under in situ light conditions (4 BOD bottles) or in the dark (4 BOD bottles). The concentration of the dissolved oxygen in the BOD bot-tles was measured on board by automatic automated high-precision. NCP was calculated as the difference in the dis-solved oxygen concentration between the “light” incubated samples and the “time 0” samples. DCR was calculated as the difference between “dark” incubated samples and the “time 0” samples. DCR rates are expressed as a negative O2 flux. GPP was calculated as the difference between NCP and the DCR, assuming that respiration in the light bottles equals respiration in the dark (Lef`evre et al., 2008). Standard devi-ations on the rates were calculated from the standard devia-tion of quadruple samples sets. GPP was converted to carbon units applying a photosynthetic quotient of 1.1 (Laws, 1991).
2.2.5 Heterotrophic prokaryotes
Samples (3.5 ml) were preserved with 2 % (final concentra-tion) formaldehyde, frozen in liquid nitrogen, and stored at
−80◦C until flow cytometric analysis (Troussellier et al., 1995). After thawing at room temperature, measurements for autotrophic and heterotrophic communities were run with a flow cytometer (FACSCan, BD-Biosciences) equipped with a 488 nm-15 mW Argon laser. Data acquisition was per-formed using CellQuest software (BD-Biosciences). SYBR Green I (Molecular Probes) was used to stain heterotrophic bacterial populations, which were discriminated and enumer-ated by their nucleic acid contents according to their right an-gle light scatter and green fluorescence (Marie et al., 2000).
2.2.6 Bacterial production
Bacterial production (BP; sensus stricto referring to het-erotrophic prokaryotic production) was measured using the 3H leucine incorporation technique (Kirchman, 1993). Briefly, 1.5 ml duplicate samples and a control were incu-bated with a mixture of L-[4,5-3H] leucine (Perkin Elmer, specific activity 115 Ci mmol−1)and non-radioactive leucine at final concentrations of 16 and 7 nM, respectively. Samples were incubated in the dark at in situ temperature, fixed and treated following the microcentrifugation protocol (Smith and Azam, 1992) as described in detail in Van Wambeke et al. (2011) and using a conversion factor of 1.5 kg C per mole leucine incorporated.
2.2.7 Bacterial carbon demand
Bacterial carbon demand (BCD) is defined as the amount of bacterial production (BP) plus respiration (BR, sensus stricto referring to heterotrophic prokaryotic respiration):
Table 1. Initial (prior to the additions) concentrations (mean ± sd of the triplicate microcosms) of mineral nutrients in the enrichments experiments at stations A, B and C. <DL: below detection limits.
Parameter Site A Site B Site C NO2+ NO3(nM) <DL 37 (±21) 40 (±20) NH4(nM) 34 (±11) 49 (±22) 15 (±5) PO4(nM) <DL <DL 30 (±2)
We did not directly measure BR in this study but estimated the range of bacterial carbon demand. We assumed bac-terial respiration to be bracketed between total dark com-munity respiration (BCD100=BP + DCR) and 50 % of it (BCD50=BP + DCR/2). These values reflect rates reported for the NW Mediterranean in which BR is found to account for ∼75 % of DCR (Lem´ee et al., 2002; Gonzalez et al., 2003) and overall an average from open ocean systems of about 50 % (Robinson, 2008). The respiratory quotient was considered constant for all cases and equal to 0.8 (Lef`evre et al., 2008). In order to compare BCD with the PPtotal (i.e. PPp + PPd), the DCR was converted to hourly rates by dividing by 24 while for comparison of BCD with the GPP, the BP was converted to daily rates by multiplying by 24.
2.3 Statistical analysis
For statistical analysis, all data were log10 transformed to meet requirements of homogeneity of variance. For com-parisons between the three sites, initially, and between the Control and the amended microcosms (+N, +P, +NP) at the end of the experiment, a one-way ANOVA and Tukey’s HSD analysis (95 % confidence level) were performed. For corre-lation and regression analyses (Model II) between variables the whole data set (day 0, 2 and final) was used.
3 Results
3.1 Initial conditions
The surface waters (8 m depth) of the three anticyclonic eddies displayed concentrations of NO3+ NO2<40 nM, NH4<50 nM and PO4below the detection limit (<10 nM) except from site C where 30 nM of PO4were measured (Ta-ble 1). Overall, chlorophyll-a concentration ranged 0.03– 0.06 mg m−3 and presented significant differences among the three sites (ANOVA, p < 0.05) with site C display-ing the lowest and site A the highest values (Table 2). PPp ranged 0.09–0.29 mg C m−3h−1 and was significantly lower at site C (Tukey HSD test, p < 0.05). PPd and PER did not show any significant differences among the three sites (ANOVA, p > 0.05). PPd ranged 0.02– 0.05 mg C m−3h−1and PER was 9.2 ± 4.2 %, 17.7 ± 12.4 %
and 15.2 ± 12.5 % (avg ± sd) at sites A, B and C, respec-tively (Table 2). Bacterial abundance and production ranged 1.79–3.42 ×10⁵cells ml−1 and 11.9–25.8 µg C m−3h−1, re-spectively, with site C presenting significantly lower values than sites A and B (Tukey HSD test, p < 0.05, Table 2). GPP ranged 0.12–0.92 mmol O2m−3d−1 and was significantly lower only at site C (Tukey HSD test, p < 0.05), while the DCR ranged from −0.38 to −0.65 mmol O2m−3d−1and no significant difference was detected among the sites (ANOVA,
p >0.05, Table 2). The NCP, representing the balance be-tween the GPP and the DCR, was not significantly different from 0 at all three sites (GPP not significantly different from DCR, t-test, p > 0.05).
Overall, nutrient and chlorophyll-a concentrations as well as PPp were low and PPd ranged from about 10 to 20 % of total primary production, at all three sites. Rates of bacterial production were approximately 10 % of total primary pro-duction and gross primary propro-duction balanced dark com-munity respiration.
3.2 Amended microcosms vs. control at the end of the experiment
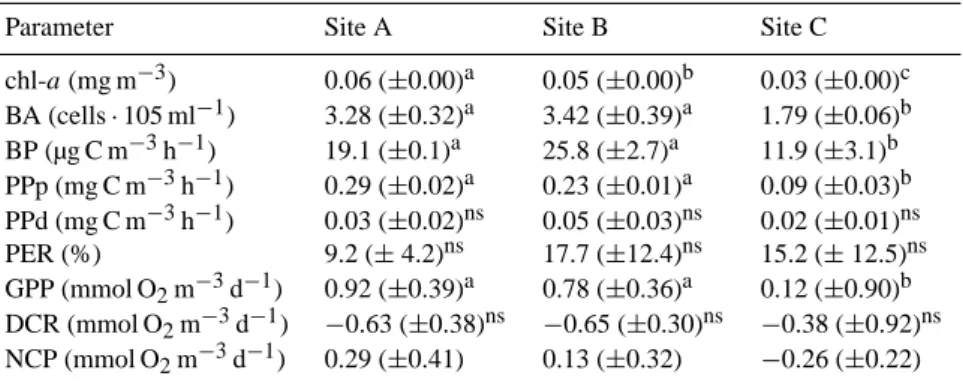
In all three experiments, the nutrient additions which in-cluded nitrogen resulted in significant treatment effects with regard to the autotrophic community. At the end of the ex-periments, at sites A and B, chlorophyll-a increased signif-icantly in the +N and +NP microcosms (2 to 5-fold and 5 to 25-fold, respectively) relative to the Control, whereas, at site C a significant 12-fold increase was observed only in the +NP (Tukey HSD test, p < 0.05, Fig. 1a). At all sites, no dif-ference in PPp was observed in +P compared to the Control whereas significantly 3-fold higher values were observed in the +N and 16 to 46-fold increases were observed in the +NP (Tukey HSD test, p < 0.05, Fig. 1b).
Interestingly, PPd response to nutrient additions was not proportional to PPp response. PPd increased significantly only in the +NP at sites A and B (Tukey HSD test, p < 0.05, Fig. 1b). At all sites, PER ranged 9–20 %, 10–31 % and 4–8 % in the +N, +P and +NP additions, respectively. The only significant difference with the Control was observed in the +P at site B where PER reached its highest value (31 %, Fig. 1c).
BP showed a significant 2.3-fold increase in +N at site B (Tukey HSD test, p < 0.05) and 4-fold increase in +NP at sites B and C (Tukey HSD test, p < 0.05, Fig. 1d). In con-trast to primary production and chlorophyll-a, no significant differences of BP were detected between the different micro-cosms at site A (ANOVA p > 0.05).
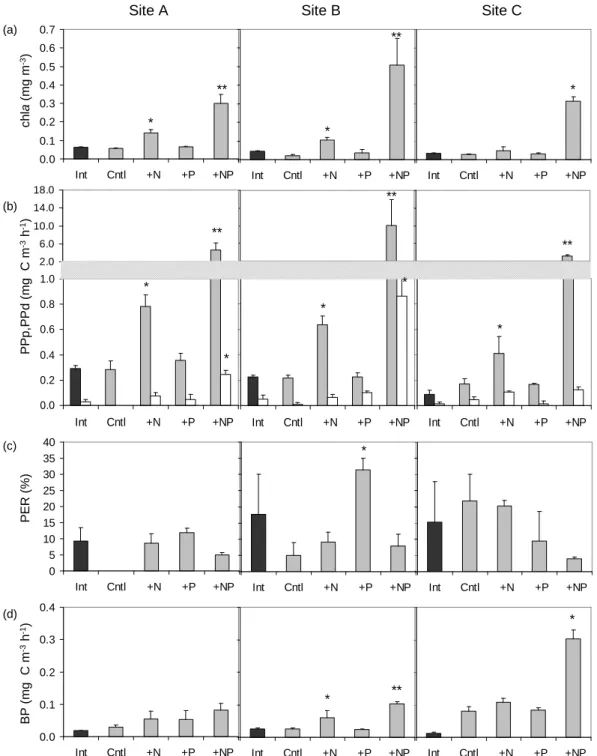
GPP at all three sites increased significantly (from 5 to 15-fold) only in the +NP treatment (Fig. 2). Sim-ilarly, DCR increased by ∼2.7-fold in the +NP at all sites, however this increase was statistically significant only at site B (Fig. 2). NCP at the end of the ex-periment was positive in all treatments at site A and
Table 2. Initial values (mean ± sd) of chl-a = Chlorophyll-a, BA = bacterial abundance, BP = bacterial production, PPp = particulate primary production, PPd = dissolved primary production, PER = percentage extracellular release, GPP = gross primary production, DCR = dark community respiration and NCP = net community production at stations A, B and C. For chl-a, BA, PPp and BP the standard deviation (sd) was estimated from the triplicate microcosms. For PPd and PER the sd was obtained from the triplicate measurement in a sin-gle microcosm while for GPP, NCP, DCR the sd was obtained from the quadruple measurements in each of the 2 microcosm (cf. Sect. 2.2.4). For each parameter, values labeled by different letters (a, b or c) in the three sites are significantly different at p < 0.05 while “ns” denotes that no significance difference was detected among the sites.
Parameter Site A Site B Site C
chl-a (mg m−3) 0.06 (±0.00)a 0.05 (±0.00)b 0.03 (±0.00)c BA (cells · 105 ml−1) 3.28 (±0.32)a 3.42 (±0.39)a 1.79 (±0.06)b BP (µg C m−3h−1) 19.1 (±0.1)a 25.8 (±2.7)a 11.9 (±3.1)b PPp (mg C m−3h−1) 0.29 (±0.02)a 0.23 (±0.01)a 0.09 (±0.03)b PPd (mg C m−3h−1) 0.03 (±0.02)ns 0.05 (±0.03)ns 0.02 (±0.01)ns PER (%) 9.2 (± 4.2)ns 17.7 (±12.4)ns 15.2 (± 12.5)ns GPP (mmol O2m−3d−1) 0.92 (±0.39)a 0.78 (±0.36)a 0.12 (±0.90)b DCR (mmol O2m−3d−1) −0.63 (±0.38)ns −0.65 (±0.30)ns −0.38 (±0.92)ns NCP (mmol O2m−3d−1) 0.29 (±0.41) 0.13 (±0.32) −0.26 (±0.22)
displayed the highest value in +NP (Fig. 2). At sites B and C, NCP was 0 in the +N (0.21 ± 0.64 and
−0.06 ± 0.29 mmol O2m−3d−1, respectively), negative in the +P (−0.80 ± 0.34 and −0.75 ± 0.20 mmol O2m−3d−1, respectively) and positive in the +NP treatment (3.52 ± 0.29 and 7.37 ± 1.03 mmol O2m−3d−1, at sites B and C, respec-tively) (Fig. 2).
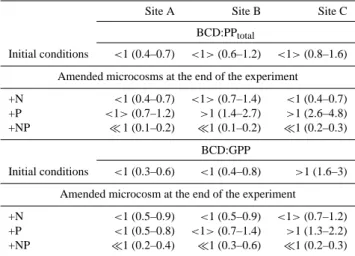
Considering all values together, PPd rates were strongly correlated with chlorophyll-a (Pearson r = 0.69, p < 0.001,
n =33). A significant linear relationship was also found be-tween log(PPp) and log(PPd) with a regression line slope (0.61 ± 0.11) statistically different of the 1:1 line (t-test,
p <0.05, Fig. 3).
Finally, considering all three experiments, strong positive correlations between the BP and PPtotal were found for the +N and +NP treatments only (Table 3).
3.3 Metabolic balance-carbon budget
Assuming bacterial respiration to range from 50 to 100 % of DCR, the initial range of the BCD:PPtotal ratio estima-tions, was <1 at site A and ranged from 0.6 to 1.6 at sites B and C (Table 4). At the end of the experiment BCD:PPtotal was always 1 in +NP, it varied from 0.4 to 1.4 in +N and it showed an increasing trend in +P from sites A to C ranging from 0.7–4.8 (Table 4). The estimated BCD:GPP ratio was
<1 at site A for the initial and nutrient amended conditions. The same was observed at site B, with exception of the +P where the ratio was around 1 (Table 4). At site C, BCD:GPP ratio exceeded 1 at the initial conditions (1.6–3) but remained
>1 only in +P at the end of the incubation (1.3–2.2).
4 Discussion
This is the first study of the effects of inorganic N and P addi-tions on particulate and dissolved primary production along with gross primary production and dark community respira-tion measurements in open oligotrophic Mediterranean wa-ters. Below we discuss the potential implications of nutrient additions relative to metabolic balance and carbon budgets between autotrophic and heterotrophic osmotrophs.
4.1 Effect of nutrient additions on dissolved and particulate primary production
Based on the responses to nutrient additions, the initial au-totrophic communities were primarily N-limited at all three sites (see also Tanaka et al., 2011), as shown by the signifi-cant, several-fold increases in both PPp and chlorophyll-a in +N and +NP treatments (Fig. 1a, b).
Nutrient additions had a weaker effect on PPd, compared to PPp; significant PPd increase was only observed in +NP treatment, at sites A and B. PPd did not increase proportion-ally with PPp, resulting in an inverse relationship of PER and total primary production, as shown by the slope of the log-log linear regression between PPd and PPp which was sig-nificantly lower than 1 (Fig. 3). In our study measurements were performed with water samples from a single depth and variations of PPp and PPd were principally induced by vary-ing nutrient concentrations. The relation found between PPp and PPd complies with the observation that in excess of both N and P (+NP treatment), PER was minimal while additions of N or P alone resulted in higher PER values (Fig. 1c).
Theoretically, in the Mediterranean PER should be en-hanced under conditions of P-deficiency since depletion of phosphate constrains new cell production inducing the
Site A Site B Site C (a) c h la (m g m -3) 0.0 0.1 0.2 0.3 0.4 0.5 0.6 0.7
Int Cntl +N +P +NP Int Cntl +N +P +NP Int Cntl +N +P +NP (b) P P p ,P P d (m g C m -3 h -1) 0.0 0.2 0.4 0.6 0.8 1.0
Int Cntl +N +P +NP Int Cntl +N +P +NP Int Cntl +N +P +NP
2.0 6.0 10.0 14.0 18.0 (c) P E R ( % ) 0.0 0.1 0.2 0.3 0.4
Int Cntl +N +P +NP Int Cntl +N +P +NP Int Cntl +N +P +NP (d) B P ( m g C m -3 h -1) ** * * ** * * ** * * ** * * ** ** * * 0 5 10 15 20 25 30 35 40
Int Cntl +N +P +NP Int Cntl +N +P +NP Int Cntl +N +P +NP
*
Fig. 1. Values of the parameters studied in the microcosms, at the initial conditions (Int, black bars) and at the end of the experiment, in the Control (Cntl), nitrogen (+N), phosphorus (+P), and nitrogen and phosphorus (+NP) amendments: (a) chlorophyll-a (b) particulate (grey bars) and dissolved (white bars) primary production (c) percentage extracellular release (PER) (d) bacterial production. Missing values of PPd and PER in the Control in (b) and (c) denote that measurements were below detection limit. Chl-a, PPp and BP figures are modified from Tanaka et al. (2011). * denotes significant difference with the Control.
release of dissolved photosynthate compounds by phyto-plankton (Baines and Pace, 1991; Nagata, 2008). This was actually confirmed in a study with phytoplankton cultures, where PER was higher under phosphorus-limited conditions
of skewed N:P ratios compared to N-limited or N:P bal-anced conditions (Obernosterer and Herndl, 1995). Inter-estingly, in our study we did not observe any decrease in PER with the addition of phosphorus, suggesting a lack of
Fig. 2. Gross primary production (GPP), dark community respiration (DCR) and net community production (NCP) initial (Int) and at the end of the experiment in the Control (Cntl), the nitrogen (+N), phosphorus (+P) and nitrogen and phosphorus (+NP) additions. * denotes significant difference with the Control.
log(PPp)
lo
g
(P
P
d
)
-1.6 -1.2 -0.8 -0.4 0
0.4 0.8 1.2
-2
-1.6
-1.2
-0.8
-0.4
0
0.4
0.8
1.2
1:1 log(PPd)=0.61(±0.11)*log(PPp)-1.07(±0.07) r2=0.56, p<0.001Fig. 3. Linear regression (Model II) of log-transformed particu-late (PPp, mg C m−3h−1)and dissolved primary production (PPd, mg C m−3h−1)pooling all measurements made during this study.
P-limitation. The apparent lack of P-limitation in this exper-iment is extensively discussed in Tanaka et al. (2011). More-over, no significant PER variations were observed between the +N and +P treatments (Fig. 1c). It seems that, under ultra-oligotrophic conditions prevailing during the stratified period, limitation by a single nutrient and/or co-limitation are likely in a delicate balance, meaning that addition of one nu-trient will quickly push limitation towards the next limiting nutrient (Thingstad et al., 2005; Tanaka et al., 2011). Con-sequently, the unchanged PER in the +N and +P treatments could be a result of complex initial conditions with perhaps near co-limitation of N and P.
Table 3. Pearson correlation coefficients between bacterial produc-tion (BP) and total particulate primary producproduc-tion for the Control, +N, +P and +NP additions pooled from the three eddies.
Treatment BP-PPtotal Control 0.335, p = 0.51, n = 6 +N 0.702, p = 0.03, n = 9 +P 0.224, p = 0.56, n = 9 +NP 0.787, p = 0.01, n = 9
PER may also be affected significantly by phytoplankton community size-structure and species composition (Teira et al., 2001; Wetz and Wheeler, 2007). Unfortunately, taxo-nomic or size structure analysis was not involved in our ex-periment but in similar exex-periments with nutrient additions in nutrient-depleted surface oligotrophic near-shore and off-shore waters, increases in autotrophic biomass and produc-tion are often associated with community shifts to larger cells and diatoms (Kress et al., 2005; McAndrew et al., 2007). A shift in the composition of the phytoplankton community during our study could be partly responsible for changes in PER. In theory, PER may be expected to be higher when the community is dominated by small-sized organisms compared to larger cells (Bjørnsen, 1988; Teira et al., 2001). However, this is not always observed since there is at least one study where no relationship could be established between PER and phytoplankton taxonomic composition or size structure (L´opez-Sandoval et al., 2010).
A potential problem with regard to PER is that measure-ments are based on the assumption that heterotrophic up-take of dissolved organic carbon produced by phytoplank-ton is minimized in short time incubations. Heterotrophic
Table 4. Ratios of the bacterial carbon demand to total primary production (BCD:PPtotal), for the initial conditions, and at the end of the experiment, in the microcosms amended with nitrogen (+N), phosphorus (+P), and nitrogen plus phosphorus (+NP) additions. GPP was converted to carbon units applying a photosynthetic quo-tient (PQ) of 1.1 (Laws, 1991). BCD:GPP = Mean ratios of the bacterial carbon demand to gross primary production (GPP) for the same samplings. Within the parenthesis the lower value in each case is an estimation of the ratio assuming bacterial respiration to be half the dark community respiration (BCD50=BP + DCR/2) while the higher value is based on the assumption that bacterial respiration equals dark community respiration (BCD100=BP + DCR).
Site A Site B Site C
BCD:PPtotal
Initial conditions <1 (0.4–0.7) <1> (0.6–1.2) <1> (0.8–1.6) Amended microcosms at the end of the experiment +N <1 (0.4–0.7) <1> (0.7–1.4) <1 (0.4–0.7) +P <1> (0.7–1.2) >1 (1.4–2.7) >1 (2.6–4.8) +NP 1 (0.1–0.2) 1 (0.1–0.2) 1 (0.2–0.3)
BCD:GPP
Initial conditions <1 (0.3–0.6) <1 (0.4–0.8) >1 (1.6–3) Amended microcosm at the end of the experiment
+N <1 (0.5–0.9) <1 (0.5–0.9) <1> (0.7–1.2) +P <1 (0.5–0.8) <1> (0.7–1.4) >1 (1.3–2.2) +NP 1 (0.2–0.4) 1 (0.3–0.6) 1 (0.2–0.3)
prokaryotes can incorporate the phytoplankton-produced la-beled dissolved organic carbon and thus transfer it to the particulate pool. This activity would reduce measured PER not only due to underestimated PPd but also due to overesti-mated PPp, in the form of labelled heterotrophic prokaryotes in the particulate organic matter retained on the 0.2 µm filters. Conversely, labeled DOC may be produced from the particu-late pool via trophic-reparticu-lated processes – such as sloppy feed-ing by grazers. The 4 h incubations used here are supposed to fulfil the assumption that heterotrophic transformations or transfers are minimized. In longer incubations of 5–6 h or more, heterotrophic prokaryotes were found to assimilate
∼45 % of the excreted carbon (Fern´andez et al., 1994; Mor´an and Estrada, 2002). Thus, our estimates of PPd should be considered as net fluxes and PER as a minimum value.
During the BOUM cruise, PPp and PPd were also deter-mined in situ, along vertical profiles. In situ PER, in the form of euphotic layer-integrated data, averaged 37 % and no sig-nificant differences were observed among sites A, B and C (L´opez-Sandoval et al., 2011). However, at site A, mean areal PER (30 %) was slightly lower than those in sites B and C (35 % and 37 %, respectively), a trend similar to that observed in the initial conditions in our experiments. A more reasonable comparison is our initial values compared to in situ PER values measured at 12.5 m in the core of the
ed-dies at the same day (Fig. 3, in L´opez-Sandoval et al., 2011). The same pattern was evident, in the form of site A with minimal values, although our estimates were systematically lower. This can possibly be attributed to different methodolo-gies applied (24-h in situ vs. 4-h on-board incubations in our study) since longer incubations have been associated with el-evated PER (Baines and Pace, 1991). In our enrichment ex-periments, the incubations were identical in duration and pe-riod of day, thus estimates of PER among sites or treatments should be comparable.
Additionally, L´opez-Sandoval et al. (2011) have suggested that when variability of PPd is examined within the same ecosystem, PER tends to remain constant over space and time (Mara˜n´on et al., 2004; L´opez-Sandoval et al., 2010) but when contrasting environments are considered, the relative importance of PPd increases under oligotrophic conditions, most probably due to nutrient limitation. Indeed, our ex-periments showed that under conditions of excess N and P (+NP), chlorophyll-a, primary production and assimilation efficiencies increased whereas PER tended to decrease. Per-haps due to the extremely low mineral nutrient concentra-tions present in the surface waters sampled, addiconcentra-tions of N-alone or P-N-alone did not result in large variations of PER. Thus, relieving only one over two co-limiting nutrients did not induce important PER variations.
4.2 Metabolic balance-carbon budget
The initial conditions of the mixed layer (8 m depth) in the three eddies were oligotrophic and no significant differences between GPP and DCR were observed, indicative of equilib-rium between gross production and respiration. Furthermore, in situ measurements over the euphotic zone in the three ed-dies have shown that the west-east gradient was not recogniz-able in terms of integrated primary and bacterial production rates among the three sites and that gross production roughly balanced respiration (Christaki et al., 2011). These findings were explained by the fact that the centre of established anti-cyclonic eddies are known to be zones of nutrient depletion with low rates of biological activity compared to surround-ing areas (e.g. Mouri˜no-Carballido, 2009). A large variety of relative activity rates have been reported with regard to cyclonic compared to anti-cyclonic eddies as well as eddies of different ages (e.g. Mouri˜no-Carballido and McGillicuddy Jr., 2006). These authors, during a study in the oligotrophic Sargasso Sea, have reported that positive rates occurred in younger cyclones and in areas of eddy-eddy interactions, whereas negative NCP rates were observed in anticyclones and older cyclone features that were decaying.
With nutrient additions of both N and P (+NP), commu-nities at all three sites became clearly autotrophic with pos-itive values of NCP. At site A, the community was rather autotrophic in all treatments, whereas at sites B and C the system was balanced in +N (NCP ≈ 0), heterotrophic after a few days of confinement in the unamended control and in +P
(NCP < 0) and net autotrophic in +NP (NCP > 0) (Fig. 2). As respiration rates did not decrease, positive values of NCP reflected essentially a stimulation of autotrophic production. Such system shifts to net autotrophy with nutrient enrichment have been reported previously for oligotrophic systems, e.g. in the coastal NW Mediterranean (Duarte et al., 2004) and the North Pacific Subtropical Gyre (McAndrew et al., 2007). As in our experiments, this shows a decoupling of DCR and GPP, with GPP displaying faster and larger response to lim-iting nutrient additions on a time scale shorter than a week, resulting therefore in positive NCP values and shifting the community balance from net heterotrophy, or balanced, to net autotrophy. It also shows that phytoplankton community was more stimulated by inorganic nutrient additions (+N, +NP) than heterotrophic prokaryotes (Duarte et al., 2000). Addition of P alone had no particular effect on community metabolic balance and responses were similar to those of the unamended controls. The similarity of +P and Control is mainly explained by lack of P-limitation of both phytoplank-ton and heterotrophic prokaryotes, at all three sites (Tanaka et al., 2011). Meanwhile, since nutrient availability seemed similarly low at all three sites (Table 1, Tanaka et al., 2011), the different character of metabolic balance, in the Control and the +P, at sites B and C (net heterotrophic) compared to site A (rather autotrophic) should indicate differences in food web functioning. This may be attributed to the varying water masses which are important factors determining variability in microbial activity (Mart´ınez, 1997). During the BOUM cruise, physical data indicated that at site A the core of the eddy was formed with Surface Modified Atlantic water, while eddies at sites B and C exhibited deeper cores formed by Levantine Intermediate water (Moutin et al., 2011).
Estimates of autotrophic community production were ob-tained with 2 independent methods: one based on14C as-similation (PPtotal), and the second on O2 fluxes (GPP). PPtotal measurements are subject to a number of uncertain-ties mainly regarding rapid uptake of the dissolved fraction, as already discussed above, and O2 fluxes are particularly difficult to measure in very oligotrophic conditions. Some studies argue that the14C assimilation measurements during short incubations approximate gross production and that ob-served discrepancies are due to the omission of the dissolved fraction of primary production (Weger et al., 1989; Gonzalez et al., 2008). Regarding phytoplankton metabolism, it has also been argued that during photosynthesis all CO2respired by mitochondria is re-fixed in photosynthesis (Raven, 1972), meaning that photosynthesis uses more O2than CO2 from the ambient environment, since the latter has an internal source, or, in other words, that phytoplankton carbon uptake during the day is expected to be lower than the oxygen fluxes (Marra, 2009; Marra and Barber, 2004). In this case the14C method will be close to net primary production and carbon assimilation may approach gross production only if respi-ration results in a small loss (e.g. C-assimilation/gross pro-duction >0.8 for a respiration rate <20 %, Marra, 2002). In
-1 -0.6 -0.2 0.2 0.6
1
1.4
-1
-0.6
-0.2
0.2
0.6
1
1.4
1:1lo
g
(P
P
to ta l)
log(GCP)
Fig. 4. Relationship between log-transformed total primary produc-tion (particulate and dissolved, PPtotal, mg C m−3h−1)and gross primary production (GPP, mg C m−3d−1). The equation line is: log(PPtotal) =0.81 (±0.09) · log(GPP) −0.4 (±0.04), r2=0.72,
p <0.0001, standard error in parenthesis. GPP was converted to carbon units by applying a photosynthetic quotient (PQ) of 1.1 (Laws, 1991).
our study, PPtotalmeasured with the14C assimilation method includes in principle both the dissolved and particulate frac-tions and corresponds to the maximum hourly primary pro-duction rates during the day. During the short incubations performed, production surpasses respiration and thus PPtotal would rather correspond to gross hourly production rates. The regression relationship of PPtotal and GPP (daily rate) was significant (r2=0.72, p < 0.0001, Fig. 4), confirming that PPtotalrepresents gross production.
Since BR was not directly measured in our study, we es-timated BCD assuming that BR is 50 % or 100 % of DCR, based on the range of values previously reported for the Mediterranean (Lem´ee et al., 2002; Gonzalez et al., 2003; Navarro et al., 2004). The respective initial BGE would then be on average 15 ± 2 % (when BR is 50 % DCR) or 8 ± 2 % (when BR is 100 % DCR) for the three eddies. Generally, in oligotrophic environments BGE is low (<10–25 %, del Giorgio, 1997). Previous studies have reported BGE to be 2–8% in the NW Mediterranean coastal and offshore waters (Gasol et al., 1998; 7 % in Almeria-Oran front in Semp´er´e et al., 2003). It seems, therefore, that BR was likely at least 50 % of DCR and even the assumption of 100 % still results in a plausible BGE. The estimated ratios of bacterial carbon demand to autotrophic carbon fixation (Table 4) generally followed the same patterns of metabolic shifts as described by NCP variations. In the microcosms where net autotro-phy was observed (NCP > 0, all treatments at site A, +NP at sites B and C, Fig. 2), the carbon-converted GPP and/or
PPtotal, was sufficient to sustain BCD. When the total com-munity was metabolically balanced (NCP ≈ 0, e.g. in +N), the carbon ratios varied in a relatively narrow range around 1, from 0.5 to 1.4 (Table 4). Finally, whenever the microcosms displayed net heterotrophy (NCP < 0, e.g. in +P at sites B and C, Fig. 2), GPP and PPtotalwere not sufficient to supply the BCD, except for PPtotal at site B, with BR assumed as 50 % of the DCR (Table 4).
In addition, positive correlations between PPtotal and BP were observed only in +N and +NP treatments (Table 3), further supporting that heterotrophic prokaryotes and phyto-plankton were coupled in those treatments while the opposite holds true for the +P. This coupling might be interpreted, in this case, as the common response, i.e. the synchrony of tem-poral variations of phytoplankton and heterotrophic prokary-otes’ production in response to forcing factors (e.g. nutrient inputs, Fouilland and Mostajir, 2010).
Variability in nutrient availability constitutes an important regulator of plankton metabolism in open ocean waters (Gon-zalez et al., 2002; Viviani et al., 2011). Both the O2-based and C-based rates showed that, when adding limiting nutri-ents (+NP), rapid shifts in the metabolic balance can occur in favor of net autotrophy, controlled by increases in gross primary production rather than decreases in respiration.
5 Conclusions
Our nutrient addition experiments, performed with olig-otrophic surface waters of three anticyclonic Mediterranean eddies during the summer stratified period, showed that un-der conditions of nutrient deficiency the relative importance of dissolved primary production tends to increase. At the western eddy (site A) nutrient additions provoked a rapid in-crease in autotrophic production which exceeded the carbon requirements of the heterotrophic prokaryotes, in all three treatments of nutrient additions. In the Ionian and Levan-tine basins (sites B and C) the limitation of mineral nutri-ents was not relieved upon addition of N or P alone; net autotrophy resulted only with the addition of both N and P. For future work, integrating seasonal variability of particu-lar hydrographic features in relation to their trophic status may better elucidate the variability in nutrient limiting con-ditions and the role of the resulting osmotroph interactions in the food web functioning and system metabolism in the open oligotrophic Mediterranean waters.
Acknowledgements. This work is a contribution to the BOUM (Biogeochemistry from the Oligotrophic to the Ultraoligotrophic Mediterranean) experiment of the French national LEFE-CYBER program, the European IP SESAME project and the international IMBER project. It was supported by a Ph.D. grant of SESAME IP project for A. Lagaria and by the BOUM experiment. We are grateful to the coordinators of SESAME E. Papathanassiou and of BOUM T. Moutin for their support. We wish to thank the captain and crew of the R/V Atalante for their assistance during the cruise,
A. Fern´andez for her valuable help with the on board experimental work and R. Mauriac for laboratory assistance with counting of 14C samples. We are also grateful to J. Dolan for very useful discussions on our data and critical reading of the manuscript and to the anonymous reviewers for constructive comments.
Edited by: T. Moutin
The publication of this article is financed by CNRS-INSU.
References
Alonso-Saez, L., Vasquez-Dominguez, E., Cardelus, C., Pinhassi, J., Montserrat Sala, M., Lekunberri, I., Balagu´e, V., vila-Costa, M., Unrein, F., Massana, R., Simo, R., and Gasol, J.: Factors controlling the year-round variability in carbon flux through bac-teria in a coastal marine system, Ecosystems, 11, 397–409, 2008. Baines S. B. and Pace, M. L.: The production of dissolved organic matter by phytoplankton and its importance to bacteria: Patterns across marine and freshwater systems, Limnol. Oceanogr., 36, 1078–1090, 1991.
Bjørnsen, P. K.: Phytoplankton exudation of organic matter: Why do healthy cells do it?, Limnol. Oceanogr., 33, 151–154, 1988. Carlson, C. A.: Production and removal processes, in:
Biogeochem-istry of Marine Dissolved Organic Matter, edited by: Hansell, D. A. and Carlson, C. A., Elsevier Science, USA, 91–151, 2002. Christaki, U., Van Wambeke, F., Lefevre, D., Lagaria, A., Prieur,
L., Pujo-Pay, M., Grattepanche, J.-D., Colombet, J., Psarra, S., Dolan, J. R., Sime-Ngando, T., Conan, P., Weinbauer, M. G., and Moutin, T.: Microbial food webs and metabolic state across olig-otrophic waters of the Mediterranean Sea during summer, Bio-geosciences, 8, 1839–1852, doi:10.5194/bg-8-1839-2011, 2011. Copin-Montegut, C.: Alkalinity and carbon budgets in the
Mediter-ranean sea, Global Biogeochem. Cy., 4, 915–925, 1993. del Giorgio, P. A. and Duarte, C. M.: Respiration in the open ocean,
Nature, 420, 379–384, 2002.
del Giorgio, P. A., Cole, J. J., and Cimbleris, A.: Respiration rates in bacteria exceed phytoplankton in unproductive aquatic systems, Nature, 385, 148–151, 1997.
Duarte, C. M., Agusti, S., Gasol, J. M., Vaqu´e, D., and Vazquez-Dominguez, E.: Effect of nutrient supply on the biomass struc-ture of planktonic communities: an experimental test on a Mediterranean coastal community, Mar. Ecol.-Prog. Ser., 206, 87–95, 2000.
Duarte, C. M., Agusti, S., and Vaqu´e, D.: Controls on planktonic metabolism in the Bay of Blanes, northwestern Mediterranean littoral, Limnol. Oceanogr., 49, 2162–2170, 2004.
Fern´andez, M., Bianchi, M., and Van Wambeke, F.: Bacterial biomass, heterotrophic production and utilization of dissolved organic matter photosynthetically produced in the Almeria-Oran front, J. Marine Syst., 5, 313–325, 1994.
Fouilland, E. and Mostajir, B.: Revisited phytoplanktonic carbon dependency of heterotrophic bacteria in fresh waters, transi-tional, coastal and oceanic waters, FEMS Microbiol. Ecol., 73, 419–429, 2010.
Gasol, J. M., Doval, M. D., Pinhassi, J., Calder´on-Paz, J. I., Guixa-Boixareu, N., Vaqu´e, D., and Pedr´os-Ali´o, C.: Diel variations in bacterial heterotrophic activity and growth in the northwestern Mediterranean Sea, Mar. Ecol.-Prog. Ser., 164, 107–124, 1998. Gonzalez, N., Anadon, R., and Mara˜n´on, E.: Large-scale variability
of planktonic net community metabolism in the Atlantic Ocean: importance of temporal changes in oligotrophic subtropical wa-ters, Mar. Ecol.-Prog. Ser., 233, 21–30, 2002.
Gonzalez, N., Anadon, R., and Viesca, L.: Carbon flux thought the microbial community in a temperate sea during summer: role of bacterial metabolism, Aquat. Microb. Ecol., 33, 117–126, 2003. Gonzalez, N., Gatusso, J. P., and Middelburg, J. J.: Oxygen produc-tion and carbon fixaproduc-tion in oligotrophic coastal bays and the re-latiosnip with gross and net primary production, Aquat. Microb. Ecol., 52, 119–130, 2008.
Hamad, N., Millot, C., and Taupier-Letage, I.: A new hypothesis about the circulation in the eastern basin of the Mediterranean sea, Progr. Oceanogr., 66, 287–298, 2005.
Holmes, R. M., Aminot, A., K´erouel, R., Hooker, B. A., and Peter-son, B. J.: A simple and precise method for measuring ammo-nium in marine and freshwater ecosystems, Can. J. Fish. Aquat. Sci., 56, 1801–1808, 1999.
Ignatiades, L., Gotsis-Skretas, O., Pagou, K., and Krasakopoulou, E.: Diversification of phytoplankton community structure and re-lated parameters along a large-scale longitudinal east-west tran-sect of the Mediterranean Sea, J. Plankton Res., 31, 411–428, 2009.
Jumars, P. A., Penry, D. L., Baross, J. A., Perry, M. A., and Frost, B. W.: Closing the microbial loop: dissolved carbon pathway to heterotrophic bacteria from incomplete ingestion, digestion and absorption in animals, Deep-Sea Res., 36, 483–495, 1989. Kirchman, D. L.: Leucine incorporation as a measure of biomass
production by heterotrophic bacteria, in: Handbook of methods in aquatic microbial ecology, edited by: Kemp, P. F., Sherr, B. F., Sherr, E. B., and Cole, J. J., Lewis Publishers, Ann Arbor, 509–512, 1993.
Kress, N., Thingstad, F., Pitta, P., Psarra, S., Tanaka, T., Zohary, T., Groom, S., Herut, B., Fauzi, R., Mantoura, C., Polychronaki, T., Rassoulzadegan, F., and Spyres, G.: Effect of P and N addition to oligotrophic Eastern Mediterranean waters influenced by near-shore waters: A microcosm experiment, Deep-Sea Res. Pt. II, 52, 3054–3073, 2005.
Krom, M. D, Kress, N., and Brenner, S.: Phosphorus limitation of primary productivity in the eastern Mediterranean Sea, Limnol. Oceanogr., 36, 424–432, 1991.
Laws, E. A.: Photosynthetic quotients, new production and net community production in the open ocean, Deep-Sea Res., 38, 143–167, 1991.
Lef`evre, D., Guigue, C., and Obernosterer, I.: The metabolic bal-ance at two contrasting sites in the Southern Ocean: The iron-fertilized Kerguelen area and HNLC waters, Deep Sea Res. Pt. II, 55, 766–776, 2008.
Lem´ee, R., Rochelle-Newall, E., Van Wambeke, F., Pizay, M.-D., Rinaldi, P., and Gattuso, J. P.: Seasonal variation of bacterial production, respiration and growth efficiency in the open NW
Mediterranean Sea, Aquat. Microb. Ecol., 29, 227–237, 2002. L´opez-Sandoval, D., Mara˜n´on, E., Fern´andez, A., Gonz´alez, J.,
Gasol, J. M., Lekunberri, I., Varela, M., Calvo-D´ıaz, A., Mor´an, X. A., ´Alvarez-Salgado, X. A., and Figueiras, F. G.: Particulate and dissolved primary production by contrasting phytoplankton assemblages during mesocosm experiments in R´ıa de Vigo (NW Spain), J. Plankton Res., 32, 1231–1240, 2010.
L´opez-Sandoval, D. C., Fern´andez, A., and Mara˜n´on, E.: Dis-solved and particulate primary production along a longitudinal gradient in the Mediterranean Sea, Biogeosciences, 8, 815–825, doi:10.5194/bg-8-815-2011, 2011.
Maixandeau, A., Lef`evre, D., Karayanni, H., Christaki, U., Van Wambeke, F., Thyssen, M., Denis, M., Fernadez, C., Uitz, J., Leblanc, K., and Qu´eguiner, B.: Respiration in relation to micro-bial food web structure in Northeastern Atlantic Ocean, J. Geo-phys. Res., 10, C07S17, doi:1029/2004JC002694, 2005. Marie, D., Partensky, F., Simon, N., Guillou, L., and Vaulot, D.:
Flow cytometry analysis of marine picoplankton, in: Living Col-ors: Protocols in Flow Cytometry and Cell sorting, edited by: Diamond, R. A. and DeMaggio, S., Springer Verlag, Berlin, 421– 454, 2000.
Mara˜n´on, E., Cermeno, P., Fernandez, E., Rodriguez, J., and Za-bala, L.: Significance and mechanisms of photosynthetic produc-tion of dissolved organic carbon in a coastal eutrophic ecosystem, Limnol. Oceanogr., 49, 1652–1666, 2004.
Marra, J.: Approaches to the measurement of plankton production, in: Phytoplankton productivity in marine and aquatic environ-ments, edited by: Williams, P. J. Le B., Thomas, D. N., and Reynolds, C. S., Blackwell Science, Oxford, 78–108, 2002. Marra, J.: Net and gross productivity: weighing in with14C, Aquat.
Microb. Ecol., 56, 123–131, 2009.
Marra, J. and Barber, R. T: Phytoplankton and heterotrophic respi-ration in the surface layer of the ocean, Geophys. Res. Lett., 31, L09314, doi:10.1029/2004GL019664, 2004.
Mart´ınez, R.: Enhancement of microplankton respiratory activity in the Almeria-Oran Front (Western Mediterranean Sea), J. Plank-ton Res., 19, 2051–2065, 1997.
McAndrew, P. M., Bj¨orkman, K. M., Matthew, J. C., Morris, P. J., Jachowski, N., Williams, P. J. B., and Karl, D. M.: Metabolic re-sponse of oligotrophic plankton communities to deep water nu-trient enrichment, Mar. Ecol.-Prog. Ser., 332, 63–75, 2007. Millot, C.: Circulation in the Western Mediterranean Sea, J. Marine
Syst., 20, 423–442, 1999.
Mor´an, X. A. and Estrada, M.: Short-term variability of photosyn-thetic parameters and particulate and dissolved primary produc-tion in the Alboran Sea (SW Mediterranean), Mar. Ecol.-Prog. Ser., 212, 53–67, 2001.
Mor´an, X. A. and Estrada, M.: Phytoplanktonic DOC and POC production in the Bransfield and Gerlache Straits as derived from kinetic experiments of14C incorporation, Deep-Sea Res. Pt. II, 49, 769–786, 2002.
Mouri˜no-Carballido, B.: Eddy-driven pulses of respiration in the Sargasso Sea, Deep-Sea Res. Pt. I., 56, 1242–1250, 2009. Mouri˜no-Carballido, B. and McGillicuddy Jr., D. J.: Mesoscale
activity in the metabolic balance of the Sargasso Sea, Limnol. Oceanogr., 51, 2675–2689, 2006.
Moutin, T. and Raimbault, P.: Primary production, carbon export and nutrients availability in western and eastern Mediterranean Sea in early summer 1996 (MINOS cruise), J. Marine Syst.,
33–34, 273–288, 2002.
Moutin, T., Van Wambeke, F., and Prieur, L.: The Biogeochemistry from the Oligotrophic to the Ultraoligotrophic Mediterranean (BOUM) experiment, Biogeosciences Discuss., 8, 8091–8160, doi:10.5194/bgd-8-8091-2011, 2011.
Nagata, T.: Organic matter-bacteria interactions in seawater, in: Mi-crobial Ecology of the Oceans, 2nd edn., edited by: Kirchman, D., Wiley, New York, 207–241, 2008.
Navarro, N., Agust´ı, S., and Duarte, C. M.: Plankton metabolism and dissolved organic carbon use in the Bay of Palma, N. W. Mediterranean Sea, Limnol. Oceanogr., 37, 47–54, 2004. Obernosterer, I. and Herndl, G. J.: Phytoplankton extracellular
re-lease and bacterial growth: dependence on the inorganic N:P ra-tio, Mar. Ecol.-Prog. Ser., 116, 247–257, 1995.
Puillat, I., Taupier-Letage, I., and Millot, C.: Algerian Eddies life-time can near 3 years, J. Marine Syst., 31, 245–259, 2002. Pujo-Pay, M., Conan, P., Oriol, L., Cornet-Barthaux, V., Falco,
C., Ghiglione, J.-F., Goyet, C., Moutin, T., and Prieur, L.: In-tegrated survey of elemental stoichiometry (C, N, P) from the western to eastern Mediterranean Sea, Biogeosciences, 8, 883– 899, doi:10.5194/bg-8-883-2011, 2011.
Raven, J. A.: Endogenous inorganic carbon sources in plant pho-tosynthesis. I. Occurrence of the dark respiratory pathways in illuminated green cells, New Phytol., 71, 227–247, 1972. Reinthaler, T., Bakker, K., Manuels, R., van Ooijen, J., and Herndl,
G. J.: Automated spectrophotometric approach to determine oxygen concentrations in seawater via continuous-flow analysis, Limnol. Oceanogr.-Meth., 4, 358–366, 2006.
Robinson, C.: Hetrotrophic bacterial respiration, in: Microbial Ecology of the Oceans, 2nd edn., edited by: Kirchman, D., Wi-ley, New York, 299–334, 2008.
Semp´er´e, R., Dafner, E., Van Wambeke, F., Lef`evre, D., Magen, C., All`ere, S., Bruyant, F., Bianchi, M., and Prieur, L.: Distri-bution and cycling of total organic carbon across the Almeria-Oran Front in the Mediterranean Sea: Implications for car-bon cycling in the western basin, J. Geophys. Res., 108, 3361, doi:10.1029/2002JC001475, 2003.
Smith, D. C. and Azam, F.: A simple, economical method for measuring bacterial protein synthesis rates in seawater using3 H-leucine, Mar. Microb. Fd Webs, 6, 107–114, 1992.
Steemann-Nielsen, E.: The use of radioactive carbon (14C) for mea-suring organic production in the sea, J. Cons. Int. Explor. Mer., 18, 117–140, 1952.
Tanaka, T., Thingstad, T. F., Christaki, U., Colombet, J., Cornet-Barthaux, V., Courties, C., Grattepanche, J.-D., Lagaria, A., Ne-doma, J., Oriol, L., Psarra, S., Pujo-Pay, M., and Van Wambeke, F.: Lack of P-limitation of phytoplankton and heterotrophic prokaryotes in surface waters of three anticyclonic eddies in the stratified Mediterranean Sea, Biogeosciences, 8, 525–538, doi:10.5194/bg-8-525-2011, 2011.
Teira, E., Serret, P., and Fernandez, E.: Phytoplankton size-structure, particulate and dissolved organic carbon production and oxygen fluxes through microbial communities in the NW Iberian coastal transition zone, Mar. Ecol.-Prog. Ser., 219, 65– 83, 2001.
Thingstad, T. F. and Rassoulzadegan, F.: Nutrient limitations, mi-crobial food webs, and “biological C-pumps”: suggested inter-actions in a P-limited Mediterranean, Mar. Ecol.-Prog. Ser., 117, 299–306, 1995.
Thingstad, T. F., Zweifel, U. L., and Rassoulzadegan, F.: P limita-tion of heterotrophic bacteria and phytoplankton in the northwest Mediterranean, Limnol. Oceanogr., 43, 88–94, 1998.
Thingstad, T. F., Krom, M. D., Mantoura, R. F. C., Flaten, G. A. F., Groom, S., Herut, B., Kress, N., Law, C. S., Pasternak, A., Pitta, P., Psarra, S., Rassoulzadegan, F., Tanaka, T., Tselepides, A., Wassman, P., Woodward, E. M. S., Wexels, R. C., Zodiatis, G., and Zohary, T.: Nature of phosphorus limitation in the Ultraolig-otrophic Eastern Mediterranean Sea, Science, 309, 1068–1071, 2005.
Tr´eguer, P. and Le Corre, P.: Manuel d’analyse des sels nutri-tifs dans l’eau de mer, Laboratoire d’Oc´eanographie Chimique, Univ. Bretagne Occidentale (2nd edn.), Brest, 1975.
Troussellier, M., Courties, C., and Zettelmaier, S.: Flow cytomet-ric analysis of coastal lagoon bacterioplankton and picophyto-plankton: Fixation and storage effects, Estuar. Coast. Shelf S., 40, 621–633, 1995.
Van Wambeke, F., Christaki, U., Giannakourou, A., Moutin, T., and Souvemerzoglou, K.: Longitudinal and vertical trends of bacte-rial limitation by phosphorus and carbon in the Mediterranean sea, Microb. Ecol., 43, 119–133, 2002.
Van Wambeke, F., Catala, P., Pujo-Pay, M., and Lebaron, P.: Ver-tical and longitudinal gradients in HNA-LNA cell abundances and cytometric characteristics in the Mediterranean Sea, Biogeo-sciences, 8, 1853–1863, doi:10.5194/bg-8-1853-2011, 2011. Viviani, D. A., Bj¨orkman, K. M., Karl, D. M., and Church, M. J.:
Plankton metabolism in surface waters of the tropical and sub-tropical Pacific Ocean, Aquat. Microb. Ecol., 62, 1–12, 2011. Weger, H. G., Herzig, R., Falkoswki G., and Turpin, D. H.:
Res-piratory losses in the light in a marine diatom: Measurements by short-term mass spectrometry, Limnol. Oceanogr., 34, 1153– 1161, 1989.
Wetz, M. S. and Wheeler, P.: Release of dissolved organic matter by coastal diatoms, Limnol. Oceanogr., 52, 798–807, 2007. Williams, P. J. le B., Morris, P. J., and Karl, D. M.: Net community
production and metabolic balance at the oligotrophic ocean site, station ALOHA, Deep-Sea Res. Pt. I, 51, 1563–1578, 2004. Yentsch, C. S. and Menzel, G. L.: A method for the determination
of phytoplankton chlorophyll and phaeophytin by fluorescence, Deep-Sea Res., 10, 221–231, 1963.
Zohary, T. and Robarts, R.: Experimental study of microbial P limi-tation in the eastern Mediterranean, Limnol. Oceanogr., 43, 387– 395, 1998.
Zohary, T., Herut, B., Krom, M. D., Mantoura, R. F. C., Pitta, P., Psarra, S., Rassoulzadegan, F., Stambler, N., Tanaka, T., Thingstad, T. F., and Woodward, E. M. S.: P-limited bacteria but N and P co-limited phytoplankton in the Eastern Mediterranean – a microcosm experiment, Deep-Sea Res., 52, 3011–3023, 2005.