The EvoluƟ on of Canada’s Regional Economies:
Structural PaƩ erns, Emerging Trends and Future Challenges
PIERREͳMARCEL DESJARDINS MARIO POLÈSE
RICHARD SHEARMUR
StaƟ sƟ cal
Appendix
L’évolution des économies régionales du Canada : configurations structurelles, tendances émergentes et défis futurs
ii This report is funded by the Atlantic Canada Opportunities Agency (ACOA) under the
Atlantic Policy Research Initiative, which provides a vehicle for the analysis of key socio-economic policy issues in Atlantic Canada. The views expressed in this study do not necessarily reflect the views of ACOA or of the Government of Canada. The author is responsible for the accuracy, reliability and currency of the information.
Cette étude est également disponible en français :
www.ucs.inrs.ca/ucs/publications/collections/rapports-et-notes-de-recherche
laser.ucs.inrs.ca
ISBN 978-2-89575-292-9
Legal Deposit : Bibliothèque et Archives nationales du Québec, 2013 Bibliothèque et Archives Canada
© All rights reserved
Source: Authors calculations from http://www.ic.gc.ca/eic/site/tdo-dcd.nsf/eng/home 15%
20%
25%
30%
35%
40%
45%
Figure 1.1: Merchandise Exports as a percentage of GDP, Canada, 1971-2009
Peak Year 2000 = 40%
NAFTA takes off
2 Source: Authors calculations from http://www.ic.gc.ca/eic/site/tdo-dcd.nsf/eng/home
60%
65%
70%
75%
80%
85%
90%
Figure 1. 2: Percentage of Canadian Merchandise Exports Going to the US, 1971-2009
Year 1991
Peak Years 2000-2002
3 Source: Authors calculations from http://www.ic.gc.ca/eic/site/tdo-dcd.nsf/eng/home
0%
5%
10%
15%
20%
25%
30%
35%
40%
45%
50%
Figure 1.3: Canadian Merchandise Exports by Product as a Percentage of Total Exports, 1971-2009
Agriculture &
fishing
Energy
Forestry
Auto
Other Manufactured Goods
4 Source: Authors calculations from http://www.ic.gc.ca/eic/site/tdo-dcd.nsf/eng/home
0 20,000 40,000 60,000 80,000 100,000 120,000
Millions of current dollars
Figure 1.4: Exports of Automobiles and Auto Parts 1971-2009
5 Source: Authors’ calculations from Statistics Canada data.
-0.4 -0.3 -0.2 -0.1 0 0.1 0.2 0.3 0.4
BC AB SK MB ON QC NB NS PEI NL
GDP per capita (Canada = 0)
Figure 1.5: GDP per capita, Candian Provinces: Deviation from Canadian Average, 1990, 2000, 2008
1990 2000 2008
6 Source: Authors’ calculations from Statistics Canada data.
0.500 0.550 0.600 0.650 0.700 0.750 0.800 0.850 0.900 0.950 1.000
Figure 1.6: GDP per capita, Quebec and Newfoundland and Labrador (Ontario = 1.000), 1981-2008
QC / ON
NL / ON
7 Source: Authors’ calculations from Statistics Canada data.
0.500 0.550 0.600 0.650 0.700 0.750 0.800
Figure 1.7: GDP per capita, Maritime Provinces (Ontario = 1.000) 1981-2008
NS / ON NB / ON PEI / ON
8 Source: Authors’ calculations from Statistics Canada data.
0.800 0.850 0.900 0.950 1.000 1.050 1.100 1.150 1.200
Figure 1.8: GDP per capita, Ontario, Quebec and B.C. (Canada = 1.000), 1981-2008
ON / CA QC / CA BC / CA
9 Source: Authors’ calculations from Statistics Canada data.
0.860 0.880 0.900 0.920 0.940 0.960 0.980 1.000 1.020
Figure 1.9: Paid Employees, Weekly Earnings, Quebec and British Columbia (Ontario = 1,000), 1991-2010
QC / ON BC /ON
10 Source: Authors’ calculations from Statistics Canada data.
0.600 0.650 0.700 0.750 0.800 0.850 0.900 0.950 1.000
Figure 1.10: GDP per capita, Manitoba and Saskatchewan (Ontario = 1.000), 1981-2008
MB /ON
SK /ON
11 Source: Authors’ calculations from Statistics Canada data.
0.50 0.60 0.70 0.80 0.90 1.00 1.10 1.20 1.30 1.40 1.50 1.60 1.70 1.80 1.90 2.00 2.10
Figure 1.11: Evolution of Employment (1990 = 1.00), Six Industries, Canada, 1990-2008
Agriculture
Forestry, fishing, mining, oil and gas
Manufacturing
Finance and insurance
Professional, scientific and technical services
Information, culture and recreation
12 Source: Authors’ calculations from Statistics Canada data.
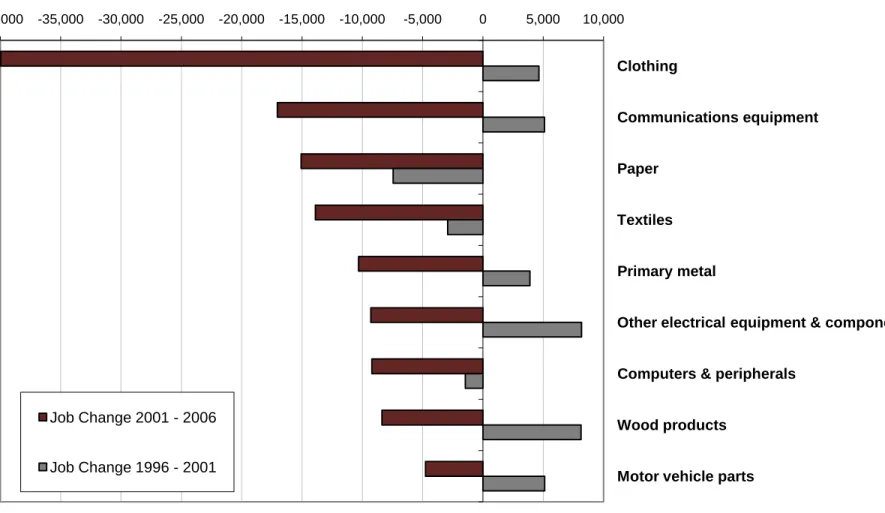
-40,000 -35,000 -30,000 -25,000 -20,000 -15,000 -10,000 -5,000 0 5,000 10,000
Clothing
Communications equipment
Paper
Textiles
Primary metal
Other electrical equipment & components
Computers & peripherals
Wood products
Motor vehicle parts
Figure 1.12: Principal Job Changes in Manufacturing by Industry, Canada, 1996-2001 and 2001-2006
Job Change 2001 - 2006
Job Change 1996 - 2001
13 Source: Authors’ calculations from Statistics Canada data.
0.7 0.8 0.9 1.0 1.1 1.2 1.3 1.4
Men / Women
Figure 1.13: Unemployment Rate, Men Compared to Women, Canada, 1976-2009
Men/Women
14 Source: Authors’ calculations from Statistics Canada data.
30 50 70 90 110 130 150 170 190 210
1999 2000 2001 2002 2003 2004 2005 2006 2007 2008 2009 2010
Thousands
Figure 1.14: Employment in Forestry and Extractive Industries, Canada,1999-2010
Forestry and logging
Mining and oil & gas extraction
15 Source: Authors’ calculations from Statistics Canada data.
0 200 400 600 800 1,000 1,200 1,400 1,600 1,800 2,000
Agriculture Forestry, fishing, mining, oil and gas
Manufacturing Finance and insurance
Professional, scientific and technical services
Information, culture and recreation
Thousands
Figure 1.15: Employment in Six Industries, Canada, 2008
16 Source: Authors’ calculations from Statistics Canada data.
25%
27%
29%
31%
33%
35%
37%
Figure 1.16: Population 55 to 69 Years of Age (% of population over 15), Canada, 1976-2009
17 Source: Authors’ calculations from Statistics Canada data.
62%
63%
64%
65%
66%
67%
68%
1987 1988 1989 1990 1991 1992 1993 1994 1995 1996 1997 1998 1999 2000 2001 2002 2003 2004 2005 2006 2007 2008 2009
Figure 2.1: Census Metropolitan Areas (CMAs) as a % of Canadian total : Population and Employment, 1987-2009
CMAs/Canada - Population
CMAs/Canada - Employment End of Techno-Boom
Financial Crash
Bottom of the Recession
18 Source: Authors’ calculations from Statistics Canada data.
-0.6%
-0.4%
-0.2%
0.0%
0.2%
0.4%
0.6%
0.8%
1.0%
1988 1989 1990 1991 1992 1993 1994 1995 1996 1997 1998 1999 2000 2001 2002 2003 2004 2005 2006 2007 2008 2009
Figure 2.2: CMAs as a Share of Canadian Employment: Change Over Previous Year, 1988-2009
Dot.com - Nafta Boom
Bust
Resurgence
Financial Crash
19 Source: Authors’ calculations from Statistics Canada data.
51.0%
51.5%
52.0%
52.5%
53.0%
53.5%
1987 1988 1989 1990 1991 1992 1993 1994 1995 1996 1997 1998 1999 2000 2001 2002 2003 2004 2005 2006 2007 2008 2009
Figure 2.3: Share of Total CMA Employment in Toronto, Montreal, and Vancouver, 1987-2009
20 Source: Authors’ calculations from Statistics Canada data.
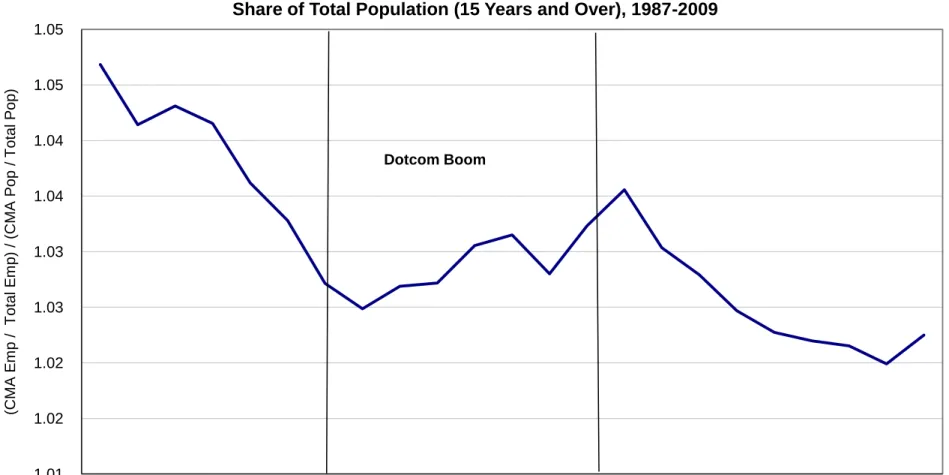
1.01 1.02 1.02 1.03 1.03 1.04 1.04 1.05 1.05
1987 1988 1989 1990 1991 1992 1993 1994 1995 1996 1997 1998 1999 2000 2001 2002 2003 2004 2005 2006 2007 2008 2009
(CMA Emp / Total Emp) / (CMA Pop / Total Pop)
Figure 2.4: CMAs as a Share of a Total Canadian Employment Compared to CMAs as a Share of Total Population (15 Years and Over), 1987-2009
Dotcom Boom
21 Source: Authors’ calculations from Statistics Canada data.
55%
59%
63%
67%
71%
75%
1971 1981 1991 1996 2001 2006
Figure 2.5: Share of Canadian Population Living Within a 90-minute or 2-hour Radius of a Major CMA (pop. 500,000 and over ) 1971-2006
2-hour Radius 90-minute Radius
22 Source: Authors’ calculations from Statistics Canada data.
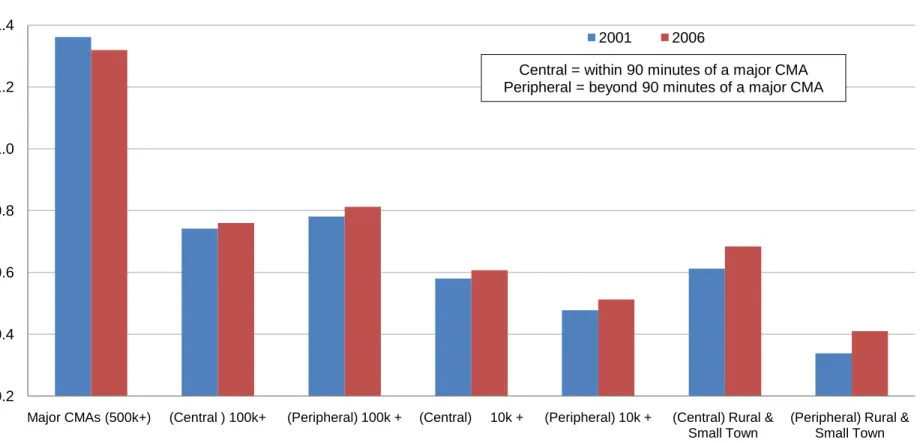
0.2 0.4 0.6 0.8 1.0 1.2 1.4
Major CMAs (500k+) (Central ) 100k+ (Peripheral) 100k + (Central) 10k + (Peripheral) 10k + (Central) Rural &
Small Town
(Peripheral) Rural &
Small Town
Figure 2.6: Employment in Professional, Scientific and Technical Services, Location Quotient by City-Size and Distance (Canada = 1.00) 2001 and 2006
2001 2006
Central = within 90 minutes of a major CMA Peripheral = beyond 90 minutes of a major CMA
23 Source: Authors’ calculations from Statistics Canada data.
0.4 0.5 0.6 0.7 0.8 0.9 1.0 1.1 1.2 1.3
Major CMAs (500k+)
(Central ) 100k+ (Peripheral) 100k + (Central) 10k + (Peripheral) 10k + (Central) Rural &
Small Town
(Peripheral) Rural
& Small Town
Figure 2.7: Employment in Telecommunications, Media and the Arts (NAICS Codes 51 & 71), Location Quotient by City-Size and Distance (Canada = 1.00) 2001 and 2006
2001 2006
Central = within 90 minutes of a major CMA.
Peripheral = beyond 90 minutes of a major CMA
24 Source: Authors’ calculations from Statistics Canada data.
0.0 0.2 0.4 0.6 0.8 1.0 1.2 1.4 1.6
Major CMAs (500k+)
(Central ) 100k+ (Peripheral) 100k + (Central) 10k + (Peripheral) 10k + (Central) Rural &
Small Town
(Peripheral) Rural &
Small Town
Figure 2.8: Employment in Mid-tech Manufacturing (non resource-based), Location Quotient by City-Size and Distance (Canada = 1.00) 2001 and 2006
2001 2006
Central = within 90 minutes of a major CMA.
Peripheral = beyond 90 minutes of a major CMA
25 Source: Authors’ calculations from Statistics Canada data.
0.0 0.5 1.0 1.5 2.0 2.5
Major CMAs (500k+)
(Central ) 100k+ (Peripheral) 100k + (Central) 10k + (Peripheral) 10k + (Central) Rural &
Small Town
(Peripheral) Rural &
Small Town
Figure 2.9: Employment in Resource-Based Manufacturing ,
Location Quotient by City-Size and Distance (Canada = 1.00) 2001 and 2006
2001 2006
Central = within 90 minutes of a major CMA.
Peripheral = beyond 90 minutes of a major CMA
26 Source: Authors’ calculations from Statistics Canada data.
0.0 0.2 0.4 0.6 0.8 1.0 1.2 1.4 1.6 1.8 2.0
Major CMAs (500k+) (Central ) 100k+ (Peripheral) 100k + (Central) 10k + (Peripheral) 10k + (Central) Rural &
Small Town
(Peripheral) Rural &
Small Town
Figure 2.10: Employment in High-tech Manufacturing,
Location Quotient by City-Size and Distance (Canada = 1.00) 2001 and 2006
2001 2006
Central = within 90 minutes of a major CMA.
Peripheral = beyond 90 minutes of a major CMA
27 Source: Authors’ calculations from Statistics Canada data.
4%
6%
8%
10%
12%
14%
16%
18%
20%
Major CMAs (500k+)
(Central ) 100k+ (Peripheral) 100k + (Central) 10k + (Peripheral) 10k + (Central) Rural &
Small Town
(Peripheral) Rural &
Small Town
Figure 2.11: Percentage of the Population with a University Degree, By City-Size and Distance, 2001 and 2006
2001 2006
Central = within 90 minutes of a major CMA.
Peripheral = beyond 90 minutes of a major CMA
28
n % n %
Montréal 26410 49,2% 23375 43,6%
Toronto 9585 17,9% 7960 14,8%
Hamilton 730 1,4% 735 1,4%
Kitchener 585 1,1% 700 1,3%
Granby 525 1,0% 555 1,0%
St. Catharines - Niagara 820 1,5% 515 1,0%
Oshawa 325 0,6% 500 0,9%
Ottawa - Gatineau 415 0,8% 405 0,8%
London 185 0,3% 330 0,6%
Saint-Jean-sur-Richelieu 315 0,6% 330 0,6%
Barrie 360 0,7% 245 0,5%
Stratford 50 0,1% 200 0,4%
Other Communities 1 895 3,5% 2 280 4,2%
Total 42 200 78,7% 38 130 71,1%
n % n %
Toronto 20300 27,8% 20780 28,4%
Montréal 15750 21,5% 15495 21,2%
Ottawa - Gatineau 2780 3,8% 2845 3,9%
Kitchener 1660 2,3% 1930 2,6%
Hamilton 1390 1,9% 1495 2,0%
London 955 1,3% 1120 1,5%
Oshawa 865 1,2% 930 1,3%
St. Catharines - Niagara 695 1,0% 560 0,8%
Guelph 555 0,8% 465 0,6%
Brantford 385 0,5% 450 0,6%
Sherbrooke 425 0,6% 420 0,6%
Drummondville 430 0,6% 410 0,6%
Other Communities 3 895 5,3% 4 595 6,3%
Total 50 085 68,5% 51 495 70,5%
n % n %
Toronto 23155 27,2% 17105 29,3%
Montréal 17945 21,1% 9730 16,7%
Ottawa - Gatineau 12740 15,0% 6875 11,8%
Kitchener 2990 3,5% 3860 6,6%
Granby 2320 2,7% 2020 3,5%
Hamilton 1290 1,5% 1030 1,8%
Oshawa 945 1,1% 640 1,1%
Sherbrooke 590 0,7% 505 0,9%
London 530 0,6% 315 0,5%
Cowansville 180 0,2% 230 0,4%
Belleville 545 0,6% 220 0,4%
Barrie 145 0,2% 215 0,4%
Other Communities 4 420 5,2% 2 560 4,4%
Total 67 795 79,6% 45 305 77,6%
High Tech Regional Total (3 groups) 160 080 % 134 930 % Canada total 211 922 75,5% 183 922 73,4%
CMA /CA 2001 2006
Table 2.1. High Tech Manufacturing Employment in and Within a 2-hour Radius of Toronto, Montreal, and Ottawa, 2001 and 2006
Aerospace (NAICS 3364)
Pharmaceutical and Medical Equipment (3254, 3345,46, 3391)
CMA /CA 2001 2006
Computer, Telecommunications and Audio (3342, 43, 44)
CMA /CA 2001 2006
n = number of jobs
Source: Authors’ calculations from Statistics Canada data.
29 Table 2.2. Location of Canadian Universities Ranked in the Top 200 in 2010
(according to three sources)
Urban Area
Ranks given appear in the following order of source: Webometrics;
Shanghai Jiao-Tong; Times-QS*
(If no number given, not ranked in the top 200 by that source)
Toronto Toronto York
28, 24, 29 145, ---, ---
Other Ontario
Waterloo McMaster Queens Western Ontario 85, ---, 113 187, 89, 143 194, --- , 118 196, ---, 151
Montreal Montréal McGill UQAM
72, 126, 107 86, 60, 18 173, --- , ---
Vancouver UBC Simon Fraser
49, 35, 40 69, --- , 196
Calgary Calgary
50,--- , 149
Edmonton Alberta
59, 125, 59
Quebec City Laval
161, ---, ---
Ottawa Carleton
163, ---, ---
Winnipeg Manitoba
200, --- , ---
*Source : http://www.webometrics.info/; http://www.arwu.org;
http://www.topuniversities.com/university-rankings.
30 CMA
Location Quotient
2006
Change since
2001
CMA
Location Quotient
2006
Change since
2001
CMA
Location Quotient
2006
Change since
2001
CMA
Location Quotient
2006
Change since
2001
CMA
Location Quotient
2006
Change since
2001
Sudbury 5,29 -0,90 Windsor 1,95 -0,07 Regina 2,06 0,43 Calgary 1,52 -0,02 Toronto 1,59 -0,01
Calgary 4,66 0,00 Kitchener 1,84 0,02 Montréal 1,61 0,06 Toronto 1,40 -0,08 Regina 1,44 -0,16
Edmonton 2,28 0,33 Sherbrooke 1,41 -0,13 Vancouver 1,52 -0,14 Ottawa 1,32 -0,20 Kitchener 1,32 0,05 St. John's 1,72 0,35 Trois-Rivières 1,29 0,05 Toronto 1,48 -0,01 Saint John 1,29 0,01 Vancouver 1,25 -0,05 Saskatoon 1,68 -0,11 Hamilton 1,28 -0,06 Saint John 1,41 0,08 Vancouver 1,27 0,01 Quebec City 1,19 0,07
Saint John 0,72 0,51 London 1,25 0,11 St. John's 1,40 0,03 Montréal 1,17 -0,03 London 1,18 -0,05
Regina 0,53 0,01 Oshawa 1,23 -0,09 Halifax 1,38 0,07 Halifax 1,15 -0,09 Oshawa 1,12 0,02
Thunder Bay 0,48 -0,20 Toronto 1,14 0,01 Calgary 1,15 -0,11 St. John's 1,11 0,12 Halifax 1,11 -0,03
Saguenay 0,37 0,02 Montréal 1,14 -0,08 Winnipeg 1,11 0,07 Victoria 1,08 0,02 Hamilton 1,10 0,00
Halifax 0,31 -0,12 Saguenay 1,13 -0,04 Ottawa 1,02 -0,15 Edmonton 1,07 -0,05 Montréal 1,07 0,03
Vancouver 0,27 0,07 St. Catharines - Niagara1,09 -0,13 Saskatoon 0,98 -0,01 Oshawa 0,96 0,04 Winnipeg 1,07 0,05 Abbotsford 0,26 0,10 Abbotsford 1,01 0,12 Victoria 0,93 0,03 Quebec City 0,94 -0,04 Calgary 1,00 -0,09
Hamilton 0,15 0,02 Winnipeg 0,94 -0,01 Oshawa 0,92 0,16 London 0,93 0,05 Victoria 0,96 -0,02
Windsor 0,14 -0,08 Quebec City 0,76 0,09 Hamilton 0,86 0,07 Kitchener 0,92 0,05 Edmonton 0,88 -0,04 Table 2.3. Location Quotient by Industry, Selected Industry Groups, CMAs with Highest Values
(in Descending Order, 2006, and Change Since 2001)
Fiinance, Insurance, and Real Estate
Professional and Scientific Services
Extractive Industries Manufacturing Telecommunications, Media, Arts
Location quotient = (employment in industry in region / total employment in region) / (employment in industry in Canada / total employment in Canada)
Source: Authors’ calculations from Statistics Canada data.
31 Source: Authors’ calculations from Statistics Canada data.
1.00 1.05 1.10 1.15 1.20 1.25 1.30 1.35 1.40 1.45
1990 1991 1992 1993 1994 1995 1996 1997 1998 1999 2000 2001 2002 2003 2004 2005 2006 2007 2008 2009
Figure 2.12: Population Change (15 Years and Over), by City-Size Class, 1990-2009 (1990 = 1.00)
600k+
300-600k 100-300K 50-100k 10-50k
32 Source: Authors’ calculations from Statistics Canada data.
-50% -40% -30% -20% -10% 0% 10% 20% 30% 40% 50%
Miramichi Rimouski Rouyn-Val-d'Or Edmundston Bathurst Corner Brook Moose Jaw Cornwall Prince Albert Summerside Norfolk Brandon Charlottetown Baie-Comeau Granby Vernon Lethbridge Chilliwack Medicine Hat Sept-Îles Dawson Creek Red Deer New Glasgow
Figure 2.13: Population Change (%) in Small Cities (10-50k), 1990-1999 and 2000-2009 (by descending order for 2000-2009)
1990-1999 2000-2009
33 Source: Authors’ calculations from Statistics Canada data.
-5% 0% 5% 10% 15% 20% 25% 30% 35% 40%
Cape Breton Prince George Chatham-Kent Sault Ste. Marie Shawinigan North Bay Sarnia Belleville Kamloops Peterborough Fredericton Brantford Drummondville Moncton Guelph Saint-Jean QC Nanaimo Barrie Kelowna
Figure 2.14: Population Change (%) in Mid-Sized Cities (50-100k), 1990-1999 and 2000-2009 (by descending order for 2000-2009)
1990-1999 2000-2009
34 Source: Authors’ calculations from Statistics Canada data.
-10% -5% 0% 5% 10% 15% 20% 25% 30% 35%
Windsor St. Catharines Thunder Bay London Sudbury Saguenay Hamilton Trois-Rivières Saint John Winnipeg Montréal Regina Kitchener Sherbrooke Halifax Victoria Ottawa Toronto St. John's Vancouver Kingston Quebec City Oshawa Saskatoon Edmonton Abbotsford Calgary
Figure 2.15: Employement Change (%) in CMAs, 1990-1999 and 2000-2009 (by descending order for 2000-2009)
1990-1999 2000-2009
35 Source: Authors’ calculations from Statistics Canada data.
-0.5 0.0 0.5 1.0 1.5 2.0
Quebec City Saint John Trois-Rivières Saskatoon Sherbrooke Kingston St. John's Saguenay Regina Victoria Ottawa Halifax Winnipeg Abbotsford Sudbury Montréal Edmonton Vancouver Thunder Bay Calgary Oshawa London Hamilton Kitchener Toronto St. Catharines Windsor
Figure 2.16: Unempoyment Rate in CMAs, % Change, 2000- 2009
36 Source: Authors’ calculations from Statistics Canada data.
-4 -2 0 2 4 6
8 Figure 2.17: Unemployment Rates, Deviation from Canada, Selected CMAs, 1987- 2009
Hamilton
St. Catharines - Niagara London
Windsor
Canada
37 Source: Authors’ calculations from Statistics Canada data.
-4 -3 -2 -1 0 1 2 3
Figure 2.18: Unemployment Rates, Deviation from Canada, Selected CMAs, 1987- 2009
Halifax Quebec City Winnipeg Saskatoon
Canada
38 Source: Authors’ calculations from Statistics Canada data.
-5 -4 -3 -2 -1 0 1 2 3 4 5
Figure 2.19: Unemployment Rates, Deviation from Canada, Selected CMAs, 1987 - 2009
Toronto Montreal Vancouver Calgary
Canada
39 Source: Authors’ calculations from Statistics Canada data.
0.8 0.9 1.0 1.1 1.2 1.3 1.4
Figure 2.20: Population Aged 15 to 24 Years, Selected CMAs, 1987- 2009 (1987 = 1.00)
Montréal Toronto Calgary Vancouver
40 Source: Authors’ calculations from Statistics Canada data.
0.4 0.5 0.6 0.7 0.8 0.9 1.0 1.1 1.2 1.3 1.4
1987 1991 1996 2001 2006 2009
Figure 2.21: Employment in Manufacturing, Location Quotient (Canada = 1.00) Toronto, Montreal, Vancouver, and Calgary, 1987-2009
Toronto Montreal Vancouver Calgary
Canada
41 Source: Authors’ calculations from Statistics Canada data.
0.6 0.7 0.8 0.9 1.0 1.1 1.2 1.3 1.4 1.5
1987 1991 1996 2001 2006 2009
Figure 2.22: Employment in Professional, Scientific & Technical Services, Location Quotient (Canada= 1.00) Toronto, Montreal, Vancouver, and Calgary, 1987-2009
Toronto Montreal Vancouver Calgary
42 Source: Authors’ calculations from Statistics Canada data.
0.6 0.7 0.8 0.9 1.0 1.1 1.2 1.3
1987 1991 1996 2001 2006 2009
Figure 2.23: Employment in Information, Culture & Recreation, Location Quotient (Canadian Average = 1.00) Toronto, Montreal, Vancouver, and Calgary, 1987-2009
Toronto Montreal Vancouver Calgary
43 Source: Authors’ calculations from Statistics Canada data.
0.6 0.7 0.8 0.9 1.0 1.1 1.2 1.3 1.4 1.5
1987 1991 1996 2001 2006 2009
Figure 2.24: Employment in Finance, Insurance & Real Estate, Location Quotient (Canada = 1.00) Toronto, Montreal, Vancouver, and Calgary, 1987-2009
Toronto Montreal Vancouver Calgary
44
Industry L.Q. Industry L.Q. Industry L.Q. Industry L.Q. Industry L.Q.
Computer &
peripherals manufacturing
3,00
Aerospace product & parts manufacturing
4,10
Support activities for water transportation
3,98 Federal government
public administration 7,81 Oil and gas
extraction 9,83 Extractive Cleaning compound
and toiletries 2,57 Clothing
manufacturing 3,26 Water
transportation 2,69
Communications equipment manufacturing
3,46 Pipeline
transportation 9,29 Transport Portfolio
management, securities trading, etc
2,19
Household appliance manufacturing
2,84
Motion picture, sound recording studios
2,51 Museums & heritage
institutions 2,24 Mining -
unspecified 3,58 Finance
Pharmaceutical &
medicine manufacturing
2,07
Pharmaceutical &
medicine manufacturing
2,64 Air transportation 2,23
Software, computer services & data porocessing
2,05 Natural gas
distribution 3,13 High-Tech Manufacturing Employment
services 2,05 Tobacco
manufacturing 2,56 Ship and boat
building 2,21 Support activities for air transportation 1,89
Engineering, architects &
related
2,65 Other
Manufacturing
Advertising 1,98
Electric lighting equipment manufacturing
2,26 Educational
support services 1,82
Computer &
peripherals manufacturing
1,79 Air transportation 2,58
Knowledge &
Creative Services Support activities
for transportation 1,91
Leather & allied product manufacturing
2,17
Other electrical equipment &
components
1,79
Management, scientific & technical consulting
1,59
Pesticide & other agricultural chemical manufacturing
2,35 Public & Social Services Motor vehicle
parts manufacturing
1,82
Motion picture, sound recording studios
1,80 Support activities
for transportation 1,74 Medical equipment
manufacturing 1,52
Petrol & coal products manufacturing
2,12 Plastic product
manufacturing 1,81
Support activities for water transportation
1,80
Support activities for air
transportation
1,69 Architects,
engineering & related 1,38
Medical &
diagnostic laboratories
2,03 Motion picture,
sound recording studios
1,78 Paint & adhesive
manufacturing 1,74 Warehousing &
storage 1,60 Employment services 1,35 Warehousing &
storage 2,00
Banks & other
credit institutions 1,77 Shoe stores 1,73
Community colleges &
CEGEPs
1,56 Telecommunications 1,34 Rail transportation 1,92 Warehousing &
storage 1,74 Textile mills 1,72
Performing arts companies &
artists
1,54
Other electrical equipment &
components
1,31
Audio & video equipment manufacturing
1,87 Calgary
Table 2.4. Twelve Highest Industry Specializations (Location Quotients: L.Q.), Five Largest Metropolitan Areas, 2006
Toronto Montréal Vancouver Ottawa Industry
Colour Codes
Source: Authors’ calculations from Statistics Canada data.
45
Industry L.Q. Industry L.Q. Industry L.Q. Industry L.Q. Industry L.Q.
Radio and Television Receiver Manufacturing
5,07
Aerospace product &
parts manufacturing 4,03
Service Industries Incidental to Water Transport
4,41
International & Other Extra-Territorial Govt Services
10,36
Oil and gas extraction 13,45 Cleaning compound
and toiletteries 2,60 Clothing manufacturing 3,45 Water Transport
Industries 2,91 Federal government public administration
6,72
Pipeline transportation 12,62
Extractive Office, Store and
Business Machines Manufacturing
2,49
Tobacco Products
Manufacturing 3,01 Air Transport Industries 2,66
Communications equipment manufacturing
4,81
Support Activities for Mining and Oil and Gas Extraction
3,48
Transport Inversment and other
Financial Intermediary Industries
2,47
Electric Lighting
Manufacturing 2,71
Motion Picture, Audio and Video Production and Distribution
2,27
Office, Store and Business Machines Manufacturing
3,07
Architectural, Engineering, Design and Related Services
2,83
Finance
Pharmaceutical and Medicine Manufacturing
2,33
Pharmaceutical and Medicine Manufacturing
2,55
Educational Support
Services 2,14 Computer and Related Services
2,79
Petrol & coal products manufacturing
2,75
High-Tech Manufacturin
g Advertising and
Related Services 2,25
Motion Picture, Audio and Video Production and Distribution
2,27
Storage and Warehousing Industries
1,98
Museums & heritage institutions
2,63
Natural gas distribution 2,45
Other Manufacturin
g Motion Picture, Audio
and Video Production and Distribution
2,12
Communication and Other Electronic Equipment Manufacturing
2,18
Ship and boat building 1,96
Service Industries Incidental to Air Transport
1,89
Air transportation
1,86
Knowledge &
Creative Services Scientific and
Professional Equipment Manufacturing
2,10
Textile manufacturing 2,06
Performing arts companies & artists
1,86
Management, Scientific and Technical Consulting
Services 1,71
Management, Scientific and Technical Consulting
Services 1,79
Public &
Social Services Paint and Varnish
Manufacturing 2,10 Cleaning compound and toiletteries 2,02
Architectural, Engineering, Design and Related Services
1,79
Employment Agencies and Personnel Suppliers
1,61
Service Industries Incidental to Air Transport
1,78 Employment Agencies
and Personnel Suppliers
2,08
Paint and Varnish Manufacturing 1,90
Inversment and other Financial Intermediary Industries
1,76
Educational Support Services
1,49
Computer and Related Services
1,75 Plastic and Product
Manufacturing 2,03
International & Other Extra-Territorial Govt.
Services
1,84
Office, Store and Business Machines Manufacturing
1,63
Other Professional, Scientific and Technical Services
1,49
Communications equipment manufacturing
1,63 Electric Lighting
Manufacturing 2,01 Bakery Products 1,68 Insurance and Real Estate Agent Industries
1,63
Postal and Courier Service Industries
1,46
Furniture and Fixture Industries
1,59 Table 2.5 - Twelve Highest Industry Specializations (Location Quotients: L.Q.) Fivre Largest Metropolitan Areas. 1996
Toronto Montréal Vancouver Ottawa Calgary
Industry Colour Codes
Source: Authors’ calculations from Statistics Canada data.
46
Growth Growth Growth
91-96 96-01 01-06
Newfoundland & Labrador 190,259 183,310 -4% 190,003 4% 202,190 6%
Nova Scotia 385,977 379,355 -2% 404,648 7% 432,135 7%
Prince Edward Island 58,618 60,830 4% 64,453 6% 66,690 3%
New Brunswick 288,624 298,140 3% 325,100 9% 349,570 8%
Quebec 3,007,351 3,048,775 1% 3,361,462 10% 3,582,814 7%
Ontario 5,024,893 5,130,250 2% 5,905,483 15% 6,300,625 7%
Manitoba 513,816 520,410 1% 554,745 7% 576,730 4%
Saskatchewan 487,417 490,305 1% 511,958 4% 533,105 4%
Alberta 1,268,793 1,352,375 7% 1,586,305 17% 1,819,785 15%
British Columbia 1,549,746 1,770,215 14% 1,958,773 11% 2,090,595 7%
Territories 39,069 44,630 14% 44,135 -1% 49,225 12%
Table 3.1. Employment Growth by Province, 1991-2006
1991 1996 2001 2006
Province
Source: Authors’ calculations from Statistics Canada data.
47
Table 3.2. Employment Growth by Type of Location, 1991-2006
Class Description 1991 1996 Growth
2001 Growth
2001 new 2006 new Growth
91-96 96-01 01-06
AM Eight largest metro areas 6 215 605 6 420 080 3% 7 407 160 15% 7 400 930 8 129 230 10%
AC1 100K+, within 100km of an AM 1 298 346 1 346 365 4% 1 580 250 17% 1 830 200 1 988 835 9%
AC2 50K-100K, within 100km 432 552 449 970 4% 532 815 18% 370 940 412 920 11%
AC3 25-50K, within 100km 194 658 196 755 1% 223 180 13% 261 295 279 430 7%
AC4 10-25K, within 100km 150 150 151 635 1% 178 280 18% 368 360 404 965 10%
RC rural within 100km 1 131 518 1 204 220 6% 1 383 045 15% 1 139 039 1 076 979 -5%
AP1 100K+, over 100km from an AM 953 238 981 045 3% 1 041 865 6% 1 062 195 1 163 340 10%
AP2 50K-100K, beyond 100km 341 535 361 510 6% 382 395 6% 435 395 491 270 13%
AP3 25-50K, beyond 100km 391 620 412 600 5% 431 335 5% 337 635 368 325 9%
AP4 10-25K, beyond 100km 260 623 265 990 2% 273 825 3% 326 395 341 755 5%
RP rural, beyond100km 1 444 720 1 488 425 3% 1 550 035 4% 1 297 555 1 346 415 4%
Note: The class names are structured as follows: A stands for urban agglomeration; M for metropolitan;
C for central (within 100km of a metropolitan area); P for peripheral (over 100km from a metropolitan area);
and R for rural. As the numbers rise between 1 and 4, population of the urban areas decrease.
Source: Authors’ calculations from Statistics Canada data.