©2014 Scienceweb Publishing
Multivariate statistical analysis of groundwater
chemistry data: The Soummam basin, Algeria
Lazhar Belkhiri
1* and Lotfi Mouni
2 1Department of Hydraulics, University Hadj Lakhdar, 05000 Batna, Algeria. 2
Technical Sciences Department, Institute of Sciences, University of Akli Mohand Oulhadj, Bouira, Algeria. *Corresponding author. E-mail: BELKHIRI_Laz@yahoo.fr.
Accepted 2nd March, 2014
Abstract. Multivariate statistical tools such as cluster analysis and R-mode factor analysis were used to evaluate the spatial the characterization of the groundwater distribution of the Soummam Basin, Algeria. 13 physico-chemical parameters were selected to determine water samples from 20 wells which include: calcium (Ca), magnesium (Mg), sodium (Na), potassium (K), chloride (Cl), sulfate (SO4), bicarbonate (HCO3), nitrate (NO3), iron (Fe), zinc (Zn). Cluster
analysis grouped 20 sampling wells into two clusters, i.e., relatively brackish water (group 1) and moderate saline water (group 2), based on the similarity of water quality characteristics. Factor analysis helped in identifying the factors or sources responsible for water quality variations. The varifactors obtained from factor analysis indicate that the parameters responsible for water quality variations are mainly related to water-rock interaction, agricultural activities and ion exchange.
Keywords: Cluster analysis, factor analysis, groundwater quality, Soummam basin, Algeria.
INTRODUCTION
Water quality gets modified in the course of movement of water through the hydrological cycle and through the operation of the following processes: evaporation, transpiration, selective uptake by vegetation, oxidation/reduction, cation exchange, dissociation of minerals, precipitation of secondary minerals, mixing of waters, leaching of fertilizers and manure, pollution and lake/sea, biological process (Appelo and Postma, 1993). The quality of water is of vital concern for mankind, since it is directly linked with human welfare. Poor quality of water adversely affects the plant growth and human health (Wilcox, 1948; Thorne and Peterson, 1954; US Salinity Laboratory Staff, 1954; Holden, 1971; Todd, 1980; ISI, 1983; WHO, 1984; Hem, 1991; Karanth, 1997). Groundwater quality data gives important clues to the geologic history of rocks and indications of groundwater recharge, movement and storage (Walton, 1970). The knowledge of hydrochemistry is essential to determine the origin of chemical composition of groundwater
(Zaparozec, 1972). The hydrology and geochemistry of waters have been further discussed in the classic works of Stumm and Morgan (1981), Hem (1991), Drever (1988), Domenico and Schwartz (1990).
The multivariate statistical techniques are the appropriate tool for a meaningful data reduction and interpretation of multi-constituent chemical and physical measurements (Massart et al., 1988). The multivariate statistical techniques such as cluster analysis (CA) and factor analysis (FA) have widely been used as unbiased methods in analysis of water quality data for drawing meaningful conclusions (Vega et al., 1998; Helena et al., 2000; Voncina et al., 2002; Raghunath et al., 2002; Simeonov et al., 2003; Simeonova et al., 2003; Simeonov et al., 2004; Singh et al., 2004). The multivariate analysis is widely used to characterized and evaluate groundwater quality and it is useful for evidencing spatial variation caused by natural and anthropogenic processes (Jayakumar and Siraz, 1997; Vega et al., 1998;
Advancement in Scientific and Engineering Research Vol. 2(3), pp. xx-xx, March 2014
ISSN: 2315-9821 Research Paper
Figure 1. Map showing the water sampling locations of the study area.
Reisenhofer et al., 1998; Helena et al., 2000; Singh et al., 2004; Belkhiri et al., 2010).
The objective of the present study is to analyze the 13 physico-chemical parameters in groundwater samples from the Soummam Basin with a view to evaluate the spatial variation. The large dataset obtained was subjected to the CA and FA multivariate techniques to evaluate information about the similarities and dissimilarities present among the different sampling sites, to identify water quality variables for spatial dissimilarity, and to ascertain the influence of the pollution sources on the water quality parameters.
MATERIALS AND METHODS Study area
The Soummam Basin is situated in the northeast of Algeria and extends from 36° 45’ of latitude north to 3° 40’-5° 45’ of longitude east (Figure 1). The Soummam
Basin area is bounded by the Djurdjura mounts on the western, by the Babor mounts on the east and southeastern and by the Mediterranean Sea on the northern side. The climate of the Soummam Basin shows a series of transition between humid climate in the mountains near the Mediterranean and semi-arid climate of high plains. The mean minimum and maximum temperatures are 11.8 and 24.8°C, respectively. The mean annual rainfall of the Basin is about 700 mm (Mouni, 2004). Rocks and unconsolidated deposits in the area can be divided into four geologic formations: (1) Oligocene; (2) Cretaceous; (3) Lower Miocene; (4) Alluvial terraces (Perrier, 1964).
Chemical data
Groundwater samples (N = 20) from the Soummam basin were collected in April 2007. Figure 1 shows the distribution of well sampled. The samples were analyzed
following methods outlined in the American Public Health Association manual (APHA, 1989, 1995a, b). Water samples were collected in stopper-fitted polyethylene bottles and refrigerated at 4°C in order to be analyzed as soon as possible. Conductivity, temperature and pH were measured in situ using a portable water tester.
The water samples were analyzed for major and trace elements. Anions analyzed include sulfate, chloride, bicarbonate and nitrate; cations include calcium, magnesium, sodium and potassium; trace elements include iron and zinc. Ca, Mg, HCO3 and Cl were
analyzed by volumetric titrations. Concentrations of Ca and Mg were estimated titrimetrically using 0.05N EDTA and 0.01N and those of HCO3 and Cl by H2SO4 and
AgNO3 titration, respectively. Concentrations of Na and K
were measured using a flame photometer (Model: Systronics Flame Photometer 128) and that of sulfate (SO4) by turbidimetric method (Clesceri et al., 1998).
Nitrate (NO3) was analyzed by colorimetry with a
UV-visible spectrophotometer (Rowell, 1994). Trace elements were determined by Graphite Furnace Atomic Absorption Spectrophotometer (Perkin-Elmer AAnalyst 700) using multi element Perkin-Elmer standard solutions. Standard solutions for the above analysis were prepared from the respective salts of analytical reagents grades. The accuracy of the chemical analysis was verified by calculating ion-balance errors where the errors were generally within 10%.
Data treatment and multivariate statistical methods Groundwater quality datasets were subjected to four multivariate techniques: cluster analysis (CA) and factor analysis (FA). CA and FA were applied to experimental data, standardized through z-scale transformation to avoid misclassifications arising from the different orders of magnitude of both numerical values and variance of the parameters analyzed (Liu et al., 2003; Simeonov et al., 2003). All mathematical and statistical computations were made using Microsoft Office Excel 2003 and STATISTICA 6.
Cluster analysis
Cluster analysis is the name given to an assortment of techniques designed to perform classification by assigning observations to groups so each is more-or-less homogeneous and distinct from other groups (Davis, 1986). As an exploratory technique with graphic output, cluster analysis does not require many of the assumptions that other statistical methods do, except that the data is heterogeneous. It provides an easily understood graphic display (dendrogram), and is a method used frequently in the geological sciences to help classify or group samples/variables of a data set. It helps
to identify natural groupings for samples (Q-mode), and in turn, reduces the size of the samples/variables into smaller numbers of groups.
Factor analysis
Factor analysis is a multivariate statistical technique, which derives a subset of uncorrelated variables called factors that explain the variance observed in the original dataset (Anazawa and Ohmori, 2005; Brown, 1998). Factor analysis is used to uncover the latent structure of a set of variables. In technical terms, common factor analysis represents the common variance of variables, excluding unique variance, and is thus a correlation-focused approach seeking to reproduce the inter-correlation among the variables. On the other hand, components (from PCA) reflect both common and unique variance of the variables and may be seen as a variance-focused approach that reproduces both the total variable variance with all components as well as the correlations. PCA is far more commonly used than principal factor analysis (PFA). However, it is common to use ‘‘factors’’ interchangeably with ‘‘components’’ in multivariate analysis. Factor analysis can be performed on any kind of scientific data to establish a pattern of variation among variables or reduce large data sets into factors for easy handling and interpretation. The total number of factors generated from a typical factor analysis indicates the total number of possible sources of variation in the data. Factors are ranked in order of merit. The first factor or component has the highest eigenvector sum and represents the most important source of variation in the data. The last factor is the least important process contributing to the chemical variation. Factor loadings on the factor loadings tables are interpreted as correlation coefficients between the variables and the factors.
RESULTS AND DISCUSSION General water chemistry
The pH value of groundwater in the study area ranges from 6.81 to 8.11, which an average of 7.4 indicating a slightly alkaline type of groundwater. The electrical conductivity (EC) of groundwater samples ranges from 540 to 3,440 µS/cm with a mean value of 1,810 µS/cm (Table 1). The large variation in EC is mainly attributed to geochemical processes prevailing in this region. The maximum limit of EC in drinking water is prescribed as 1,500 μS/cm at 25°C (WHO, 2006). Most of the groundwater samples exceed the permissible limit.
The mean value of calcium (Ca) and magnesium (Mg) in the ground waters were 142.9 and 213.23 mg/L, respectively, and the concentrations of calcium and magnesium varied from 70 to 292 mg/L and 66.2 to 340
Table 1. Statistical summary of hydrochemical parameters.
Min Max Mean SD Cv
T 16 21 19 1 6 pH 6.81 8.11 7.40 0.41 5.58 EC 540 3440 1810 725 40 Ca 70.00 292.00 142.90 61.53 43.06 Mg 66.20 340.00 213.23 93.23 43.72 Na 17.80 282.95 107.04 71.24 66.56 K 0.84 24.92 5.87 6.60 112.41 Cl 30.10 319.50 69.94 71.71 102.54 SO4 101.00 730.00 415.50 187.96 45.24 HCO3 1586 4758 3209 727 23 NO3 12.65 170.52 48.82 40.15 82.24 Fe 0.001 0.048 0.018 0.015 82.465 Zn 0.090 1.880 0.798 0.557 69.828
Min: Minimum; Max: Maximum; SD: Standard Deviation. All values are in mg/L except pH, T (°C) and EC (µSiemens/cm).
mg/L, respectively. Calcium as such has no hazardous effect on human health. The upper limit of calcium concentration was specified as 75 mg/L and for magnesium 30 mg/L. It is observed that most samples exceed the desirable limit of calcium and that all the
groundwater samples from the study area exceeded the
desirable limit as per WHO standard of magnesium. Na has different role in human body. It is related with the function of nervous system, membrane system and excretory system. According to WHO (2006) guideline the maximum admissible limit is 200 mg/l. Excess sodium causes high pressure, nervous disorder, etc. In the study area, the Na concentration in groundwater ranges from 17.8 to 282.95 mg/L with a mean of 107.04 mg/L. High concentration of Na and Mg in the groundwater are attributed to cation exchange among minerals. The concentration of K in the study area varies from 0.84 to 24.92 mg/L.
Bicarbonate is the dominant anions followed by Cl, SO4
and NO3. The bicarbonate ion ranges from 1586 to 4758
mg/L with a mean value of 3209 mg/L. Groundwater samples with high values of bicarbonate ion characterize the recharging zones of the study area. Sulfate concentration varied from 101 to 730 mg/L with a mean value of 415.5 mg/L. Most of the groundwater samples in study area are within the desirable limit (250 mg/L) prescribed by WHO. The chloride concentration varies between 30.1 to 319.5 mg/L with a mean value of 69.94. From the results, it is observed that most of the samples from study area are within the standard desirable limit prescribed by WHO. Nitrates are the end product of aerobic stabilization of organic nitrogen and a product of conversion of nitrogenous material, and as such occur in polluted water. The nitrate concentration of groundwater samples range from 10 to 212 mg/L with an average value of 84.87 mg/L. The desirable limit of nitrate for drinking water is specified as 50 mg/L; nearly 66% of the
samples from the study area exceed the desirable limit. High concentration of nitrate in water has resulted in death of infants by “methamoglobanemia” or blue baby disease and gastric carcinomas.
Selected trace metals Fe and Zn were studied in
groundwater samples of the study area. The
concentration of Fe in all of the groundwater samples is
below than the standard of 0.3 mg/L (Table 1). Zinc
concentration varied from 0.09 to 1.88 mg/L with a mean value of 0.798 mg/L. It is observed that Zn in groundwater samples is within the standard desirable limit.
Q-mode cluster analysis
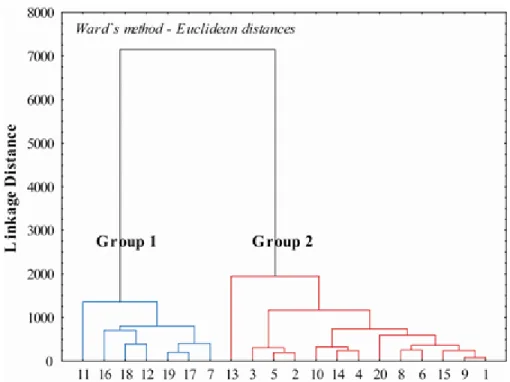
In the present study, Q-mode cluster analysis was performed on the water chemistry data to group the samples in terms of water quality (Chandrasekhram et al., 2001; Grande et al., 2003). The Ward’s method was applied and Euclidean distance was chosen as a measure of similarity.
The output of the Q-mode cluster analysis is given as a dendrogram in Figure 2. There are two major groups as shown in Figure 2 and Table 2.
Group 1 includes: 7, 11, 12, 16, 17, 18, 19, where the EC ranged from 540 to 2,120 µS/cm which is the characteristic of brackish water. This water is basically bicarbonate and chloride dominated, however; Mg and Na are also present. The samples of this water type are found in the south-western part of the study area (Figure 1). The electrical conductivity is correlated with the Na, Cl and NO3 (Table 3).
Group 2 includes the samples: 1, 2, 3, 4, 5, 6, 8, 9, 10, 13, 14, 15, 20 where the EC ranged from 1,047 to 3,440 µS/cm, which is the characteristics of moderate saline water. This water is bicarbonate and sodium dominated
Figure 2. Dendogram of Q-mode cluster analysis.
Table 2. Parameter values of the two principal water groups.
Parameter Group 1 Group 2
Min Max Mean SD Cv Min Max Mean SD Cv
T 18 21 19 1 6 16 21 20 1 7 pH 7.27 8.11 7.78 0.31 4.04 6.81 7.73 7.19 0.29 4.09 EC 540 2120 1268 601 47 1047 3440 2101 623 30 Ca 70.00 172.00 106.86 32.24 30.17 90.00 292.00 162.31 65.65 40.45 Mg 66.20 244.00 134.74 74.46 55.26 71.40 340.00 255.49 73.91 28.93 Na 17.80 139.64 60.91 45.17 74.16 33.40 282.95 131.87 71.46 54.19 K 0.84 24.92 6.42 8.88 138.33 1.25 22.73 5.58 5.42 97.09 Cl 35.50 319.50 111.92 111.96 100.04 30.10 95.14 47.33 17.11 36.16 SO4 101.00 730.00 303.14 220.57 72.76 166 695 476 142.41 29.92 HCO3 1586 2903.6 2405.34 420.41 17.48 3172 4758 3642.31 409.99 11.26 NO3 12.65 94.50 33.14 27.90 84.19 13.46 170.52 57.27 44.08 76.97 Fe 0.001 0.045 0.018 0.017 97.005 0.001 0.048 0.018 0.014 78.140 Zn 0.110 1.766 0.552 0.591 107.171 0.090 1.880 0.930 0.512 55.046
but also contains low concentrations of nitrate and potassium. This water type is found in the north-east part of the study area (Figure 1). The electrical conductivity is strong correlation with the sodium and nitrate(Table 3).
R-mode factor analysis
The kind of factor analysis used for this study was the Principal Components Analysis (Davis, 1986; Harman, 1967) with the application of varimax factor rotation
(Kaiser, 1958). The first three factors were chosen since they account for 68.15 % (Table 4) of the total variance, and based on the ‘‘scree test’’ where values for all these factors are greater than one (Davis, 1986).
The first factor explains 35.19 % of the total variance, and shows that most of the covariance in the system’s properties may be accounted for by the variances of Mg, Cl, SO4 and Zn. This factor proves that hydrochemical
reactions relating precipitation/dissolution processes with dolomite, halite and gypsum minerals are important in water quality evolution in this area.
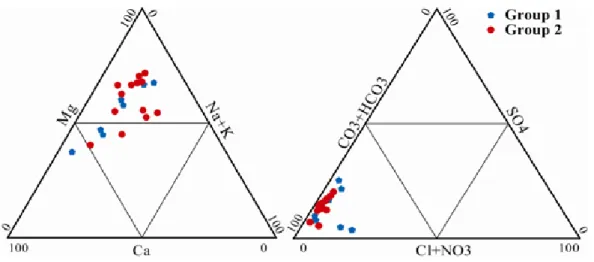
Figure 3. Ca-Mg-(Na+K) and HCO
3-SO4-Cl-NO3 trilinear diagrams for groundwater samples.
Table 3. Correlation matrix for groundwater samples in the study area.
T pH EC Ca Mg Na K Cl SO4 HCO3 NO3 Fe Zn Group 1 T 1 pH -0.49 1 EC 0.31 -0.71 1 Ca -0.75 -0.13 -0.03 1 Mg 0.54 -0.17 0.34 -0.66 1 Na 0.72 -0.33 0.51 -0.73 0.95 1 K -0.25 0.44 -0.50 -0.07 0.16 -0.11 1 Cl -0.37 -0.25 0.50 0.60 -0.53 -0.41 -0.40 1 SO4 -0.08 0.35 -0.22 -0.33 0.57 0.32 0.86 -0.55 1 HCO3 0.06 -0.09 -0.28 0.17 -0.53 -0.51 0.36 0.19 -0.08 1 NO3 0.09 -0.21 0.55 0.04 -0.33 -0.12 -0.44 0.81 -0.52 0.29 1 Fe -0.13 0.35 -0.06 -0.07 -0.15 -0.20 0.46 0.38 0.22 0.53 0.52 1 Zn 0.72 -0.48 0.48 -0.64 0.90 0.93 0.09 -0.47 0.45 -0.28 -0.21 -0.22 1 Group 2 T 1 pH -0.20 1 EC 0.30 -0.30 1 Ca -0.25 0.00 0.26 1 Mg -0.05 -0.55 0.07 0.11 1 Na 0.23 -0.57 0.78 0.26 0.37 1 K -0.32 0.42 0.00 0.26 0.25 -0.13 1 Cl 0.27 0.72 0.00 -0.11 -0.58 -0.48 0.12 1 SO4 0.07 -0.70 0.14 0.00 0.37 0.51 -0.37 -0.71 1 HCO3 -0.23 0.11 -0.10 0.34 0.43 -0.17 0.81 0.04 -0.33 1 NO3 0.29 -0.50 0.86 0.04 0.13 0.68 -0.24 -0.05 0.17 -0.21 1 Fe 0.08 -0.30 0.12 0.37 0.25 0.38 0.05 -0.50 0.36 0.21 -0.17 1 Zn 0.15 -0.22 -0.37 -0.20 0.28 -0.18 -0.07 -0.38 0.35 -0.09 -0.31 -0.03 1
The second factor, which accounts for 17.51% of the total variance, is characterized by high-negative loadings of the K and positive loadings of Na and NO3 and
represents the contribution of agricultural activities and ion exchange.
Table 4. Varimax factor score matrix. Variable F1 F2 F3 Ca 0.03 0.23 0.72 Mg 0.82 0.25 0.27 Na 0.54 0.68 0.27 K 0.18 -0.63 0.51 Cl -0.83 0.11 -0.01 SO4 0.77 0.03 0.26 HCO3 0.38 0.10 0.66 NO3 -0.04 0.88 0.17 Fe -0.07 -0.07 0.68 Zn 0.79 -0.06 -0.22 Eigenvalue 3.52 1.75 1.54 % Total variance 35.19 17.51 15.45 Cumulative Eigenvalue 3.52 5.27 6.81 Cumulative % 35.19 52.70 68.15
on Ca, HCO3 and Fe, derived from the weathering of
carbonate minerals from the underlying geology.
CONCLUSION
In this case study, different multivariate statistical techniques were used to evaluate spatial variations in groundwater quality of the Soummam Basin. Three major water types are suggested by the Q-mode cluster analysis: group 1 (35%) belongs to Mg-Na-HCO3-Cl
facies and group 2 (65%) belongs to Na-Mg-HCO3-SO4
facies. The three principal factors identified by R-mode factor analysis correspond to three principal processes taking place in the study area: precipitation/dissolution processes of dolomite, halite and gypsum minerals, cation exchange processes occurring in clay layers, and agricultural activities. The results of this study clearly demonstrate the usefulness of multivariate statistical analysis in hydrochemical.
REFERENCES
Anazawa K, Ohmori H (2005). The hydrochemistry of surface waters in Andesitic Volcanic area, Norikura volcano, central Japan. Chemosphere. 59:605-615.
APHA-AWWA-WPCF (1995a). Standard methods for the examination of water and waste water (19th ed.). New York, USA.
APHA (1989). Standard methods for examination of water and wastewater, 17th edn. DC: American Public Health Association, Washington.
APHA (1995b). Standard methods for the examination of water and wastewater, 19th edn. DC: American public Health Association, Washington.
Appelo CA, Postma D (1993). Geochemistry, groundwater and pollution. Balkema, Rotterdam.
Belkhiri L, Boudoukha A, Mouni L, Baouz T (2010). Application of multivariate statistical methods and inverse geochemical modeling for characterization of groundwater - A case study: Ain Azel plain (Algeria). Geoderma. 159: 390-398.
Brown CE (1998). Applied Multivariate Statistics in Geohydrology and
Related Sciences. Springer, New York.
Johnson CC (1979). Land application of water-an accident waiting to
happen. Groundwater. 17(1):69-72.
Chandrasekhram JKD, Burner DSZ, Stueben D (2001). Arsenic contamination in groundwater, Murshidabad district, West Bengal. In: Manjunath, S. (Ed.), Proceedings of Water-Rock Interaction, Vol. 10. A.A. Balkema Publishers, Leiden, The Netherlands.
Clesceri LS, Greenberg AE,Eaton AD (1998). Standard methods for the examination of water and wastewater, 20th edn. American Public Health Association, American Water Works Association, Water Environment Federation, Washington.
Davis JC (1986). Statistics and data analysis in geology. New York: Wiley, p. 647.
Domenico PA, Schwartz FW (1990). Physical and chemical hydrology. Wiley, New York.
Anazawa K, Ohmori H (2005). The hydrochemistry of surface waters in Andesitic Volcanic area, Norikura volcano, central Japan. Chemosphere. 59:605-615.
Drever JI (1988). The geochemistry of natural waters. 2nd edn. Prentice-Hall, New York.
Grande JA, Borrego J, Torre MLD, Sainz A (2003). Application of cluster analysis to the geochemistry zonation of the estuary waters in the tinto and odiel rivers (Huelva, Spain). Environmental Geochemistry and Health. 25: 233-246.
Harman HH (1967). Modern factor analysis. Chicago: University of Chicago Press.
Helena B, Pardo R, Vega M, Barrado E, Fernandez JM, Fernandez L (2000). Temporal evolution of groundwater composition in an alluvial (Pisuerga river, Spain) by principal component analysis. Water Res. 34:807-816.
Hem JD (1991). Study and interpretation of the chemical characteristics of natural waters, Book 2254, 3rd edn. Scientific Publishers, Jodhpur. Holden WS (1971). Water treatment and examination. Churchill,
London.
ISI (1983). Indian standard specification for drinking water. IS: 10500, Indian Standard Institute, India.
Jayakumar R, Siraz L (1997). Factor analysis in hydro geochemistry of coastal aquifers – a preliminary study. Environ. Geochem. 31(3/4):174-177.
Kaiser HF (1958). The varimax criterion for analytic rotation in factor analysis. Psyhometrica. 23:187-200.
Karanth KR (1997). Groundwater assessment, development and management. Tata McGraw-Hill, New Delhi.
Liu CW, Lin KH, Kuo YM (2003). Application of factor analysis in the assessment of groundwater quality in a blackfoot disease area in Taiwan. The Sci. Total Environ. 313:77-89.
(1988). Chemometrices: A Textbook. Elsevier, Amsterdam.
Mouni L (2004). Etude et caractérisation physico-chimique des rejets dans l’oued Soummam. Mémoire de magister, Univ Béjaia, Algérie. Perrier (1964). Défense contre les eaux nuisibles de l’oued Soummam,
mémoire préliminaire, Paris 8ème.
Raghunath R, Murthy TRS, Raghavan BR (2002). The utility of multivariate statistical techniques in hydrogeochemical studies: an example from Karnataka, India. Water Res. 36:2437-2442.
Reisenhofer E, Adami G, Barbieri P (1998). Using chemical and physical parameters to define the quality of karstic fresh waters (Timavo River, North-eastern Italy): a chemometric approach. Water Res. 32:1193-1203.
Rowell D J (1994). Soil science: Methods and applications. UK: Longman Scientific and Technical.
Simeonova P, Simeonov V, Andreev G (2003). Analysis of the struma river water quality. Central Eur. J. Chem. 2:121-126.
Simeonov V, Stratis JA, Samara C, Zachariadis G, Voutsa D, Anthemidis A, Sofoniou M, Kouimtzis Th (2003). Assessment of the surface water quality in Northern Greece. Water Research. 37:4119-4124.
Simeonov V, Simeonova P, Tsitouridou R (2004). Chemometric quality assessment of surface waters two case studies. Chem. Eng. Ecol. 11(6):449-469.
Singh KP, Malik A, Mohan D, Sinha S (2004). Multivariate statistical techniques for the evaluation of spatial and temporal variations in water quality of Gomti River (India) - a case study. Water Res. 38:3980-3992.
Stumm W, Morgan JJ (1981). Aquatic chemistry, 2nd edn. Wiley, New York.
Thorne DW, Peterson HB (1954). Irrigated soils. Constable and Company, London.
Todd DK (1980). Groundwater hydrology. Wiley, New York.
US Salinity Laboratory Staff (1954). Diagnosis and improvement of saline and alkali soils. US Department of Agricultural soils. US Department of Agricultural Hand Book 60, Washington.
Vega M, Pardo R, Barrado E, Deban L (1998). Assessment of seasonal and polluting effects on the quality of river water by exploratory data analysis. Water Res. 32:3581-3592.
Voncina DB, Dobcnik D, Novic M, Zupan J (2002). Chemometric characterisation of the quality of river water. Analytica Chimica Acta. 462:87-100.
Walton WC (1970). Groundwater resources evaluation. McGraw-Hill, New York.
WHO (1984). Guidelines for Drinking Water Quality. World Health Organization, Geneva.
WHO (2006). Guidelines for DrinkingWater Quality, third ed., vol.1 -Recommendations. Word Health Organization, Geneva.
Wilcox LV (1948). The quality of water for irrigation use. US Department of Agricultural Technical Bulletin 1962, Washington. Zaporozec A (1972). Graphical interpretation of water quality data.
Groundwater. 10(2):32-43.
NOTE:
Kindly provide where figure 3 is cited in the text Also provide where the reference colored red is cited in the text or it will be deleted.