HAL Id: ird-01616256
https://hal.ird.fr/ird-01616256
Submitted on 13 Oct 2017
HAL is a multi-disciplinary open access archive for the deposit and dissemination of sci-entific research documents, whether they are pub-lished or not. The documents may come from teaching and research institutions in France or abroad, or from public or private research centers.
L’archive ouverte pluridisciplinaire HAL, est destinée au dépôt et à la diffusion de documents scientifiques de niveau recherche, publiés ou non, émanant des établissements d’enseignement et de recherche français ou étrangers, des laboratoires publics ou privés.
research project: Catch, Effort, and eCOsystem impacts
of FAD-fishing (CECOFAD)
Daniel Gaertner, S. Clermidy, J Ariz, N Bez, G Moreno, H Murua, M Soto, F
Marsac
To cite this version:
Daniel Gaertner, S. Clermidy, J Ariz, N Bez, G Moreno, et al.. Results achieved within the framework of the EU research project: Catch, Effort, and eCOsystem impacts of FAD-fishing (CECOFAD). Acta Agriculturae Slovenica, De Gruyter Open, 2016, IOTC–2016–WPTT18–35. �ird-01616256�
1 18th Working Party on Tropical Tunas (IOTC) Results achieved within the framework of the EU research project: Catch, Effort, and
eCOsystem impacts of FAD-fishing (CECOFAD)
Gaertner D1, Ariz J2, Bez N1, Clermidy S1, Moreno G3, Murua H4, Soto M5 , Marsac F1* Abstract
The European Research project “Catch, Effort, and eCOsystem impacts of FAD-fishing” (CECOFAD) set out to improve our understanding of the use of drifting fish-aggregating devices (DFADs) in tropical purse seine tuna fisheries in open ocean ecosystems. Data from unofficial technology information related to FAD-fishing were retrieved and the changes over time in systems used for positioning buoys at-sea (radio, satellite transmitters, echo sounder buoys) were quantified. The total number of DFADs deployed at sea in the Atlantic and Indian oceans over the last ten years was estimated from 2 different approaches, based on information provided by the French tuna association and extrapolated to the other purse seiner fleets. From data collected within the FAD National Management Plan, the relationship between the number of active DFADs and the catch per Spanish purse seiner (with or without the assistance of a supply vessel), was explored.
Owing to the difficulty of gathering unofficial information, the standardization of CPUE was limited to juvenile bigeye caught using DFADs and to non-standard explanatory variables provided by the French fleet. The analysis was repeated for the combined French and Spanish fleets but with a smaller number of predictors because data for the Spanish fleet was missing. However the relevance of some non-traditional factors was highlighted, in particular the needs to collate the links between each supply vessel and its associated purse seiners and the number of active DFADs per vessel. As an alternative to CPUE, direct indices of tuna abundance through the use of echo sounder buoys attached to DFADs in the Spanish fleet were investigated. Due to the heterogeneity of echo sounder buoy information several criteria for cleaning datasets before performing an “alternate” Buoy-derived Abundance Index (BAI) were identified. Nominal measurements were then standardized using a GLMM approach. Behavioral models representing the continuous process of association and disassociation under FADs, were also identified as an alternative to commercial catch data for estimating abundance.
Information collected by national FAD management plans was used to explore the rate of deployment of non-entangling DFADs and the apparent survival rate of released species of incidental catch. Time-area moratoria on DFADs, introduced regularly by tuna RFMOs, are limited to the protection of juvenile tuna and do not account for the potential impact on bycatch or associated megafauna (whales and whale sharks). A simple iterative “fishing-day” model, which included realistic scenarios in terms of difference in fishing strategies between the French and Spanish fleets,
1
Institut de Recherche pour le Développement (IRD), UMR EME, CRH, BP 171, 911 avenue J. Monnet, 34203 Sète Cédex (France)
2
Instituto Español de Oceanografía (IEO). Centro Oceanográfico de Canarias. Apdo. de Correos 1373. 38080 Santa Cruz de Tenerife, Islas Canarias (Spain).
3
AZTI -Tecnalia Herrera Kaia, Portualde z/g 20100 Pasaia Basque Country (Spain); now at ISSF
4
AZTI -Tecnalia Herrera Kaia, Portualde z/g 20100 Pasaia Basque Country (Spain)
5
Instituto Español de Oceanografía (IEO). Corazón de María 8. 28002 Madrid (Spain).
*
CECOFAD has been a collective adventure with the participation of about 30 persons from the 3 EU Research Institutes and the 3 EU Tuna owner associations (Orthongel, AnabaC and OPAGAC).
2 was developed to investigate the consequences on tropical tuna and bycatch of introducing wide area, six-month moratoria on DFAD sets. The simulations predicted a decrease in DFAD sets and an increase in free school sets, leading to an overall decrease in tuna catch of ~100 t/yr/boat in the Atlantic Ocean and 600–1800 t/yr/boat in the Indian Ocean. The bycatch for all groups considered (other bony fishes, billfishes, sharks and turtles) decreased, except for turtle and shark in the Atlantic Ocean. Because the fishing practices were modified, whale and whale shark associated sets increased slightly in the Indian Ocean. French GPS buoy trajectories were analyzed to detect the potential damage of lost DFADs on vulnerable coastal ecosystems. This showed that, for the period 2007-2013, around 10% of the trajectories of floating objects with GPS-buoys ended with a “beaching event” in the Atlantic and Indian Oceans, with significant portions of these beaching events occurring in areas with sensitive habitats, such as coral reefs. Bycatch data collected under the EU observer programs in the Indian, Pacific and the Atlantic Oceans, was used to evaluate the effect of FAD-fishing in terms of diversity. Regional differences were identified but the species diversity associated with the DFADs was found to be richer than for free school sets.
One of the tasks of CECOFAD was to provide bridges between the various databases used in the project. The French versions of the Balbaya (logbooks) and ObsTuna (observer data) databases were linked using the Standard Data-Exchange Format used within the EU Data Collection Framework (DCF). This format allows a data aggregation level while respecting data confidentiality issues and should be considered as a good candidate for the exchange of data within the tropical tuna research community. Owing to the lack or imprecision of DFAD-fishing activity data, the definitions of variables required for evaluating DFAD-fishing activities that should be continuously recorded in logbooks were reviewed. On the basis on the most recent recommendations from tRFMOs the electronic fishing logbook data model (ERS) was extended to floating objects with the aim to incorporate the information required for measuring the DFAD-fishing effort and to produce indicators of the effect on the ecosystem of deploying floating objects. These extensions now include a new classification of floating objects and a detailed list of operations (including buoy activity) to be filled in by the skipper.
1. Introduction
The objectives of the EU CECOFAD project were: (1) to provide insights into the definition of the fishing effort associated with drifting fishing aggregating devices (DFADs) that accounts for the implementation of new technology influencing catchability, (2) to introduce the factors describing the technology associated with this fishing mode into the standardization of the European tropical tuna purse seiner catch-per-unit-of-effort (CPUE) and (3) to provide information on catch composition around FADs and estimate the impacts on other components of marine fauna (e.g. bycatch of sharks, rays and turtles).
To achieve these objectives, CECOFAD was organized into 4 Work Packages (WPs), as follows:
WP 1- Definition of a unit of fishing effort for purse-seiners using DFADs that accounts for different factors influencing catchability,
WP 2- Standardization of catch-per-unit-effort series of the EU purse seine fleet, for juveniles and adults of the three tropical tuna species and exploration of some FAD-regulations in management strategies,
WP 3- Alternatives to CPUE,
WP 4- Catch composition around FADs and estimation of potential effects on other components of marine fauna.
3 Right from the start of CECOFAD it was clear that cross-cutting activities were required in addition to the four Work Packages to coordinate the technical aspects of the project. Given the importance of data management (definitions of variables, minimum data requirement and links between the various databases) these activities were grouped into a separate work package, WP5.
Because science-industry partnerships can improve the quality and availability of data and knowledge, the project research has fostered collaborative research between operators and scientists, without compromising the independence of the latter. CECOFAD is co-funded by EU-DG Mare, 3 scientific institutes (IRD, IEO and AZTI) and 3 associations of professional tuna companies (ANABAC, OPAGAC and ORTHONGEL). In order to bring the objectives and achievements of the project to the notice of a wide audience, a website (http://www.cecofad.eu/) was developed right from the start of CECOFAD (January 2014). The website will be maintained for 2 years after the completion of the project (December 2015).
2. Main results by working package
2.1. WP1: Definition of a unit of fishing effort for purse-seiners using DFADs that takes into account various factors affecting catchability
Until recently, the fishing effort for purse seine fisheries, dominated by sets on free-swimming schools (FSCs) and natural floating objects (“logs”), has been expressed as the daylight hours spent looking for visual cues of tuna schools minus the time taken for the set (i.e., the searching time). However, the increase in fishing efficiency due to new technologies that have been introduced (Gaertner and Pallares, 1998, Torres et al, 2014) and the use of drifting artificial fish aggregating devices (DFADs) since the early 1990s (Ariz et al, 1999; Hallier and Parajua, 1999) have broken the link between searching time and effective fishing effort for DFAD sets (Fonteneau et al, 1999). Remote detection of satellite-tracked dDFADs often allows purse seiners to move directly towards a buoy, sometimes at night, avoiding or significantly reducing searching time. In addition, the recent development of satellite-tracked echo sounder / fish finder units attached to floating objects (Moreno et al, 2007; Lopez et al, 2014) gives purse seiners real-time information about fish schools aggregating around DFADs and has resulted in an increasing proportion of successful DFAD sets. The use of supply vessels, which can visit DFADs and inform purse seiners on the fish aggregations around these DFADs, also contributes to the efficiency of some purse seiners (Arrizabalaga et al, 2001). In addition to conventional data (logbooks, observer on boad, national FAD management plans), the tasks developed within the WP1 used various types of unofficial data, including: annual orders for various types of buoys, quarterly reports of buoy activation / deactivation and GPS buoy tracks, all of them for the French purse seiners, VMS for the French fleet and partially for Spain, as well as various surveys of French and Spanish fishermen.
Overview of skippers’ perception of the changes in efficiency due to the new technologies
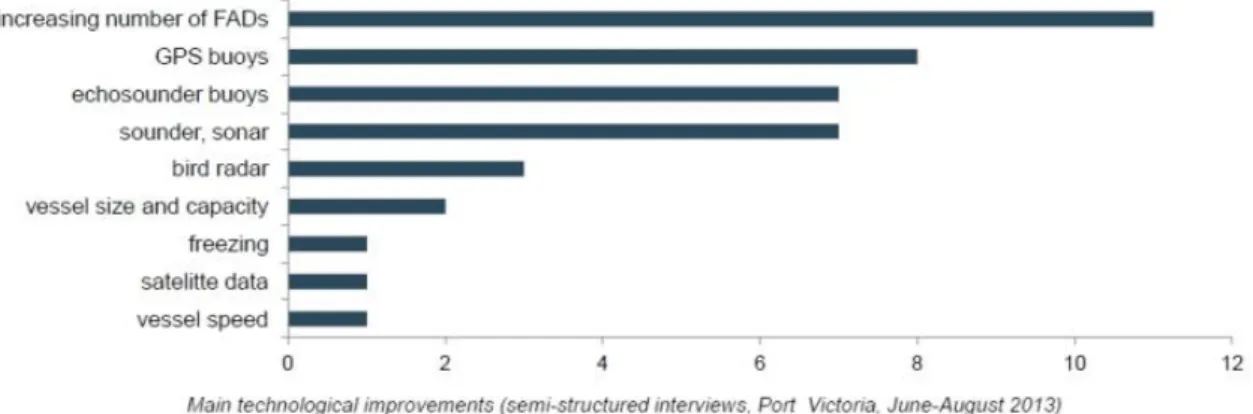
Various surveys were conducted to determine how tuna purse seiner skippers perceived the implementation of the new onboard technologies and the related benefits in terms of fishing efficiency. French and Spanish purse seine skippers operating in the Indian Ocean were questioned to determine their strategies regarding DFAD deployment, monitoring and fishing and their perception of the effect of the use of DFADs on their efficiency, in comparison with the use of other new fishing technologies (Fig. 1). An independent survey conducted during an International Seafood Sustainability Foundation (ISSF) skipper workshops with skippers from the Spanish and associated fleets operating mainly in the Pacific Ocean were questioned on more than 100 aspects of the
4 technology onboard (Fig. 2). From both studies it was showed that most important factors in improving the fishing efficiency were the use of DFADs, specifically the total number of available DFADs at sea, GPS buoys, echo sounders buoys, and electronic equipment onboard. It should be stressed that the age of the vessel was not considered to play a major role in increasing fishing efficiency. This likely due to the fact that vessels tend to be repaired, maintained or checked every one or two years, which makes them highly dependent on the performance of the mechanical and electronic equipment onboard rather than their age.
Changes in fishing technology related to DFAD fishing
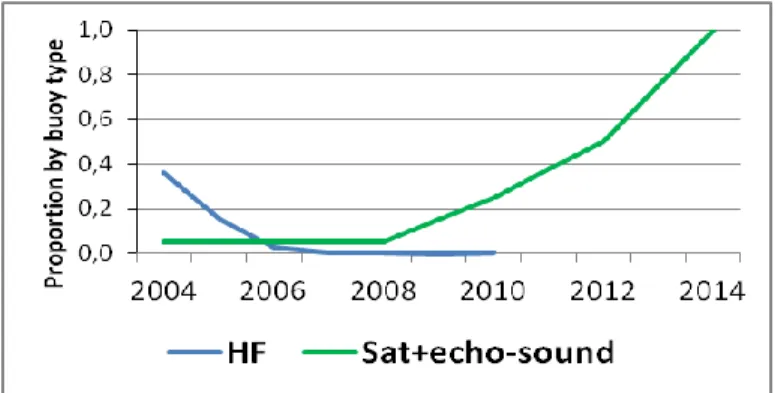
As already stated, various studies have described the introduction of new onboard technology for tuna purse seiners. However, this information was only qualitative. One of the main achievements of CECOFAD was to estimate the changes in the proportion of the various systems used for locating buoys at-sea by the French purse seiners in the Atlantic and Indian oceans, from HF radio / GPS to GPS / echo sounder buoys. A detailed description of these technological changes in locating systems is shown in Figure 3 the Indian Ocean. The type of buoy used by French fishing companies changed on average every 2 years during the period 2002-2014, with one main model generally predominating each year. A similar pattern over time was observed for the French fleet operating in the Atlantic Ocean (Fig. 4). Unfortunately this type of information was not available for the Spanish fleet and only guesstimates are available from past studies (Fig. 5).
Another important aspect is the direct effect of the number of buoys deployed at sea on the total tuna catch per vessel. For the first time the relationship between the number of active DFADs and the catch per Spanish purse seiner (with or without the assistance of a supply vessel), per ocean and per quarter was explored in the Atlantic and Indian oceans. In spite a large variability, a positive effect of the number of DFADs on catch can be seen in both oceans (Fig. 6). The size category of the purse seiner was also taken into account. On average, having a supply vessel allowed purse seiners to have more DFADs although some vessels seeded a relatively low number of DFADs. Other factors, not accounted for in this preliminary analysis, could explain the high variability observed in this figure, e.g., the type of echo sounder buoy, whether or not purse seiners from the same company shared all the buoys, the proportion of buoys stolen (this might be larger for purse seiners without supply vessels and it was suggested that the supply vessels might reduce theft).
Estimated number of DFADs and buoys at sea
Since the mid 1990s, the use of DFADs has increased considerably in tropical tuna purse seine fisheries. Furthermore, since the 2000s, purse seiners have been able to monitor both natural floating objects and DFADs with GPS buoys while they are drifting. This extensive use of DFADs and GPS buoys raises several concerns for tropical tuna stock assessment and management. It is particularly difficult to know how many DFADs and GPS buoys are in use, how is the spatial strategy to deploy new DFADs and GPS buoys and the proportion of the fishing effort spent on setting on DFADs and logs or alternatively, on free schools. To address the question of how many DFADs and GPS buoy tracked objects are currently drifting in the Atlantic and the Indian Ocean, various complementary sources of information derived from declarations and observations at-sea were used. One source of unofficial data was based on historical purchase orders for buoys and declarations of activities related to DFAD activities by the French purse seiner fleet.
For the Atlantic Ocean, the number of buoys purchased and the quarterly information on the activation/deactivation provided by the satellite communications operators were used to estimate that each French vessel purchased an average of 156 buoys in 2013, 90 of which were active (Goujon
5 et al, 2015). It should be noted that French tuna-boat owners association limited the number of buoys purchased each year by each purse seiner to 200 and the number of active buoys to 150. For the Indian Ocean, Chassot et al, (2014) combined 3 three data sources to describe the use of DFADs and buoys by French purse seiners over the period 2002-2014: (1) records of buoy purchase orders provided by fishing companies, (2) satellite transmission metadata based on the quarterly reports produced by buoy supplier companies for each vessel, and (3) activities related to DFADs and buoys included in purse seiner logbooks from 2013 onwards. However, in order to use data that was comparable with that available for the Atlantic Ocean, only purchase order data was used. The number of buoys available for French purse seiners operating in the Indian Ocean increased by an average rate of about 10 per year over the period with the average number of buoys available per vessel increasing from 60 in 2002 to 200 in 2014 (Fig. 7). It must be noted however that the number of active buoys per French purse seiner at the start of each quarter, as well as the average number of buoys that emitted a signal during each quarter, remained stable over the period 2010-2013 with the overall average number of buoys per French purse seiner being 89 (close to the estimate provided for the Atlantic Ocean). It should be stressed that, at the same time, there was an increase in the number of activations/deactivations, suggesting that the buoy utilization was a dynamic process to ensure the renewal of the DFAD standing stock for each vessel.
Data on the number of active buoys used by the Spanish purse seiners operating in the Atlantic and Indian oceans were collected within the framework of the Spanish DFAD management plan in 2013. This showed the considerable variability in the number of buoys used by purse seiners, which can exceed 1000 buoys per purse seiner (Fig. 8). For the Spanish fleet operating in the Atlantic Ocean, each purse seiner followed an average of 429 active DFADs per year (Delgado et al, 2015). However, as for the French purse seiners, this might give an overestimate of the total as some active DFADs were followed by more than one vessel and, might, therefore, be double counted. On average, 401 active DFADs were followed by each Spanish purse seiner operating in the Indian Ocean (Delgado et al, 2014). The average number of DFADs deployed by Spanish flag vessels was around 854 per year, if only purse seiners are considered (i.e., excluding support vessels).
The total number of DFADs deployed at sea in the Atlantic and Indian oceans over the last ten years was estimated from 2 different approaches, based on information provided by the French tuna association and extrapolated to the other purse seiner fleets.
The first approach was based on the number of active DFADs per vessel provided by the French tuna association, the catch per DFAD set and the total catch on DFADs for the various purse seiner fleets (Table 1). In the absence of data for the Spanish fleet at the time of the analysis, it was assumed that annual DFAD catches per vessel for the period 2004-2013 were proportional to the number of DFADs. The number of DFADs seeded by each Spanish purse seiner was estimated at an average of 2.5 times greater than for the average French purse seiner (as opposed to three times greater in previous studies). This method estimated the average number of DFADs for each Spanish purse seiner in 2013 at 385 DFADs, which is close to the number of 426 active DFADs seeded for each Spanish purse seiner estimated by Delgado et al (2015). No data was submitted to the ICCAT on the number of DFADs or buoys used by non-European fleets of purse seiners (Ghana, Cote d’Ivoire and Guinea). However, assuming that the average annual catch for each seeded DFAD was identical to the average annual DFAD catch for each buoy of the French and Spanish fleets, the number of DFADs seeded by these fleets was estimated from their total catches using DFADs. Based on these data and assumptions, the estimated total number of DFAD sets per year in the Atlantic Ocean by all purse seine fleets increased significantly from less than 7,000 DFADs before 2008, to 17,300 DFADs in 2013 (Fig. 9Figure ). This corresponds to a 2.6 fold increase between the period 2004-2007 and 2010-2013.
6 For the Indian Ocean, the French DFAD database was extrapolated to give the total number of DFADS active in the Indian Ocean using the method described above for the Atlantic Ocean. Based on 2 assumptions (i.e., assuming each Spanish purse seiner could seed either 1.7 (RF1) more DFADs than a French purse seiner, or 3 (RF2) time more) the number of Spanish and Seychelles DFADs deployed per vessel and in total was tentatively estimated (Fig. 10).
The second approach combined 4 different sources of data to evaluate the total number of DFADs and total number of buoys at sea: (1) GPS buoy tracks of the DFADs and logs followed by the French fleet, (2) quarterly French fishing company orders for buoys, (see Fig. 11 for the French fleet estimates only) (3) interviews of purse seine skippers and (4) observations of DFADs and logs by observers onboard French and Spanish purse seiner fleets. The proportion of buoys used on DFADs or logs as well as the proportion of French and foreign GPS buoys were estimated as shown in Figure g 12.
After extrapolation to give the total number of DFADs and GPS buoys used by all purse seine fleets operating in the Atlantic and Indian oceans, the total number of DFADs used per day increased from 1,175 in January 2007 to 8,575 in August 2013 in the Atlantic Ocean and from 2,250 DFADs in October 2007 to 10,300 DFADs in September 2013 in the Indian Ocean (Fig. 13).
Activities at sea and fishing strategies adopted by the EU tuna purse seine fishery
Data collected within the framework of the Spanish and French FAD National Management Plans were used to determine the proportion of time spent on the various activities carried out when using DFADs (deployment, visits, retrieval, changing buoys). As supply vessels provided valuable assistance, the activities of the Spanish purse seiners were compared in the Atlantic and Indian oceans with and without the support of a supply vessel (Fig. 14). The proportion of time spent on each activity appeared to be specific to each ocean but in both cases, on average, the assistance of a supply vessel increased the amount of time spent on sets by 3-4 percentage points (estimate likely underestimated due to potential misinterpretation of the terminology used to collect this type of information). As expected, deploying DFADs was the main role of Spanish supply vessels in the Atlantic and in the Indian oceans.
The activity pattern at-sea was also obtained from the French DFAD management plan but the lack of a common definition for each activity makes it difficult to compare the French and Spanish purse seiner fleets. Despite these limitations, it was observed that 63% of the activities of a French purse seiner were related to DFADs deployed by the same vessel against 36% for DFADs that had been deployed by other vessels and only 1% for DFADs without a radio beacon. The situation was different for logs of which 38% had been fitted with beacons by the same vessel and only 4% had been fitted with beacons by another vessel. 58% of the logs found at sea did not have beacons. Furthermore, whereas 8% of the visits to a DFAD did not result in a set, only 3% of the logs encountered did not result in a set (Goujon et al, 2014).
According to Spanish purse seiners, it was essential to have a good seeding strategy to increase fishing efficiency. The most common strategy was to alternate conventional buoys and echo sounder buoys during the seeding operation (Lopez et al, 2015). Nevertheless, these practices may change as today 100% of the buoys are equipped with echo sounders (Fig. 4 and 5). The seeding strategy was based on zones for each season but was strongly affected by the number of DFADs deployed by other vessels DFAD that were encountered during fishing trips, the potential poaching rate within an area, the probability of finding free schools in the fishing zone, the financial resources of the fleet owner and/or the number of DFADs deployed by vessels of the same company, which sometimes shared
7 fishing strategy and DFADs. The practice of sharing DFADs between vessels of the same company to reduce costs and increase the fishing rate varied between countries and ocean (this practice was more common in the Pacific Ocean where vessels must travel significant distances to reach the fishing areas (Fig. 15).
From the analysis of the trajectories of the French drifting DFADs and the time spent at sea it was showed that on average, DFADs have a far longer time at sea in the Atlantic than in the Indian Ocean (Fig. 16). During CECOFAD it was also showed that the time and distance between consecutive DFAD deployments were generally shorter for the Spanish fleet than for the French fleet (Table 2).
2.2 WP2 Standardization of catch-per-unit-effort series of the EU purse seine fleet, for juveniles and adults of the three tropical tuna species and exploration of some FAD-regulations in management strategies6.
Reliable estimates of the catch per unit effort (CPUE) should consider the effective fishing effort, i.e. the amount of effort effectively deployed at sea to achieve the corresponding catch. The effective fishing effort is never measured in practice and must be estimated. In particular, there is no reliable abundance indicator for drifting artificial fish aggregating devices (DFADs) used by the tuna purse seine fishery. Application of statistics and numerical techniques have allowed fisheries scientists to develop models for standardizing CPUE that allow for the structure of fishery data, such as dependencies and missing values. Mixed models were developed for standardizing CPUE as they have been shown to deal with hyperstability and temporal autocorrelation issues (Nishida & Chen, 2004; Cao et al., 2011). These models were extended to include factors relating to the longitudinal structure of the data, at the levels of vessels and skippers (Maunder & Punt, 2004; Campbell, 2015). Based on the conclusions of the U.E. Research Project ESTHER (Gaertner and Pallares, 1998), for a better understanding on the specific impact of the new technologies introduced on board, the CPUE can be decomposed into several sub-indices (Chassot et al, 2012; Katara and Gaertner, 2014). Delta-lognormal models were developed for the standardization of the DFAD CPUE with the aim to separate (1) the probability of presence of bigeye tuna in the set and (2) the size of the catch where there was a positive set. Owing to the difficulty of gathering unofficial information, the standardization of CPUE was limited to juvenile bigeye caught using DFADs and to non-standard explanatory variables provided by the French fleet. Various conventional and unofficial candidate predictors were tentatively introduced in the standardization process (Table 3). For this reason, Lasso models were used to select the variables rather than standard variable selection methods, as there was a large number of initial variables which can lead to over-fitting and computational problems (Tibshirani, 1996, 2011). The GLMs were extended to GLMMs by treating the skipper and the vessel as crossed effects and the year - grid cell interaction as a random effect. Both GLMs and GLMMs were developed and the resulting standardized CPUE time series were compared (Katara et al, 2015). The process for the standardization of the CPUE is shown in figure 17. The analysis was repeated for the combined French and Spanish fleets but with a smaller number of predictors because data for the Spanish fleet was missing (Table 4). However the relevance of some non-traditional factors was highlighted, in particular the need to collate the links existing between each supply vessel and its associated purse seiners and the number of active DFADs per vessel. It was also suggested that a
6 Notice that owing that the effects of certain DFAD regulations included in management strategies
may impact on the whole ecosystem, this study initially scheduled as part of WP2 was transferred to the WP4 section of the document.
8 factor which was non significant in a specific dataset (e.g., the number of DFAD per French vessel right censured to 200) could be significant for a larger dataset (e.g., including Spain for which the number of DFADs per vessel shows large variation, see Fig. 8). Detailed results for the Lasso approach and fitted CPUE can be found in Katara et al (2015).
An attempt was made at the beginning of CECOFAD, based on a publication by Laurec (1977), to incorporate geographical distance into the standardization process. However, the results revealed no spatial organization and did not support the work that was originally planned. Consequently VMS data submitted on a quarterly basis by the French tuna association Orthongel were used to analyze the geographical distribution of DFAD sets in relation to the area covered by the fleet in the Indian Ocean for the period 2000-2012. Results suggest that the fishing power and capturability vary from quarter to quarter (Saulnier, 2014).
WP3- Alternatives to CPUE
Relative abundance indices based on CPUE data are notoriously problematic (Maunder et al., 2006), as catch data is usually biased by fishing effort, coverage and other limiting factors of fishery data. For this reason, one of the major features of the CECOFAD project was the exploration of alternative fishery-independent indices of the abundance of tuna and non-tuna species associated with DFADs. The CECOFAD project aimed to develop new methods for obtaining direct indices of tuna and non-tuna species abundances using (1) echo sounder buoys attached to DFADs and (2) behavioral models, calibrated using tagging data, representing the continuous process of association and disassociation, as well as the residence time under DFADs.
Data cleaning and modeling a Buoy-derived Abundance Index
Estimating the probability and abundance of tuna and non-tuna species directly using the information obtained from echo sounder buoy acoustic biomass data requires gathering, collating and processing a large dataset of heterogeneous echo-sounder buoy information and developing a methodology which considers all the factors for the standardization of the acoustic information. The information from the Spanish tropical tuna purse seine fleet operating in the Atlantic, Pacific and Indian Ocean was collected and loaded into a database for further processing. This database includes data on the major buoy manufacturers: Marine Instrument, Satlink, Zunibal, thus the sampling configuration (number of emitted pings, sampling duration, time of the day in which the acoustic sample is taken, etc.) and the technical specifications of the echo sounder buoys (beam angle, transducer frequency, etc.) depend on the model. This implies different units of measurements and outputs for different models of buoy, making it difficult to compare the raw acoustic samples and estimates of the different models easily (Fig. 18).
The model proposed by Santiago et al (2015) is based in an assumption very similar to the fundamental relationship between CPUE and abundance, where CPUE is considered proportional to the abundance and catchability is the coefficient of proportionality. In our case, the signal from the echo sounder was assumed to be proportional to the abundance of fish.
𝐵𝐴𝐼𝑡 = 𝜑 . 𝐵𝑡
where BAIt is the Buoy-derived Abundance Index, 𝜑 is the coefficient of proportionality, and Bt is the
abundance in time t.
Because the coefficient of proportionality 𝜑 is not constant, nominal measurements of the echo sounder buoy records were standardized using a Generalized Linear Mixed Modeling approach. Due to the significant proportion of records with zero abundance a delta-lognormal distribution (Lo et al.,
9 1992) was used in the model to estimate BAI as the product of: i) the probability of finding tropical tuna in the acoustic observations (proportion of positives) and ii) the mean relative abundance where there was a positive observation.
Apart standard data cleaning carried out to remove outliers (invalid, impossible or extreme values) related to bad geolocation, time, or other factors, several criteria required for cleaning datasets before standardizing an abundance index derived from echo sounder buoy data were identified (Table 5). In addition to the traditional factors (year, month and area) the following parameters should be considered for the standardization of buoy derived abundance indexes: Soak time, Type of buoy, Frequencies at which buoys operate, Units provided by the buoy, Sampled volume, Acoustic filters automatically applied by the buoy, Depth of the acoustic layers, Bearing and speed of DFADs, Density of DFADs, Environmental variables, Species composition beneath DFADs.
Modeling the aggregation process of biomass under DFADs.
Behavioral models representing the continuous process of association and disassociation, as well as the residence time under FADs, were also identified as an alternative to commercial catch data for estimating abundance. However, to date these behavioral models (e.g., Capello et al, 2015) have been used only to assess the proportion of the fish population associated with anchored FADs (AFADs). Because industrial purse seiners do not usually use AFADs, further research is required to determine whether the temporal and spatial dynamics of fish aggregations under DFADs is similar or drastically different to AFADS.
WP4 Catch composition around FADs and estimate of potential effects on other marine organisms
DFAD characteristics, new materials and fishing practices
Characteristics of the DFADs were described based on information collected from skippers within the framework of the Spanish and French DFAD Management Plans:
1. surface structure with nets and bamboos, 2. surface structure with metal or PVC,
3. non-entangling DFADs: with the surface structure of the dFAD o not covered
o only covered by non-meshed materials such as ropes or canvas sheet or
o with netting rolled up and securely tied in "sausages“ with nets of maximum 3 cm 4. natural objects,
5. unknown DFADs,
6. surface structure without net coverage or non-entangling coverage
In the case of the Spanish fleet, despite a large proportion of DFADs with unknown characteristics (approximately one third of the DFADs in the Atlantic and in the Pacific oceans), the decrease in the proportion of non-entangling DFADs used between 2013 and 2014 is due to the increase in DFADs without net coverage or non-entangling coverage. For the French fleet, Goujon et al (2014) reported that the first non-entangling designs were introduced in 2010 in the Indian Ocean and in 2011 in the Atlantic ocean. Since 2012, French purse seiners are authorized to deploy only non-entangling DFADs.
The ecosystem approach to fisheriesaims to reduce by-catch mortality and so discarding practices have been introduced in the EU purse seine fleets. A manual has been drawn up and disseminated to
10 increase the probability of survival for released fish and megafauna (Poisson et al., 2014). Observing good practices continues to be one of the objectives of the EU purse seine fleets as a means of reducing mortality of vulnerable species. For several Spanish vessels operating in the Atlantic Ocean, initial results showed significant improvement in shark release conformity between consecutive fishing trips (Goñi et al, 2015). These results should be validated using scientific observer data to determine any potential bias in skippers’ reports. However, seresults are encouraging in terms of best practices in terms of fauna release operations..
Impacts of lost DFADs
French GPS buoy trajectories were analyzed to detect DFAD beaching events and the potential damage to fragile coastal ecosystems. A beaching event was defined as the same position repeated at least three consecutive times at a remote location from a port (more than 10 km) and close to the coast (less than 5 km). It was showed that for the period 2007-2013, around 10% of the trajectories of floating objects with GPS-buoys ended with a “beaching event” in the Atlantic and Indian Oceans, suggesting that 1500-2000 DFADs may be washed ashore each year, with significant portions of these beaching events occurring in areas that might have sensitive habitats, such as coral reefs. In the Atlantic Ocean, beaching events tend to be concentrated in the Gulf of Guinea but some buoys travel across the ocean and beach on the Brazilian coast (Fig. 19). In addition, observations showed that non-entangling DFADs with ‘sausage nets’ still entangled sea turtles when they beached on coral reefs, acting as a ghost fishing gear.
Exploration of some FAD-regulations in management strategies
It is commonly accepted that fisheries have a direct impact on the whole of the marine ecosystem and, for this reason, the Ecosystem Approach to Fisheries (EAF) is being promoted as a framework for sustainable development, recognizing the interdependence between human well-being and ecosystem health (Garcia et al. 2003). However, although this approach is generally accepted, the types of action needed to set up EAF management plans are not considered as main priorities by the tRFMOs. As an example time-area moratoria on DFADs have been adopted regularly by tuna RFMOs since the mid 1990s, but these measures are limited to the protection of juvenile tuna and do not take account of the potential impact on bycatch or associated megafauna (whales and whale sharks). A simple iterative “fishing-day” model was developed to investigate the consequences on tropical tuna and bycatch of introducing wide area, six-month moratoria on DFAD sets (Fig. 20). The “fishing-day” model took account of the probability of the occurrence of several different fishing events (such as visual cues, size and species of tuna school, etc) and skippers’ on-the-spot decisions based on European purse-seine fishery data for the period 2005–2014. Monte Carlo simulations were carried out 1000 times to examine various scenarios for reallocating the fishing effort or changing fishing practices following the introduction of a six-month moratorium on DFAD sets for the European purse-seiners. The simulations included realistic scenarios in terms of difference in fishing strategies (e.g., DFAD targeting as observed for the Spanish fleet or combining DFAD and free schools fishing as seen for the French fleet) and reallocation of the fishing effort (e.g., at the periphery of the regulated area or towards the historic best fishing grounds).
As expected, for both the Atlantic and Indian oceans, the models predicted a decrease in DFAD sets and an increase in free school sets (Fig. 21). As a consequence, the catch of small tuna (<10 kg) decreased (except for the French fleet in the Atlantic Ocean) while the catch of large tuna (≥10 kg) increased, leading to an overall decrease in tuna catch of ~100 t/yr/boat in the Atlantic Ocean and 600–1800 t/yr/boat in the Indian Ocean. The bycatch for all groups considered (other bony fishes,
11 billfishes, sharks and turtles) decreased, except in the Atlantic Ocean, where the turtle and shark bycatch increased slightly for both fleets.
Effects of FAD fishing on emblematic and vulnerable species as well as on the Ecosystem
Concerns over the incidental capture of pelagic sharks has been the subject of several regulatory measures in tuna RFMOs (ICCAT-Rec [11-08], IOTC-Res [13_06], IATTC-Antigua convention), specifically because these species regularly become entangled in the netting that hangs below the DFADs. From observer-at-sea data collected by IEO and AZTI in the period 2003-2015, combined with the EU Copernicus data base for environmental data, a preliminary analysis used a delta-lognormal approach to characterize relevant environmental factors conditioning the habitat of silky sharks in the Atlantic and Indian oceans. However, due to time constraints, only an exploratory analysis was performed (Fig. 22).
The bycatch data collected under the European observer programs in the Indian, Pacific and the Atlantic Oceans between 2003 and 2010 were used to assess the effect of FAD-fishing in terms of alpha and beta diversity, rarefaction curves and biomass metrics. Regional differences were identified but the species diversity associated with the DFADs was found to be richer than for free school sets. The species composition and the structure of the community were directly related with the fishing mode (Fig. 23) and the environment in which the species lived. Diversity was explained by surface currents, wind patterns and upwellings at global scale, and by front systems, domes and eddies for both fishing modes at local scale. French observer datasets in the Atlantic and Indian oceans (2006-2013) were also used with a similar approach but at a smaller scale. Rarefaction curves confirmed that the number of taxa under DFADs was higher than for free school sets in both oceans. Simpson diversity and evenness were also significantly higher using DFADs rather than free school sets in both oceans. The overall size spectra of the bycatch showed no significant difference between oceans but there were more small individuals using DFADs (Widehem, 2015).
WP5-Data Management
One of the challenges of the CECOFAD research project was to provide links between the various sources of information (logbooks, observer data, VMS, echo sounder data, etc) collected in the work packages. Another important aspect was the absence or imprecision of FAD-fishing activity data which should be incorporated into records in ERS or paper logbooks in the future.
Links between databases
One of the challenges of the CECOFAD project was to create bridges between the various datasets (logbooks, observer programs, sampling in ports, etc). The two databases Balbaya (information declared in logbooks) and ObsTuna (on board observer data), collected within the Data Collection Framework (DCF) by the Tropical Tuna Observatory of IRD (OT-IRD) for French purse seiners were linked using the Standard Data-Exchange Format7, a human-readable file format for samplings, landings and effort data from commercial fisheries currently used within the EU DCF context (Table 6). This format allows a data aggregation level which is as low as possible while respecting data confidentiality issues and consequently should be considered as a good natural candidate for the exchange of data between partners in the tropical tuna fishery research community.
7
Jansen, T. (Ed). 2009. Definition of Standard Data-Exchange Format for Sampling, Landings, and Effort Data from Commercial Fisheries. ICES Cooperative Research Report No. 296. 43 pp. This should not be confused with the American SDEF data exchange standard.
12
Floating object data model for fishing logbook and on-board observer data
One task of CECOFAD was to review the definitions of variables required for evaluating DFAD-fishing activities that should be continuously recorded in logbooks. On the basis on the most recent recommendations from tRFMOs (ICCAT and IOTC), the original electronic fishing logbook data model (ERS) was extended to floating objects and then updated to meet IATTC and WCPFC recommendations. The format may differ slightly between the French and Spanish fleets but it was considered very important to have an agreement covering the minimum data requirement and the meaning of the variables collected.
In order to clarify certain definitions and to harmonize FAD data requirements between EU purse seine fleets, it was agreed that the information to be collected should:
(1) measure the fishing effort,
(2) measure the extent of changes in habitat caused by floating object fishing activities and (3) measure potential pollution (plastics, bamboo, netting, metal).
A floating object data model for the fishing logbook and on-board observer data was drawn up on the basis of these three objectives. The first point concerns the definition of the floating object8. A floating object at sea (FOB) is defined as a FAD (Fish Aggregating Device) if it is a man-made FOB specifically designed to encourage fish aggregation at the device, while any FOB other than a FAD, i.e. a natural (branches, carcasses, etc) or artificial (wreckage, nets, washing machines, etc) object will be termed a LOG. FADs and LOGs are then broken down into different categories depending on their features. In the case of logbooks the new information to be collected can be summarized as described in Table 7.
The activities of the purse seiner associated with a FOB were defined as follows (Table 8). In order to improve the quality of data collected by the skippers, a “User Interface” (UI) could be developed with the collaboration of the skippers. For example, a droplist with each operation being clearly represented by a photo might be proposed. For a quick implementation of the floating object model in the logbook it might be relevant to discuss this UI with some skippers. For data collected by on-board observers, several properties of the floating objects were added to the form in order to comply with the recommendations of the tuna RFMOs on FOB/FAD data (Table 9).
8 Note: adding a beacon to a DFAD or LOG does not change its type. The main function of a buoy is to locate the
13 References
Ariz J, Delgado A, Fonteneau A, Gonzalez Costas F, Pallares P (1999) Logs and tunas in the Eastern Tropical Atlantic. A review of present knowledge and uncertainties. In: Scott MD, Bayliff WH, Lennert-Cody CE, Schaefer KM (eds) Proceedings of the International Workshop on Fishing for Tunas Associated with Floating Objects, La Jolla, CA, February 11–13, 1992. Inter-Am Trop
Tuna Comm Spec Rep 11:21–65
Arrizabalaga H, Ariz J, Mina X, Delgado de Molina A, Artetxe I, Pallares P, Iriondo A (2001) Analysis of the activities of supply vessels in the Indian Ocean from observers data. Doc. IOTC
WPTT-01-11 : 30 p.
Campbell RA (2015) Constructing stock abundance indices from catch and effort data: Some nuts and bolts. Fisheries Research, 161, 109 – 130.
Cao J, Chen X, Chen Y, Liu B, Ma J, Li S (2011) Generalized linear Bayesian models for standardizing CPUE: an application to a squid-jigging fishery in the northwest Pacific Ocean. Scientia
Marina, 75, 679–689.
Capello, M., Robert, M., Soria, M., Potin, G., Itano, D., Holland, K., Deneubourg, J.-L., Dagorn, L., (2015). A Methodological Framework to Estimate the Site Fidelity of Tagged Animals Using
Passive Acoustic Telemetry. PLoS ONE 10, e0134002.
doi:10.1371/journal.pone.0134002.g009
Chassot, E., Dubroca, L., Delgado de Molina, A., Assan, C., Soto, M., Floch, L., Fonteneau, A., (2012). Decomposing purse seine CPUEs to estimate an abundance index for yellowfin free-swimming schools in the Indian Ocean during 1981– 2011. IOTC-2012-WPTT14-33
Chassot E, Goujon M, Maufroy A, Cauquil P, Fonteneau A, Gaertner D. (2014) The use of artificial fish aggregating devices by the French tropical tuna purse seine fleet: Historical perspective and current practice in the Indian Ocean. IOTC–2014–WPTT16–20
Delgado de Molina A, Ariz J, Murua H, and Santana J. C. (2015) Spanish Fish Aggregating Device Management Plan. Preliminary data. Collect. Vol. Sci. Pap. ICCAT, 71(1): 515-524
Delgado de Molina A, Ariz J, Murua H, Santana J.C, Ramos L, and Soto M. (2014) Spanish Fish Aggregating Device Management Plan. Preliminary data in the Indian Ocean. IOTC–2014–
WPTT16–19.
Escalle L, Gaertner D, Chavance P, Delgado de Molina A, Aiz J, Merigot B (in press) Forecasted consequences of simulated FAD moratoria in the Atlantic and Indian Oceans on catches and bycatches. ICES Journal of Marine Science
Fonteneau A, Chassot E, and Gaertner D. (2015) Managing tropical tuna purse seine fisheries through limiting the number of drifting fish aggregating devices in the Atlantic: food for thought.
Collect. Vol. Sci. Pap. ICCAT, 71(1): 460-475
Fonteneau A, and Chassot E. (2014) Managing tropical tuna purse seine fisheries through limiting the number of drifting fish aggregating devices in the Indian Ocean: food for thought. IOTC–
2014–WPTT16–22.
Fonteneau A, Gaertner D, and Nordstrom V (1999) An overview of problems in the catch per unit of effort and abundance relationship for the tropical purse seine fisheries. Col. Vol. Sci. Pap.,
ICCAT, 49(3): 258-278.
Gaertner, D and Pallares P (2002) Efficacité des Senneurs Thoniers et Effort Réels (ESTHER) Progr.
98/061. Union Européenne, DG "Fisheries" (DG XIV), Bruxelles, (Belgique). Rapport Scientifique 187 p.
Garcia S.M., Zerbi A., Aliaume C., Do Chi T., and Lasserre G. (2003). The ecosystem approach to fisheries. Issues, terminology, principles, institutional foundations, implementation and outlook. FAO Fisheries Technical Paper. No. 443. Rome, FAO. 71 p
Goujon M, Claude A , Lecouls S, and Mangalo C. (2015) Premier bilan du plan de gestion des DCP mis en place par la France en Océan Atlantique. Collect. Vol. Sci. Pap. ICCAT, 71(1): 573-591
14 Goñi N, Ruiz J, Murua H, Santiago J, Krug I, Sotillo de Olano B, González de Zarate A, Moreno G & Murua J (2015) Verification of the limitation of the number of FADs and best practices to reduce their impact on bycatch fauna. IOTC–2015–WPTT17–33
Hallier J.P, Parajua J.I (1999) Review of tuna fisheries on floating objects in the Indian Ocean. In: Scott MD, Bayliff WH, Lennert-Cody CE, Schaefer KM (eds) Proceedings of the International
Workshop on Fishing for Tunas Associated with Floating Objects, La Jolla, CA, February 11–13,
1992. Inter-Am Trop Tuna Comm Spec Rep 11:195–221
Katara, I and Gaertner D. (2014) Some news approaches for standardizing tropical purse seiners CPUEs. IOTC–2014–WPTT16–16.
Katara I, Gaertner D, Maufroy A, Chassot E. (2015) Standardization of catch rates for the Eastern tropical Atlantic bigeye tuna caught by the French purse seine FAD fishery. SCRS-2015-106 Laurec, A. (1977). Analyse et estimation des puissances de pêche. Journal du Conseil international
pour l'exploration de la mer, 37(2), 173-185
Lezama-Ochoa N (2016) Biodiversity and habitat preferences of the by-catch communities from the tropical tuna purse-seine fishery in the pelagic ecosystem: The case of the Indian, Pacific and Atlantic Oceans. PhD thesis, Universidad del Pais Vasco. 284 p.
Lo N.C.-h., Jacobson L.D., Squire J.L (1992). Indices of Relative Abundance from Fish Spotter Data based on Delta-Lognormal Models. Canadian Journal of Fisheries and Aquatic Sciences 49, 2515-2526.
Lopez J, Fraile I, Murua J, Santiago J, Merino G, and Murua H (2015). Technological and fisher’s evolution on fishing tactics and strategies on FADs vs. non-associated fisheries. IOTC–2015–
WPTT17–32 Rev-1
Lopez J, Moreno G, Sancristobal I, and Murua J, (2014) Evolution and current state of the technology of echo-sounder buoys used by Spanish tropical tuna purse seiners in the Atlantic, Indian and Pacific Oceans. Fish. Res. 155, 127–137.
Maufroy A, Bez N, Kaplan D, Delgado de Molina A, Murua H, and Chassot E (2014) How many Fish Aggregating Devices are currently drifting in the Indian Ocean? Combining sources of information to provide a reliable estimation. IOTC–2014–WPTT16–21
Maufroy A, Chassot E, Joo R, and Kaplan, D. M. (2015a) Large-scale examination of spatio-temporal patterns of drifting fish aggregating devices from tropical tuna fisheries of the Indian and Atlantic Oceans. PLoS ONE.
Maufroy A, Gaertner D, Kaplan D. M, Bez N, Soto M, Assan C, Lucas J & Chassot E (2015b) Evaluating the efficiency of tropical tuna purse seiners in the Indian Ocean: first steps towards a measure of fishing effort. IOTC–2015–WPTT17–14
Maufroy A, Kaplan D. M, Bez N, Delgado de Molina A, Murua H, Floch L. & Chassot E. (in press) Massive increase in the use of drifting fish aggregating devices (dFADs) by tropical tuna purse seine fisheries in the Atlantic and Indian oceans. ICES Journal of Marine Science.
Maufroy A. (2016) Drifting Fish Aggregating Devices of the Atlantic and Indian Oceans: modalities of use, fishing efficiency and potential management. Thèse doctorale ED Gaia, Université de
Montpellier. 173 p.
Maunder MN, Punt AE (2004) Standardizing catch and effort data: a review of recent approaches.
Fisheries Research, 70, 141–159.
Moreno G, Dagorn L, Sancho G, García D, and Itano D (2007) Using local ecological knowledge (LEK) to provide insight on the tuna purse seine fleets of the Indian Ocean useful for management.
Aquat. Living Resour. 20, 367–376
Nishida T, Chen D-G (2004) Incorporating spatial autocorrelation into the general linear model with an application to the yellowfin tuna (< i> Thunnus albacares</i>) longline CPUE data.
15 Poisson F, Seret B, Vernet A.L., Goujon M, Dagorn L (2014) Collaborative research: Development of a manual on elasmobranch handling and release best practices in tropical tuna purse-seine fisheries Marine Policy, 44: 312-320.
Santiago, J., Lopez, J., Moreno, G., Murua, H., Quincoces, I., Soto, M., (2015). Towards a Tropical Tuna Buoy-derived Abundance Index (TT-BAI). SCRS/2015/90.
Saulnier, E., (2014). Dynamique spatio-temporelle de l’effort de pêche sur DCP des thoniers senneurs français dans l’océan indien. Mémoire d'ingénieur de l'institut Supérieur des Sciences
agronomiques, agroalimentaire, horticole et du paysage. Spécialité : Halieutique, Agrocampus Ouest Rennes, 63 pp.
Tibshirani R (1996) Regression shrinkage and selection via the lasso. Journal of the Royal Statistical
Society. Series B (Methodological), 267–288.
Tibshirani R (2011) Regression shrinkage and selection via the lasso: a retrospective. Journal of the
Royal Statistical Society: Series B (Statistical Methodology), 73, 273–282.
Torres-Irineo E, Gaertner D, Chassot E, Dreyfus-León M (2014) Changes in fishing power and fishing strategies driven by new technologies: The case of tropical tuna purse seiners in the eastern Atlantic Ocean. Fishery Research, 155: 10-19
Widehem C. (2015) Impact de la pêche thonière à la senne sur les communautés pélagiques de l’océan Atlantique et de l’océan Indien : comparaison de la pêche sous les dispositifs de concentration de poissons et de la pêche en bancs libres. Mémoire d'ingénieur de l'institut
Supérieur des Sciences agronomiques, agroalimentaire, horticole et du paysage. Spécialité : Halieutique, Agrocampus Ouest Rennes 46p.
16
Figure 1 Technological improvements in fishing efficiency established from interviews with EU purse seiner skippers (number of skippers in the X-axix) operating in the Indian ocean (Maufroy, 2016).
Figure 2 Historical changes in fishing technology among those with major effect on fishing efficiency of purse seine vessels over recent decades from ISSF Spanish skipper workshops. Factors not included here were considered to have a marginal effect on fishing capacity. (Lopez et al, 2015)
17 Figure 3. Proportion of buoys by type (from less sophisticated, e.g. HF in the left to buoy equipped with echo-sounder in the right for a French fishing company (Chassot et al, 2014).
Figure 4. Transition from HF buoys to GPS buoys equipped with echo sounder for the French fleet operating in the Atlantic Ocean (from table 5 in Goujon et al, 2015).
Figure 5. Guesstimates for the transition to most modern buoys for the Spanish (taken from Ramos et al, 2010 and Lopez et al, 2014)
0 1000 2000 3000 4000 5000 6000 7000 0 100 200 300 400 500 600 700 800 900 1000 Tot al c at ch by boa t (T on)
Number of active FADs by year and by quarter
ATLANTIC OCEAN 2013-2014 (By quarter)
With Supply Without Supply
Figure 6. Relationship between the quarterly
catch (all species combined in the Y-axix)
for each Spanish purse seiner and the number of buoys (in the X-axis) used in the Atlantic Ocean (top) and in the Indian Ocean (bottom) with a supply vessel (red) and without (blue);
small purse seiners are represented by smaller triangles (Sotillo et al,
18 Figure 7. Annual number of buoys available per French purse seiner in the Indian Ocean, during the period 2002-2014 (Chassot et al, 2014); Numbers on the bars indicate the number of vessels for which data were available.
Figure 8. Number of active buoys equipped with DFADs used by the Spanish fleets operating in the Atlantic and Indian oceans in 2013 (taken from Delgado et al, 2014, 2015)
0 1000 2000 3000 4000 5000 6000 0 200 400 600 800 1000 1200 1400 1600 Tot al c at ch by bo at ( Ton )
Number of active FADs by year and by quarter
INDIAN OCEAN 2013-2014 (By quarter)
19 Figure 9.: Estimated number of DFADs seeded per year for each flag and the total for the Atlantic Ocean (Fonteneau et al, 2015). NEI means “Not Elsewhere Included” for unreported catches.
Figure 10.: Estimated total numbers of new buoys released yearly by French, Spanish and Seychelles flag purse seiners in the Indian Ocean (Fonteneau and Chassot, 2014)
Figure 11. Number of French GPS buoys active at sea per vessel per day in the Atlantic and Indian oceans based on GPS buoy tracks and orders provided by the French fishing companies (Maufroy, 2016)
20 Figure 12 : Extrapolation process used to estimate the total DFADs and floating objects (Maufroy et al, 2014)
Figure 13: Estimates of the number of DFADs drifting at sea in the Atlantic and the Indian oceans (Maufroy et al, in press)
Series1, Deploym ent, 31.72, 0.32 Series1, Visit, 30.05, 0.30 Series1, Fishing set, 24.67, 0.25 Series1, Retrieval , 5.92, 0.06 Series1, Change a buoy, 7.15, 0.07 Series1, Fix a buoy, 0.49, 0.00 Series1, Lost, 0, 0.00
Atlantic Spanish PS with supply
DeploymentVisit Fishing set Retrieval Change a buoy Series1, Deploym ent, 43.205, 0.43 Series1, Visit, 13.44, 0.14 Series1, Fishing set, 21.535, 0.22 Series1, Retrieval , 4.225, 0.04 Series1, Change a buoy, 14.24, 0.14 Series1, Fix a buoy, 0.28, 0.00 Series1, Lost, 2.575, 0.03
Atlantic Spanish PS without
supply
Deployment Visit Fishing set Retrieval Change a buoy21 Figure 14. Proportion of time spent on fishing activities of the Spanish purse seiners with (left) and without (right) the assistance of a supply vessel in the Atlantic ocean (top) and in the Indian ocean (bottom); taken from Sotillo et al, pers. comm.; (2013 and 2014 combined)
Figure 15. Sharing DFADs between Spanish purse seiners (on the X axis, in the Atlantic, Indian and Pacific oceans, respectively; Lopez et al, 2015).
Series1, Deploym ent, 51.84, 0.52 Series1, Visit, 14.57, 0.15 Series1, Fishing set, 16.19, 0.16 Series1, Retrieval, 2.36, 0.02 Series1, Change a buoy, 11.66, 0.12 Series1, Fix a buoy, 3.40, 0.03 Series1, Lost, 0, 0.00
Indian O. Spanish PS with
supply
Deployment Visit Fishing set Retrieval Change a buoy Series1, Deploym ent, 48.83, 0.49 Series1, Visit, 14.30, 0.14 Series1, Fishing set, 11.45, 0.12 Series1, Retrieval , 1.90, 0.02 Series1, Change a buoy, 19.87, 0.20 Series1, Fix a buoy, 3.04, 0.03 Series1, Lost, 0, 0.00Indian O. Spanish PS without
supply
Deployment Visit Fishing set Retrieval Change a buoy22 Figure 16. Time at sea for DFADs for each ocean and each month of the year for the French fleet operating in the Atlantic and Indian oceans (Maufroy et al, 2015a).
23 Figure 18. Examples of acoustic time series recorded by a Zunibal (left) and a Satlink (right) buoy in the Indian Ocean in October 2011. The Y-axis represents the number of pixels occupied by the acoustic signal for the Zunibal buoy and tons of acoustic target for skipjack tuna for the Satlink buoy.
Figure 19. Smoothed densities of DFAD deployment positions (a) and related beaching events (b); black dots correspond to individual beaching positions (Maufroy et al. 2015)
24 Figure 20. Examples of different six-month moratoria on DFADs used in the Monte Carlo simulations (Escalle et al, .in press)
Figure 21. Monte Carlo simulations for the main scenarios of six-month moratoria on DFADs in the Atlantic and Indian oceans (Escalle et al. in press)
25 Figure 22 Spatial distribution of the silky shark Carcharhinus falciformis caught by the purse seiners from Spanish scientific observer data (free schools and DFADs; Lopez et al pers. comm.)
Figure 23. Species accumulation curves for bycatch in DFADS (a) and free school sets (b) from scientific observers on board the European purse seine fleets operating in the the Indian ocean (Lezama-Ochoa, 2016)
26 Table 1. Number of DFADs used by French purse seiners in the Atlantic Ocean : seeded per year and DFADs active within a quarter, number of purse seiners and total catches using DFADs (Fonteneau et al, 2015)
Purse seine fleet Time (min) Distance (km)
France 82.4 57.1
Spain 63.2 24.2
Table 2. Time and distance between consecutive DFAD deployments reported by scientific observers on board for Spanish and French purse seiners (Maufroy et al, 2014)
27
Variables Short description
Year Month
Time at Sea Duration of the fishing trip Fishing Time Duration of the fishing sets
Sample Area Areas covered by the landing samples
EEZ Exclusive Economic Zone
Grid Cell 1° x 1° cell
Skipper Name of the skipper on each vessel and trip
Vessel Vessel identifier
Vessel age Year vessel entered service
Vessel length In meters
Vessel power In horsepower
Vessel capacity In tonnage
Vessel category Vessel category based on vessel length and capacity YFT price Yellowfin tuna price at Bangkok auction
SKJ price Skipjack tuna price at Bangkok auction
YFT/SKJ price ratio Ratio between yellowfin and skipjack tuna prices GPS buoys bought per vessel
The data on GPS, HF-GPS, and HF-GPS/GPS buoy purchases is only available for a small number of vessels
HF-GPS buoys bought per vessel
HF-GPS/GPS buoys bought per vessel
HF buoys deployed per vessel
Parameters from Goujon et al 2014 (BSE = echo sounder buoy) BS buoys deployed per
vessel
BSE buoys deployed per vessel
Distance of fishing set from a
FAD Distance of a set from the nearest FAD (monthly average) Distance of fishing set from
the centre of the FAD area
Distance of a set from the centroid of the FAD area (monthly average)
FAD counts around fishing set in a fixed (143 nm) buffer zone
Number of FADs around a fishing set. 143nm is the nearest neighbor distance between sets and FADs occurring in a given month, averaged over the time series.
FAD counts around fishing set in a variable buffer zone
Number of FADs around a fishing set. The buffer zone is equal to the maximum nearest neighbor distance between the fishing sets and the FADs for the given month.
FAD area
Total area occupied by FADs: the sum of the areas of the polygons of the standard distance for each FAD trajectory. Overlapping polygons were merged.
Table 3 Predictors used in the elastic net GLMs and the Lasso GLMMs (Katara et al, 2015). The numbers of positive and null fishing sets are used as predictors in the lognormal models.
28 French Fleet Pr(Cs>0) Lognormal Year (f) (f) Month Time at Sea Fishing Time Positive sets Null sets Sample Area (f) EEZ (f) Grid Cell Skipper 0.65 0.001 Vessel 0.49 0.1 Vessel age Vessel length Vessel power Vessel capacity Vessel category
YFT price -1e-14
SKJ price -4e-16
YFT/SKJ price ratio GPS buoys bought per vessel
HF-GPS buoys bought per vessel
HF-GPS/GPS buoys
bought per by vessel Number of HF buoys deployed per vessel
-0.08 9e-15
Number of BS buoys deployed per vessel Number of BSE buoys deployed per vessel
-8e-16
Distance from a FAD -5e-02
Distance from the
centre of the FAD area FAD counts in buffer zone = 2.39dd
FAD counts in buffer zone = max FAD area Year*month Year*Cell 1.76 0.5 Year*vessel age*category Spanish and French Fleets Pr(Cs>0) Lognormal Year (f) Month (f)
Time at Sea 3.5e+09 5.7e-14
Fishing Time -8e+09 7.05e-14
Positive sets Null sets Total Sets Sample Area (f) (f) Flag Fleet (f) (f) # of supply vessels (annual) -5e-01 8.5e-13 EEZ (f) (f) Grid Cell:year 0.9 0.459 Vessel 0.22
Vessel age -7e+08 -3.7e-14
Vessel length 9.8e-01 -6.9e-13
Vessel power 4.7e+09 -7.2e-13
Vessel capacity 4.8e+09 -7.99e-13
Vessel category (f) (f)
YFT price
-2.6e-01
-8.6e-14
SKJ price
-1.5e-01
-1.5e-13
YFT/SKJ price ratio -4.2e-14
Number of HF buoys deployed per vessel
2e-01 -8.6e-14
Number of BS buoys deployed per vessel Number of BSE buoys deployed per vessel
-2e+08 1.06e-14
Distance from a French FAD
9e-02 3.1e-13
Distance from the centre of the French FAD area
6.6e-02 3.4e-13
French FAD counts in buffer zone = 2.39dd
-5e-02 3.4e-13
French FAD counts in buffer zone = max
4e-02 -1.18e-13
French FAD area
-2.6e-01
-8.6e-14 Year*month
29 Table 4 : Lasso GLMMs for the French fleet and the combined Spanish and French fleets (Katara et al, 2015)
Data cleaning Objective
Time after deployment or after a set (<2 days)
Shorter time at sea may cause noise in the final estimate
Layer (<25 m) To remove noise from non-tuna species associated with the DFAD Time of day Selecting only acoustic data at a common standard time could
reduce the effect of local time
Bottom depth (< 200 m) To remove acoustic records of FADs that have drifted into coastal areas and might provide false positives
Speed of the buoy (> 3 knots) To remove records when DFADs are still onboard
Table 5. Criteria that should be used for cleaning the datasets before standardizing an abundance index derived from echo sounder buoy data (Santiago et al, 2015).
Level Main variables
Trip Sampling type (market, onboard, etc..)
Vessel ID (encrypted) Vessel size Days at sea Fishing operation Date
Time: 100% for onboard observer dataset and 30% for on-shore
Location
School type: free or log for on-shore, detailed for onboard (free, DFAD, whale,
Whale-shark) Species
caught
Species
Landed / discard
Fate of discards: alive or dead (for onboard dataset)
Catch weight
Sampled weight
Size structure Length class
Number at length
Table 6 Main variables and metrics of the French DCF dataset in Standard Data-Exchange Format (e.g., bridges between Balbaya and Observ databases, Billet pers. comm..)
30
Code Name Example
DFAD Drifting FAD Bamboo or metal raft
AFAD Anchored FAD Very large buoy
FALOG Artificial log resulting from human activity (and related to
fishing activities)
Nets, wreck, ropes
HALOG Artificial log resulting from human activity (not related to
fishing activities)
Washing machine, oil tank
ANLOG Natural log of animal origin Carcasses, whale shark
VNLOG Natural log of plant origin Branches, trunk, palm leaf
Table 7: Codes, names and examples of different types of floating object that should be collected in the fishing logbook as a minimum data requirement
Name Description
FO
B
Encounter Random encounter (without fishing) of a log or a FAD belonging to another vessel (unknown position)
Visit Visit (without fishing) of a FOB (known position) Deployment FAD deployed at sea
Strengthening Consolidation of a FOB Remove FAD FAD retrieval
Fishing Fishing set on a FOB9
B
U
O
Y
Tagging Deployment of a buoy on FOB10
Remove BUOY Retrieval of the buoy equipping the FOB
Loss Loss of the buoy/End of transmission of the buoy
9
A fishing set on a FOB includes two aspects: fishing after a visit to a vessel’s own FOB (targeted) or fishing after a random encounter of a FOB (opportunistic).
10
Deploying a buoy on a FOB includes three aspects: deploying a buoy on a foreign FOB, transferring a buoy (which changes the FOB owner) and changing the buoy on the same FOB (which does not change the FOB owner).