LIB R A R
A DESCRIPTION AND AN ANALYSIS OF MEANDERS IN THE GULF STREAM
by
THOMAS FERRIS WEBSTER B.Sc., University of Alberta
(1956)
M.Sc., University of Alberta
(1957)
SUBMITTED IN PARTIAL FULFILLMENT OF THE REQUIREMENTS FOR THE
DEGREE OF DOCTOR OF PHILOSOPHY at the MASSACHUSETTS INSTITUTE OF TECHNOLOGY February, 1961 Signature of Author . . . . . . . . . . . . . . . . . . -. -
-Department of Geology and Geophysics.
Gryt,(
/3,/T&/Certified by . . . . . . . . . . . ..
Thesis Supervisor Accepted by . -. v... . . - - . . - - -
-.-Chairman, Departmental Committee on Graduate Students
A DESCRIPTION AND AN ANALYSIS
OF MEANDERS IN THE GULF STREAM
by
Thomas Ferris Webster
Submitted to the Department of Geology and Geo-physics on January 9, 1961, in partial fulfillment of the requirements for the degree of Doctor of Philosophy.
ABSTRACT
Data from a month of continuous surface
obser-vations across the Gulf Stream show a periodic, time varia-tion in the posivaria-tion of the current. The region studied is off Onslow Bay, North Carolina, where the current is close to the edge of the continental shelf. The dominant periods of the position variations correspond to the
periods of the offshore winds between Charleston, S. C.
and Cape Hatteras, N. C. There is, however, no
indica-tion of resemblance between the periods of the stream positions and the more persistent downstream winds.
The dominant variations in position, referred to here as meanders, have amplitudes of 10 km. Lunar com-ponents, either monthly or diurnal, have amplitudes which are, at most, small in comparison with those of the
prin-cipal meanders.
Although the meanders off Onslow Bay may be
analogous to the multiple currents found downstream, their periods eliminate them as incipient forms of the large-scale meanders. An average section for the month of obser-vations is presented, and shows a stream profile much more broad than is found on any individual crossing.
Using surface velocities, calculations of the transfer of kinetic energy from meanders to mean flow were made both off Onslow Bay and in the Straits of Florida
between Miami and the Bahamas. In both cases, it was found that the meanders transferred momentum against the velocity gradient, exactly opposite to what would be
expected if they were frictionally driven. The
observa-tions suggest that the mean flow of the Gulf Stream is enhanced by the kinetic energy of meanders, and that the meanders should therefore derive their energy from sources
other than the kinetic energy of the mean flow.
Thesis Supervisor: William S. von Arx Title: Professor of Oceanography
PREFACE
This thesis consists primarily of two papers. The first is a description of Gulf Stream meanders off Onslow Bay; the second is an inquiry into the balance of kinetic energy in the Florida Current. Though related, it
is believed that these papers are of sufficiently different character to warrant separate publication. Because each is given here substantially in the form that will be submitted for publication, there is a certain amount of duplication.
In addition, the thesis contains supplementary material which is not intended for separate publication,
but which is added to provide background and to indicate directions of inquiry which have been pursued during the
development of the thesis.
The author wishes to acknowledge the assistance
of the following:
W. S. von Arx, who initiated and directed the program of observations which are analyzed here, for his encouragement and help throughout the preparation of the thesis.
K. Bryan, Jr., for suggesting that eddy kinetic
energy calculations be tried, and for further suggestions in the course of many stimulating discussions.
B. A. Warren, for critically reading the
thesis.
Helen F. Phillips, for typing the manuscript through many drafts, and for many useful suggestions on the presentation of the material.
D. F. Bumpus and C. G. Day, for work done
during CRAWFORD Cruise 18, on which the data were collected. Much of the data included here were reduced and
checked by Nellie Andersen.
Diagrams 1 through 23 were drafted by Richard
von Dannenberg and Charles Innis.
The one hundred and twenty cross-sections were
drafted by Gale Pasley and Mary Minot.
Most of the funds supporting this research were provided by the Office of Naval Research, under contract Nonr2196(oo). In addition, the author wishes to acknow-ledge the award of an MIT Canadian Trust Fund Scholarship.
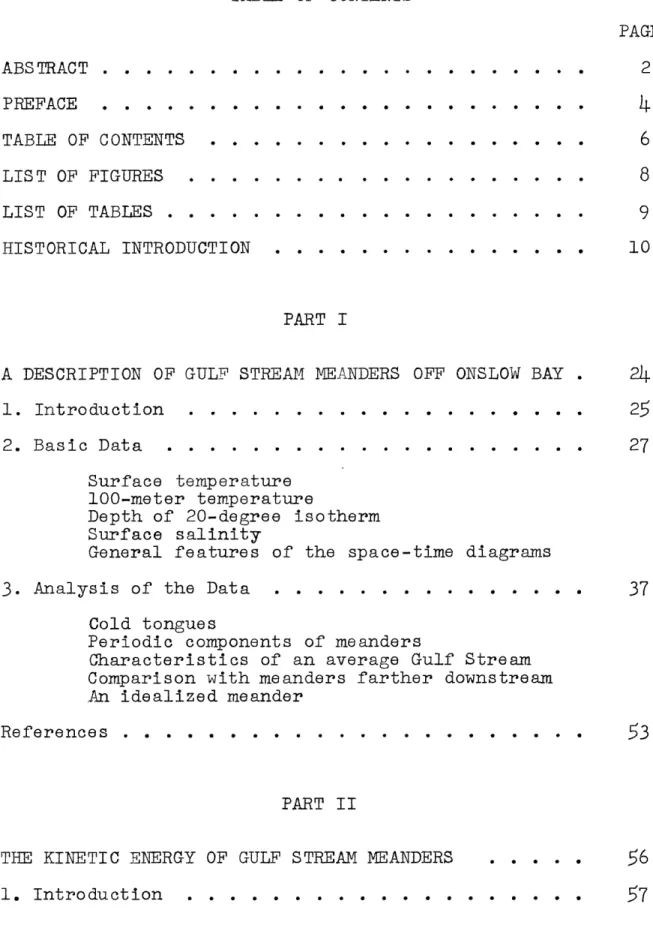
TABLE OF CONTENTS PAGE ABSTRACT . . . . . . . . PREFACE TABLE OF CONTENTS . . . LIST OF FIGURES . LIST OF TABLES... HISTORICAL INTRODUCTION 2
4
6
8
.
. . . 10 PART IA DESCRIPTION OF GULF STREAM MEANDERS OFF ONSLOW BAY . 1. Introduction . . . . . . . . . . . . . . . . . . . 2. Basic Data . . . . . . . . . . . . . . . . . . . .
Surface temperature 100-meter temperature
Depth of 20-degree isotherm Surface salinity
General features of the space-time diagrams
3. Analysis of the Data . . . . . . . . . . . . . . .
Cold tongues
Periodic components of meanders
Characteristics of an average Gulf Stream Comparison with meanders farther downstream
An idealized meander
References . . . . . . . . . . . . . . . . . . . . . .
PART II
THE KINETIC ENERGY OF GULF STREAM MEANDERS
1. Introduction . . . .. .. .& . . . .. .
2. Observations... ... . ...
57
GEK Data Onslow Bay Florida Straits 3. Energy Calculations . . . . . . . . . . . . . . . . . 65 Onslow Bay Florida Straits Statistical significance of results4.
Discussion of Results ... . ... 68Scale of perturbations Regeneration time Atmospheric similarities Austausch coefficients
5.
Kinetic Energy Equation . . . . . . . . . . . . . . . 806. Conclusions . . . . . . . . . . . . . . . . . . . . . 86
References . . . . . . . . . . . . . . . . . . . . . . . 88
APPENDIX 1. Surface Velocities ... . . . ... .. 92
Downstream surface velocity Stream function 2. Correlation between surface velocity and subsurface temperature . . . . . . . . . . . . . . . . . . . . 97
3. Variations in Flow . . . . . . . . . . . . . . . . . . 99
4. Advection of Mean Kinetic Energy by Eddies ... 105
5.
Reynolds Stress as a Correlation Coefficient . . . . . 1076. Suggestions for Future Research . . . . . . . . . . . 110
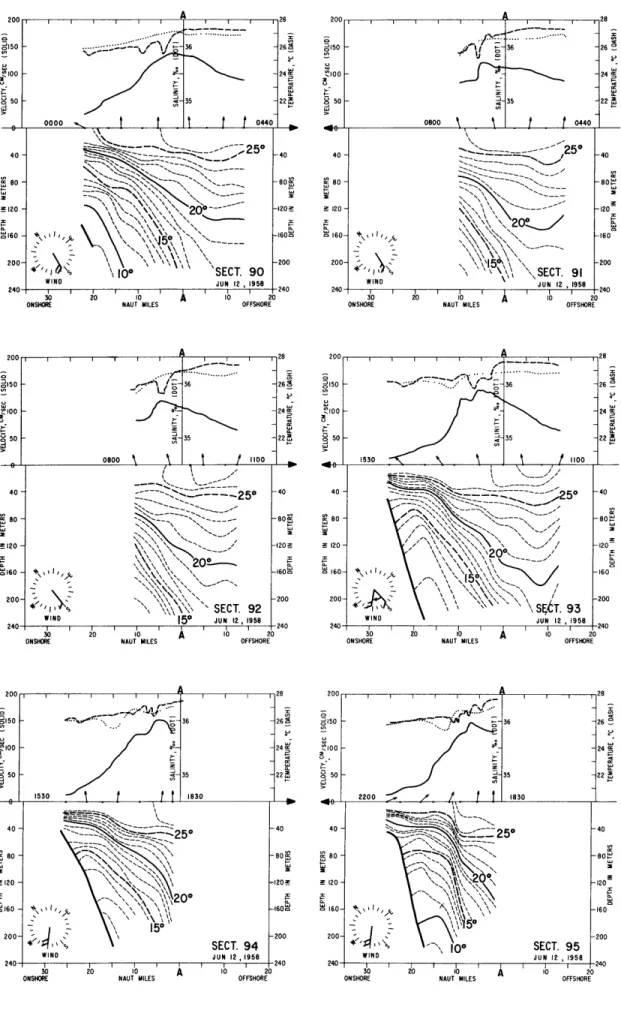
7. CRAWFORD 18 Cross-sections . . . . . . . . . . . . . . 114
BIBLIOGRAPHY . . . . . . . . . . . . . . . . . . 135
LIST OF FIGURES
FIGURE PAGE
1 Onslow Bay Area . . . . . . . . . . . . . . . . . . . . 26
2 Surface temperature, CRAWFORD Cruise 18 . . . . . . . . 30
3 100-meter temperature, CRAWFORD Cruise 18 . . . . . . . 31
4
Depth of 20-degree isotherm, CRAWFORD Cruise 18 . 335
Surface salinity, CRAWFORD Cruise 18 . . . . . . . . . 346 Position of stream center, CRAWFORD Cruise 18 -.-.-.-.-.36
7
Harmonic components of meanders . . . . . . . . . . . . 428 Atmospheric pressure difference between Cape Hatteras and Charleston, and position of stream center during CRAWFORD Cruise 18 . . .
44
9
Lagged atmospheric pressure and meanders . . . . . . .45
10 Cross-section of average current . . . . . . . . . . .
47
11 Idealized meander structure . . . . . . . . . . . . . .
51
12 Florida Current region . . . . . . . . . . . . . . . .
59
13 Florida Straits . . . . . . . . . . . . . . . . . . . . 62
14 Average surface velocity, Florida Straits . . . . . . . 64
15
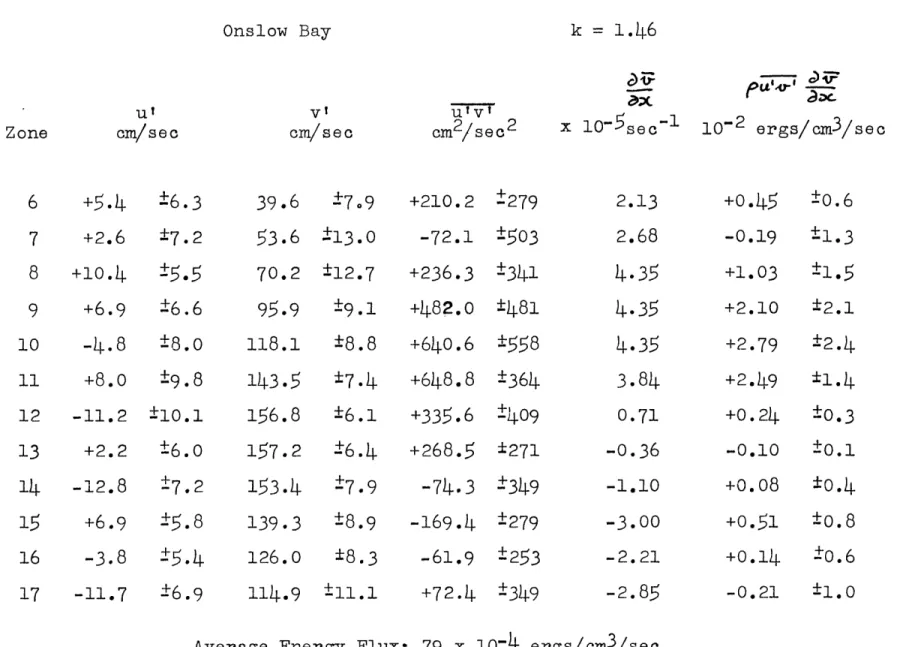
Production of mean kinetic energy, Onslow Bay . . . . .67
16 Production of mean kinetic energy, Florida Straits 70 17 Production of zonal kinetic energy, atmosphere . 77 18 GEK velocity, CRAWFORD Cruise 18 . . . . . . . . . . . 93
19 Surface stream function, CRAWFORD Cruise 18 . . . . . . 96
20 Half-width . . . . . . . . . . . . . . . . . . . . . . 100
21 Maximum velocity . . . . . . . . . . . . . . . . . . . 101
22 Shape factor . . . . . . . . . . . . . . . . . . . . . 102
23 Transport . . . . . . . . . . . . . . . . . . . . . . . 103
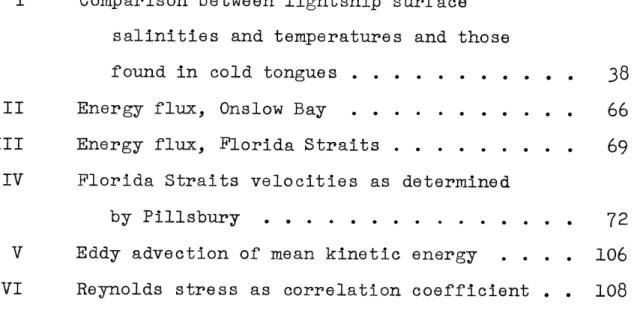
TABLE PAGE
I Comparison between lightship surface salinities and temperatures and those
found in cold tongues.-.-.-.-.-.- - . 38
II Energy flux, Onslow Bay . . . . . . . . . . . 66
III Energy flux, Florida Straits . . . . . . . . . 69
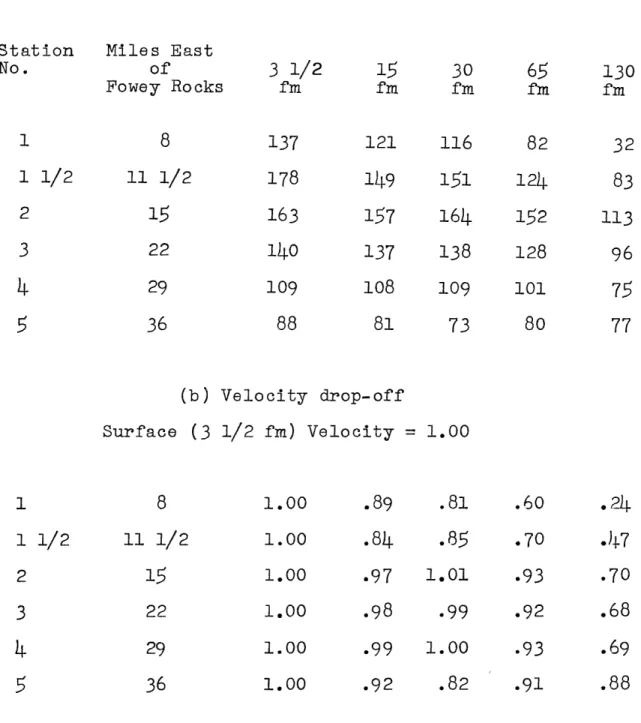
IV Florida Straits velocities as determined
by Pillsbury . . . . . . . . . . . . . . . 72
V Eddy advection of mean kinetic energy . 106 VI Reynolds stress as correlation coefficient . 108
HISTORICAL INTRODUCTION
The object of this thesis is to study the surface structure and kinetic energy of meanders of the Gulf Stream south of Cape Hatteras. The region south of Cape Hatteras is of interest for two reasons. (1) Because little is known about meanders in that area; there is common belief that meanders do not become developed until the stream passes
Cape Hatteras. However, it is now known that meanders
south of Cape Hatteras do exist, and further description of
them is needed. (2) Because the meanders upstream from
Cape Hatteras are smaller than those found downstream, obser-vations and analyses of the former can be more easily under-taken. It is hoped that the analysis of data taken upstream from Cape Hatteras will provide information of a fundamental
character which can have application downstream as well.
The following brief historical outline is intended
to review those studies which have revealed or analyzed the
meandering flow of the Gulf Stream.
Observational Studies. Investigations of the
Gulf Stream have, until recently, been mostly centered on a
description of broad, average features. Only after a large
number of cruises did it become apparent that the flow was,
in fact, not smooth and continuous, but irregular, possibly interrupted, and of variable strength.
Pillsbury (1891), an oceanographer of the United States Coast and Geodetic Survey, made a thorough study of
the current between the Gulf of Mexico and Cape Hatteras.
His study produced evidence of fluctuations in transport, which he attempted to relate to the declination of the moon. He also noted lateral variations in the position of the cur-rent, and that the amplitude of these variations increased
downstream. He speculated that the variations would increase
beyond Cape Hatteras, and eventually result in the
oblitera-tion of the boundaries of the Gulf Stream. He concluded,
moreover that the current was not divided by irregular
bottom topography. Bache (1860) had suggested this from an
earlier study, which revealed veins of cold water, which he
supposed were indications of a division of the stream, pro-duced by an irregular bottom. Pillsbury's soundings
revealed that the bottom was too regular to be the source of branching of the current.
After Pillsbury's measurements, little new was done until about thirty years later when advances in instru-mentation stimulated fresh investigations. The development
of the continuously recording thermograph provided a means
for rapid surface surveys of large ocean areas. Thermographs
were installed on commercial ocean liners running between Bermuda and North America. The resulting surface
tempera-tures provided evidence of time variations of the position
- 12
-concluded that the Gulf Stream executed "lateral wanderings"
or meanders, which increased in amplitude as the Gulf Stream
progressed northeastward from Cape Hatteras. He reported, moreover, that onshore migrations of Gulf Stream water
occasionally occurred at Diamond Shoals Lightship, near Cape Hatteras, with-a meander amplitude of about thirty or forty miles, in good accord with the latest measurements.
Hachey (1939) made a study of ten years of
thermograph records obtained between Halifax, Boston, and Bermuda. He detected what seemed to be a seasonal migra-tion of the Gulf Stream axis, with southerly excursions of the stream occurring at the equinoxes. However, his data show wide deviations from this rule in certain years. In addition, he calculated the intensity of the current flow from considerations of the sea level difference between Bermuda and Charleston, and found a seasonal variation. He went on to relate the variations in transport with the seasonal migrations of the stream axis, concluding that in
periods of weakening flow, the position of the Gulf Stream
moved closer to the American continent.
Iselin made an extensive study of the circulation of the western North Atlantic in the 1930's. The Gulf Stream System, as portrayed by Iselin (1936), is fed by additions of water from the Sargasso Sea region as it flows between
the Straits of Florida and Cape Hatteras. Beyond Cape
continues with relative uniformity until it passes the Grand Banks. Beyond this point it seems gradually to
dis-sipate into a number of divergent branches.
In a further study of the Gulf Stream System Iselin (1940) investigated the variations in transport. He assumed that the current system in the North Atlantic was a single clockwise eddy, whose central core was the Sargasso Sea, and that an increase in transport would cause the eddy to deepen and contract. Weakening currents, on the other hand, would result in expansion of the eddy with some
shoaling and spreading of the central core. Iselin supposed that such a mechanism might explain the apparent seasonal migrations of the current.
The development of the bathythermograph (BT) during the Second World War made rapid surveys of the upper water layers possible. While making BT temperature sections across the Gulf Stream, Spilhaus (1940) found a feature in
the thermal structure which he described as an eddy. A
later study by Spilhaus (1941), in which he mapped the fine structure of the surface temperature over an area of about five hundred square miles, showed an interfingering of warm and cold water along the inshore edge of the current. The
complexity of the temperature structure led him to conclude that the supposed smoothness of the onshore edge was merely a statistical view of many such interfingerings.
Second World War was the development of Loran, a naviga-tional system which enabled the position of a ship to be
determined by electronic means. The scales of time-variations of Gulf Stream structure made such a position-finding device necessary before quantitatively significant studies could be made of them. By providing nearly continuous and reasonably
accurate knowledge of a ship's position in the Gulf Stream
region, Loran permitted more detailed determinations of
cur-rents, by comparison of radio and dead-reckoned positions,
than had been possible with celestial navigation.
Surveys over large regions, using Loran,
re-vealed new aspects of the time variations of the Gulf Stream
system. In post-war studies, Iselin and Fuglister (1948) found eddies on both side of the Gulf Stream: cyclonic eddies to the right of the main current and anti-cyclonic eddies to the left, looking downstream. These eddies appeared to be meander loops which had broken off from the Gulf Stream
proper. An eddy observed during June, 1947 had an east-west length of 200 miles and a north-south length of 60 miles. Iselin and Fuglister also found meanders with increasing amplitude downstream from Cape Hatteras, in accord with Church's conclusions. Because of these meanders, they
con-cluded that it was not possible to tell from a single section whether the regional trend of the Gulf Stream was north or south of its mean position. Consequently, it became doubtful that the stream really underwent seasonal north-south
-tions, as Hachey had concluded on the basis of data from individual sections.
The development of the geomagnetic
electro-kinetograph (GEK) by von Arx (1950) provided a swift method
for measuring surface currents from a ship while underway. Together, the GEK and the bathythermograph could be used to determine the velocity and the temperature structure of the surface layer from a research vessel cruising at normal speed.
These newly developed methods of measurement and navigation were combined in Operation CABOT, a multi-ship exploration of the surface layer of the Gulf Stream between Cape Hatteras and the Grand Banks of Newfoundland, during June, 1950. The observations (Fuglister and Worthington,
1951) showed a meander structure which increased in amplitude
beyond Cape Hatteras. The formation of an anti-cyclonic eddy, from the breaking off of a meander to its separate identity, was followed step-by-step during a twelve day period. In addition, cyclonic eddies were observed north of the stream. Data from Operation CABOT revealed "gobs" of warm water in the Gulf Stream which seemed to the authors to indicate a pulsing action, perhaps related to some short period variations in the transport.
In a further examination of the CABOT data, Ford, Longard and Banks (1952) noted a narrow filament of cold, relatively fresh water along portions of the left-hand side
-16-evident that this water did not come from depth, but
originated on the continental shelf north of Cape Hatteras, possibly as river run-off. Although a cold filament was not
observed on every crossing along the whole length of the left hand edge, it might have been missed because the inter-val between half-hourly BT's is long enough to completely
miss a filament whose width is less than five miles. In a
study of the surface temperature profiles of one hundred crossings of the Gulf Stream, Strack (1953) found the cold filament to be present generally, but often wider than obser-ved by Ford, et al.
von Arx (1952) and Worthington (1954) made a detailed study of the velocity profile and density structure on several crossings of the Gulf Stream south of Cape Cod. Their studies were intended both to provide typical details of surface velocity and density across the Gulf Stream and to test and compare the newly developed techniques for current measurement. Their characteristic profile had a sharp region
of cyclonic shear to the left of the current maximum (looking downstream) and a broad region of anti-cyclonic shear to the right. The cyclonic shear was usually greater than the value
of the Coriolis parameter and the anti-cyclonic shear less. Fuglister (1951), showed that the data collected during Operation CABOT could be interpreted as a series of laterally overlapping currents separated by weak counter-currents. Re-analysis of several additional sets of data
that the interpretation of hydrographic observations of con-ventional horizontal scale was ambiguous; instead of giving a unique picture of current structure, these measurements
cannot be used to distinguish between a single meandering current and a set of loosely connected currents and counter-currents. This ambiguity leaves an element of subjectivity
to the scientist.
Partly in an effort to resolve this ambiguity, optical measurements of sea-surface temperature were under-taken from an airplane (Stommel, von Arx, Parson, and
Richardson, 1953). A two-day aerial survey of the Gulf Stream System from the Florida Straits to longitude 70'W
(von Arx, Bumpus, and Richardson,
1955)
revealed a pattern of sea-surface temperatures corresponding to a shingled structure of overlapping, discontinuous segments, having lengths of a few hundred kilometers. So far as could bedetermined from the air, there was no continuous stream. The discontinuities were found both downstream and upstream from Cape Hatteras, and the general pattern was compatible with a
multiple-current theory.
A different approach to the study of the Gulf Stream current was devised by Malkus and Johnson (1954). In an attempt to determine the nature of possible formation of multiple branches of the current, a ship was allowed to drift with the current while measurements of the water properties
- 18
-the structure of -the stream relative to -the ship would indi-cate a possible branching or meandering and thus partially resolve the ambiguity of the data. They found that the ship eventually drifted out of the main current, and that a run of several tens of kilometers westward was generally necessary to find a strong current again. The cruise underscored the need for more than one ship at any one time in order to pro-duce unambiguous results.
Stimulated by the temperature pattern observed
from the air, von Arx, Bumpus and Richardson (1955) developed a procedure for observing the continuous passage of the Gulf Stream across a section. Sailing back and forth along a single line, they charted the changes with time of tempera-ture, salinity and velocity. The observations, taken near Onslow Bay, just south of Cape Hatteras, again gave evidence of a meander structure, but the sparseness of the data
pre-vented its clear definition.
The character of the flow through the Florida
Straits as revealed by an extensive series of observations is
apparently different from that farther downstream off Cape Hatteras. Most investigators have concluded that the
prin-cipal variations in the flow are produced by tidal influences.
Pillsbury made time studies of the variatiorsin current
strength which led him to conclude that they were tidally
induced. In a series of anchor stations made in the Straits of Florida between Miami, Florida and Gun Cay, Bahamas, Parr
(1937) also found what he considered to be strong diurnal, and hence tidal, variations in the temperature and salinity fields.
The University of Miami Marine Laboratory has conducted an extensive program of GEK measurements of
velocity in the Straits of Florida during the past ten years.
Their studies (Murray, 1952; Wagner and Chew, 1953; Hela,
Chew and Wagner, 1954; Chew, 1958) have indicated an apparent
tidal fluctuation in the velocity and transport as well as
tidal transverse motions. In addition, they note non-tidal
variations which are difficult to isolate.
von Arx, Bumpus and Richardson (1955) calculated
that the Straits of Florida transport could vary by as much as a factor of two as a result of the changing hydraulic
heads associated with the rise and fall of the diurnal tide
in the Gulf of Mexico. They went on to speculate that the daily variation in the flow through the Straits of Florida might be related to the formation of the discontinuous "shingles" which had been observed further downstream. It was possible, they suggested, that each shingle represented
a single day's outflow from the Gulf of Mexico.
Theoretical Studies. Theoretical studies which
aim to explain the behaviour of the Gulf Stream meanders
have been conducted mostly during the last fifteen years. Rossby (1936) postulated that the Gulf Stream flow was
- 20
-analogous to that of a turbulent jet. Such a flow would interact with the surrounding water by turbulent mixing. One might expect to find eddies, or meanders, which would
dissipate energy. Observations have failed to disclose a
consistent downstream increase in the stream or the counter-currents necessary to sustain such a flow.
Stommel (1948) developed dynamical reasons for an intensification of western boundary currents. The cur-rents should provide a mechanism for the dissipation of large amounts of kinetic energy. Munk (1950) developed a relation between such currents and the regional wind stress. In these models, meanders could possibly provide the
necessary frictional dissipation. However, though the theoretical models of Stommel and Munk required that the North Atlantic currents should be concentrated in the west, the required currents did not need to be filamentary. The western boundary current could be entirely satisfied by the
statistical or climatological mean Gulf Stream, and the
narrow, filament-like structure could be induced by other causes. Thus, although it was possible to incorporate meanders into a frictional boundary current theory, their
role was uncertain.
The possibility that a mathematical model based
on the unstable flow of a narrow current might provide a dynamical explanation of the observations encouraged some theoretical studies. Haurwitz and Panofsky (1950) con-structed a mathematical model of a narrow current flowing
near a wall (representing the edge of the continental shelf)
in which the cross-stream profile of downstream velocity was specified. They supposed that the character of the horizon-tal shear of the mean flow might render it unstable to small perturbations, and found that waves could grow by drawing energy from the mean flow provided that the current had left
the vicinity of the continental shelf. This result was in
accord with the belief that the meanders south of Cape Hatteras were negligible. Haurwitz and Panofsky did not take any account of bottom topography.
Stommel (1953) investigated the meanders which could occur in a wide current in a two-layer ocean. He
specified the steady current velocity by giving the form of
the interface. He then examined the effect of infinitesimal perturbations of the mean current. Stommel did not intend his theory to be realistic; he merely was attempting to determine the effect of horizontal divergence in stratified currents. Nevertheless, characteristic values of physical parameters did yield a critical wavelength (180 km) which corresponded to that of a meander observed during Operation
CABOT (Fuglister and Worthington, 1951).
Saint-Guily (1957) made a theoretical study of the formation of meanders and their development into eddies, in an attempt to explain the observed break-off of an eddy
from the main stream during Operation CABOT. Saint-Guily
- 22
-instability of a meandering current, but did not make
par-ticular applications to the observed Gulf Stream.
Newton (1959), stimulated by a suggestion of
Rossby that atmospheric and oceanic current systems are similar, made a comparison between the Gulf Stream and the atmospheric jet stream. He found equivalences between
dis-tance and velocity scales, meander sizes, lateral shears,
and thermal structure in the two systems.
Summary. The picture of the Gulf Stream which
has emerged at the present is that of a narrow discontinuous current which begins to meander somewhere in the region of Cape Hatteras. As it progresses northeastward from Cape Hatteras, the meanders increase in amplitude.
The results of ship observations can be inter-preted in more than one way. Equally valid patterns ranging from a single contorted unbroken current to a whole series of independent unconnected currents can be obtained depending on the choice of the analyst. The only means for resolving
this ambiguity seems to be an extensive, nearly simultaneous
network of observations.
Whatever interpretation one chooses to give to ship observations, it is apparent, at least beyond Cape Hatteras, that the Gulf Stream does not flow regularly or smoothly. The behaviour of the Gulf Stream upstream from
flow is so close to the shore, there is little opportunity for large amplitude meanders to develop. This restriction of amplitude may be a benefit for the oceanographer, since small amplitude meanders can be sectioned more frequently and studied with a far higher degree of control than is possible farther downstream.
The present study reports on a month's surface observations of the current off Onslow Bay, south of Cape Hatteras. It was hoped that these continuous observations would answer the questions: (1) Does the Gulf Stream
meander south of Cape Hatteras, and if so, what is the structure of the meanders? (2) What is the role of the meanders with respect to the mean flow?
PART I
A DESCRIPTION OF GULF STREAM MEANDERS OFF ONSLOW BAY
ABSTRACT
Data from a month of continuous surface obser-vations across the Gulf Stream show a periodic time
varia-tion in the posivaria-tion of the current. The region studied
is off Onslow Bay, North Carolina, where the current is
close to the edge of the continental shelf. The dominant
periods of the position variations correspond to the periods
of offshore winds. The amplitude of these dominant
varia-tions, or meanders, is 10 km. Lunar components, either
monthly or diurnal, have amplitudes which are, at most, small in comparison with those of the principal meanders.
Although the meanders off Onslow Bay may be analogous to the multiple currents found downstream, their periods eliminate them as incipient forms of the
large-scale meanders. An average section of velocity and tempera-ture during the month of observation is presented.
1. Introduction
Meanders are among the most intriguing and
baffling aspects of the Gulf Stream System. Although meanders north of Cape Hatteras have been the subject of a certain amount of study, little is known of their be-haviour between the Florida Straits and Cape Hatteras, where the Gulf Stream flows close to shore over the Blake Plateau. This region would probably be a fruitful one for study, since the amplitude of meanders is constrained by
the nearness of the main current to the continental shelf. In order to seek information on meanders in
this region, a month-long cruise was made in the research vessel CRAWFORD by W. S. von Arx, D. F. Bumpus and C. G. Day during May and June, 1958. The ship made 120 consecu-tive crossings of the axis of the Gulf Stream during a
28-day period. Figure 1 shows the path of the sections.
Point "A" is the intersection of the path with the axis of
the climatological mean Gulf Stream, as estimated by the
United States Coast and Geodetic Survey. Measurements were made of the surface salinity and velocity, and of the
temperature to a depth of 200 meters. The general
proce-dure of this cruise was similar to one undertaken by von
Arx, Bumpus, and Richardson (1955) in the research vessel CARYN, but the duration and concentration of measurements
RALEIGH BAY CHARLESTON 810 800 79 0 )CAPE HATTERAS DIAMOND SHOALS TLIGHTSHIP /
I1l
(A
FRYING PAN SHOALS LIGHTSHIP.,-' /
,00
C)
ofos
____ - __ ___ ____ ___ ____ ___ 330 320 - -310 780 770 760 750 740 Figure 1Onslow Bay area
Because the observations were restricted to a single lunar month, only a relatively small portion of the
spectrum of Gulf Stream time variations could be sampled.
Moreover, the time necessary to complete a single crossing of the current was about six hours, and hence the frequency
of sections was too low to permit semidiurnal tidal effects to be measured. By extending the duration of measurements to 28 days, it was hoped that the lunar monthly effects, if any, could be observed. Hence, the data are most useful for determining the characteristics of time variations having periods greater than a day and less than a month.
2. Basic Data
Throughout the cruise, a bathythermograph (BT) measurement, giving temperature as a function of pressure to a depth of 200 meters, was taken every half-hour. At the time of each BT lowering, a bucket sample of surface
water was taken, to be analyzed later for salinity. The
surface water velocity vector was determined hourly, by means of the geomagnetic electrokinetograph (GEK) (von Arx, 1950). The position of the ship at each BT and GEK observa-tion was determined by a LORAN fix, to confirm the choice of ship's course to keep as close as possible to the planned
cruise line. Each crossing was continued across the current
as far as was necessary to define the onshore edge of the band of maximum velocity.
- 28
-The observations were plotted to form a set of
space-time diagrams: namely those in which the values along
the line of traverse were plotted against time of observa-tion. Isopleths were drawn to connect the sections. These space-time diagrams bear some resemblance to the pattern of the stream as it might be if viewed from above. This
resemblance is easily misinterpreted when analyzing the data, since there is an erroneous tendency to interpret the time
axis as a space axis. Changes of the current in time at a
point are not, of course, necessarily dependent upon the spatial variation of the current. Hence, when reading a space-time diagram, it is well to remember that the long axis represents time, not distance.
First, the particular features of each of the
space-time diagrams will be discussed. Then, the diagrams will be considered as a group, and their general features
will be described.
Surface Temperature. The surface temperatures were measured by means of a thermistor bead mounted in the bow of the CRAWFORD about two feet below the water line. The resistance of the bead was recorded continuously on a strip chart recorder calibrated for temperature. This per-mitted the sharp temperature gradients to be well located
in space and time. The temperature records for the crossings were plotted as profiles on the cross-sections (see Appendix,
Section 7). From these 120 profiles, the space-time
dia-gram, Figure 2, has been constructed. The straight, slanting lines across the face of the diagram represent the path of the ship in space and time. Along this path,
the temperature was measured continuously; between path lines, the isotherms were contoured smoothly.
The surface temperatures were particularly sus-ceptible to seasonal warming during the period of CRAWFORD
Cruise 18. The maximum temperature at the beginning of the
cruise was about twenty-five degrees Centigrade, and at the end of the cruise, the maximum temperature was about twenty-eight degrees. This seasonal, or vernal, warming tends to diminish the surface-temperature contrast across the Gulf Stream and make the definition of the stream edges more
difficult. In spite of the major handicap of vernal warming, the surface temperatures are nevertheless useful because they can be compared with the other physical quantities such as current velocity and salinity which were in general measured only at the surface.
100-meter Temperature. The 100-meter temperatures on the space-time diagram (Figure
3)
are bathythermograph(BT) data. Since BT lowerings were made at half-hourly
intervals, the actual temperature gradients at a depth of 100 meters may have been much sharper than the necessarily smoothed
1/NE
23 24 25 26 27 I I I I I 28 29 30 I 31 I 1 2 3 4 5 6 7 8 9 10 1 12 1,3 1,4 1,5 1,6 17 1,8I
A ' f -II I It 11Ul I 1A A A A 1 A-- 0w
0 -20 3~ 26 -<25 2 -40 22 22 24 ONSHORE Figure 2
-30 20- -20 NAUTICAL NAUTICAL 10~-- 0 MILES MILES 0 2 - A -151 -R 30- 15 30 40- _40
ONSHORE TEMPERATURE IN *C ONSHORE
iurI I | |
-Figure 3
- 32
-relatively unaffected by vernal warming, so that it is more
useful than surface temperature for comparison of the
structure of the current between different portions of the cruise.
The lower stippled boundary of this diagram represents the position of the continental slope at a depth of 100 meters. The fluctuations in its position are due to uncertainties in position measurements and deviations of the ship's course from the cruise line.
Depth of 20-degree Isotherm. The topography of the 20-degree (Centigrade) isotherm (shown in Figure4) was also drawn from BT observations. It was plotted as an attempt to determine the internal motions associated with meanders of the current. 201C was chosen because shallower
isotherms were subject to the distortions of vernal warming and deeper isotherms often dropped below the depth accessi-ble to the BT.
Surface salinity. The surface water samples,
which were routinely taken at the time of each BT lowering, were analyzed on a Schleicher-Bradshaw conductivity bridge.
(Schleicher and Bradshaw, 1956.) The surface salinity, shown in Figure
5,
is determined on the assumption of adirect relation between conductivity and salinity, for which
-30 20-20 NAUTICAL NAUTICAL M/ 0 16 o MLES \0 \ 0 '-vy 0 1 20 30 -30 40 -40
ONSHORE DEPTHS IN METERS ONSHORE
I I I I I I I I I T ONSHORE
Figure 1.
MAY I/UNE 20 211 22 23 24 25 26 27 28 29 30 31 1 2 3 4 5 6 7 8 9 10 1 12 13 14 15 16 17 18 OFFSHORE OFFSHORE 30- -30 20 -20 WTICAL NAITCAL MILES 30 -. 36.0 35.0 305 3.0-0 20- 0 -20 36\036.0 30- -6 55--30
ONSHORE SALINITIES IN */.. 60 _b_ . ONSHORE
Figure
5
General Features of the Space-Time Diagrams. Each of the space-time diagrams shows a series of meanders
of the stream. The surface temperature diagram shows
periodic occurrences of a sharp temperature gradient across the section. These sharp temperature gradients seem to form at an offshore position and to move onshore as time increases, generally becoming more intense. Since the direction of
current flow is exactly opposite to the direction of in-creasing time, the current is actually flowing offshore,
decreasing in intensity as it does so. A region of sharp
temperature gradient is followed by a broad diffuse
tempera-ture gradient region which once again reforms into another
offshore sharp gradient.
Surface readings, though suggestive, are not sufficient for delineating the meanders because the surface layer is influenced both by vernal warming and by shifting winds. Consequently, the temperature at a depth of
100-meters and the depth of the 20'C isotherm, are more useful in
defining the center of the Gulf Stream and its edges. It is
found, upon comparing the surface velocity with the 100-meter temperature, that the position of the 2010 isotherm at 100 meters depth corresponds closely with the path of maximum
downstream velocity as defined by the GEK on each crossing (Figure 6). Hence, it is possible to define a center of the stream using either the BT or the GEK; either the 201C iso-therm at 100 meters depth or the maximum velocity across the
MAY J/UNE
20 2R 22 23 24 25 26 27 28 29 30 3R 1 2 3 4 5 6 7 8 9 M0 11 2 1,3 14 115 16
I I I I I I I I I I i
Figure 6
Position of stream center, CRAWFORD Cruise 18
OFFSHOR
3 0
-,
200C. ISOTHERM AT 100 METER DEPTH
-VELOCITY MAXIMUM
section may be chosen as the center of the stream in Onslow Bay.
3. Analysis of the Data
Cold Tongues. Together, the surface temperature and salinity define bands, or tongues, of water both colder
and less saline than that on either side.
These tongues are found shoreward of the stream center. It will be noted that towards the end of the cruise,
the salinity record shows another of these offshore-running tongues, but that the surface temperature record defines it only poorly. This is probably an effect of vernal warming, which gives a clue to the origin of the water in the tongues. A similar warming during this period was noted at Frying Pan Shoals Lightship, between Long Bay and Onslow Bay, where, between May 15 and June 15, the surface temperature
in-creased from 190c to 25 c.
In addition to the temperature, the salinity also gives a clue to the origin of the water in the tongues. Both the water temperature and salinity correspond generally to that of the onshore Carolina Bays: Raleigh, Onslow and
Long Bays. The temperature and salinity of the water in these
regior were recorded during the cruise at lightships and have been tabulated by Day (1959).
Table I shows the temperatures and salinities as measured in the fresh cold tongues in the Gulf Stream and at
TABLE I
Comparison between lightship surface salinities and temperatures
and those found in cold tongues during CRAWFORD 18 Cruise.
(salinities in parts per thousand, temperatures in degrees Centigrade)
CRAWFORD tongue
18 Frying Pan Shoals 2 days earlier Frying Pan Shoals S avannah May 24 - 25 May 28 - 29 May 31 - June 2 June 10 - 11 June 15 - 17 Diamond Shoals 22.5 34.0 23.0 32.5 22.0 34.0 23.5 33.5 26.0 33.0 21.5 34.0 22.5 33.0 22.0 34.0 23.0
33.5
26.0 34.0 22.035.0
22.0 35.0 24.035.0
24.0 33.0 25.0 31.0 31.0 24.0 31.5 24.0 30.0 27.0 32.0 26.0 32.0 21.5 31.5 22.0 31.5 21.533.5
DATEthe same time of the waters at Frying Pan Shoals and Savannah Lightships, both south of Onslow Bay, and at Diamond Shoals, north of Onslow Bay (Figure 1). The water
at Savannah Lightship is warmer and fresher than the water
in the tongues, which eliminates it as a source of tongue water. The salinity of the water at Savannah a few days
before the appearance of a cold tongue is always fresher
than that in the tongue by about three parts per thousand. The temperature and salinity are generally less at Diamond Shoals than in the tongues. Temperatures and salinities more compatible with those found in the tongues are found
in the waters at Frying Pan Shoals. If this is indeed
the source, best agreement is found when the values of temperature and salinity at Frying Pan Shoals are compared
with those in the tongue at Onslow Bay two days later. To illustrate the contrast between the shelf water and the water characteristic of the Gulf Stream in
this region, note that the salinity of the water on the sea-ward side of the stream is consistently about 36.25 0
/oo
and the temperature ranges from 25* to 28'C. This is also typical of water in the main current on the shoreward side
of the maximum flow. Hence, it appears that the water in the tongues is shelf water which has been entrained into the shoreward edge of the Gulf Stream current. The source of the tongue water is just south of the section under
con-clusions of Bumpus (1955), and Bumpus and Pierce (1955), that when the Florida Current moves inshore it will entrain shelf water. Other investigators have found similar occur-rences of fresh and/or cool water. Ford, Longard, and
Banks (1952) reported a slender filament of cold water along the shoreward edge of the Gulf Stream, downstream from Cape
Hatteras. From the salinity of the filament, they concluded
that its source was river runoff from the shelf near Cape
Hatteras. Similarly, Hela, and Wagner (1954) report the occurrence of relatively fresh water on the western side of the Florida Current, off Miami, which seems to originate in the north-east area of the Gulf of Mexico.
The structure of the meanders as shown in the
space-time diagrams suggests that each meander forms
on-shore and moves offon-shore as it flows downstream. As each meander flows offshore shelf water remains entrained along
its shoreward side. If the meanders in the Onslow Bay region are characteristic of those throughout the Gulf Stream System, then we should expect to find water from a near-shore region generally present along the inshore edge
of the current.
Periodic Components of Meanders. The Fourier components of the fluctuation positions of both the velocity maximum and the 20-degree isotherm at 100 meters depth were
calculated. The lunar month of 27.55 days was chosen as a
determined at
48
equi-distant points during the month toestablish a 48-ordinate scheme for harmonic analysis, as
outlined by Conrad and Pollak (1950). The amplitudes of the components, up to the 12th harmonic, are shown in Figure 7. The dominant harmonics are the fourth and the seventh, corresponding to periods of 6.9 and 3.9 days. There is no apparent reason to expect that the dominant harmonic components should be exact sub-multiples of a lunar month; hence the periods showing this characteristic should be regarded only as approximate. However, the
prominent components have periods of the order of a week and amplitudes of about ten kilometers. It should be stressed that these harmonic components refer only to the CRAWFORD Cruise 18 data; there is no evidence to indicate that these same periods and amplitudes would be found on
another cruise.
Significantly, the amplitudes of the monthly
(first harmonic) and fortnightly (second. harmonic) components are comparatively small, being less than 2 nautical miles
(3.7 km). Their unimportance indicates that the meanders are not induced primarily by long-period lunar effects.
A possible cause of the seven-day and four-day
recurrence of meanders is revealed in a comparison of the
meander positions, as indicated by the 200C isotherm, with
the atmospheric pressure field during the period of obser-vations. The sea-level barometric pressure difference
be-AMPLITUDES OF PERIODIC COMPONENTS
NAUTICAL
MILES
NAUTICAL
MILES
2. VELOCITY MAXIM 20Cm. DEPTH WAVE \\ 2 NUMBER UM WAVE 19 NUMBER Figure 7Harmonic components of meanders
tween Charleston, South Carolina, and Cape Hatteras was used as an index of the offshore wind. A higher pressure at
Hatteras corresponds to an onshore wind. Figure 8 shows the position of the 20-degree isotherm at 100 meters and the Hatteras-Charleston atmospheric pressure difference. There
is an obvious similarity in periods, but no clear indication of synchronism. If it is assumed that there is a delay in
the response of the stream position to persistent winds, then the atmospheric pressure difference can be lagged. Figure 9 shows the result of introducing a lag of four and a half days, which gives the best correlation between atmos-pheric pressure and stream position. The stream position shown in Figure 9 was obtained by combining the dominant harmonic components (4th,
5th,
and 7th) found in the Fourier analysis. The downstream wind was, during the cruise, more persistent than the offshore wind. An attempt to find a similarity in periods between the downstream wind andmeanders failed, suggesting that the physical significance of the correlation between offshore winds and meanders is open to question.
Although the data are not suitable for analysis
of diurnal components, it is evident from the space-time
diagrams that the passage of each of the principal meanders
(or shingles) is not a diurnal phenomenon, but requires a
period of several days. It seems likely that, because of their relatively long time of passage, the meanders off
I I' I' I' I' MILLIBARS ONSHORE 5 - -NAUTICAL \\ MILES A - -2
/\
10, 20 \24 28 \ l5 913 17 0 . A \ It I' I I'I /\ I 253 20 - 20-22 59j~~ OFFSHORE\/ I \/ -STREAM POSITION--- ATMOSPHERIC PRESSURE DIFFERENCE Figure 8
-5 Atmospheric pressure difference between Cape Hatteras
and Charleston, and position of stream center during CRAWFORD Cruise 18
mb. -5 10- -4 -3 -20 24 128 |.. 5 31 0 - \ _ yl 10 - , - -4 MEANDER POSITION
--- ATMOSPHERIC PRESSURE DIFFERENCE -5
15gr
Figure 9
Onslow Bay are not related to the daily outflow from the
Gulf of Mexico, as suggested in the hypothesis advanced by
von Arx, Bumpus, and Richardson (1955).
Characteristics of an average Gulf Stream. The
Onslow Bay observations were further combined to portray an average cross-section of the surface layer temperature
structure and the surface velocity profile for the period of
the survey. The average velocity profiles (u), (v), and the
average temperature structure are shown in Figure 10. Any characteristic instantaneous profile would have much steeper
temperature and velocity gradients,for when time averages are taken of a shifting steep gradient, the gradient is
blurred and tends to flatten out. This has been
illus-trated by Fuglister (1954) with respect to climatological temperature averages.
Any velocity, when measured with the GEK, is
less than the actual surface water velocity by a factor which depends upon the depth of moving water in relation to the total depth of water. Because these depths cannot readily be measured, the factor is commonly determined empirically
by calculating surface velocities from the discrepancies between Loran and dead-reckoned positions. For the region of the Gulf Stream off Onslow Bay, it was found (von Arx, Bumpus, and Richardson,
1955)
that the GEK velocitiesIO
5 OFFSHOREFigure 10
Cross-section of average current
200f DOWNSTREAM VELOCITY
100-
0L-ONSHORE Or25
1 5
i "I50
1001
|50 - METERS 20 i 20 1velocities as determined by dead-reckoning. All the GEK velocities obtained during CRAWFORD Cruise 18 have been multiplied by this factor.
The cyclonic shear of the average velocity
in-shore of the velocity maximum is about 4.4 x lo-5se-1,
and the anti-cyclonic shear of the average velocity offshore is about 3.0 x lo-5sec-1. For comparison, the Coriolis
parameter at this latitude is 8 x lo-5sec-l. The cyclonic shear of the average velocity is much lower than the
cyclonic shear of individual crossings. von Arx (1951) gives individual values as high as
50
x lo-5sec-1 forinstantaneous cyclonic shears, and some instantaneous shears encountered on CRAWFORD Cruise 18 were as large. The lower value results from the long-term averaging, so
that the cyclonic shear of the average current for the month observed is less than the Coriolis parameter. To be
realistic, a theory of the Gulf Stream should probably not imply a climatological average cyclonic shear in excess of about
5
x lo-5sec-1 in this region.Comparisons with meanders farther downstream.
The surface meander pattern in Onslow Bay as shown in the space-time diagrams has some similarity with the large-scale
current pattern farther downstream. Fuglister (1951)
pre-sented an interpretation of the Gulf Stream beyond Cape
here are similar to the multiple currents because they
appear to be more nearly a set of disconnected currents than a single current; each offshore-running current maximum
seems to evolve anew rather than to be a continuation of a pre-existing current maximum. However, the space and
time scales of the meanders off Onslow Bay are far different from those of the multiple currents beyond Cape Hatteras.
There are only three or four currents comprising the multi-ple current system between Cape Hatteras and the Grand
Banks. The length of each current is a thousand kilometers or more, whereas the meanders off Onslow Bay probably have a length of the order of a hundred kilometers. The mul-tiple current pattern is either a permanent structural feature of the flow, or persists for a period of several months; the Onslow Bay meanders, on the other hand, pass by at a rate of one each week.
Although there is uncertainty about the inter-pretation of the Gulf Stream currents between Cape Hatteras
and the Grand Banks, (Fuglister,
1955)
it seems likely that currents in the region contain large-scale meanders (Iselin and Fuglister, 1948; Ford and Miller, 1952; Fuglister and Worthington,1951).
Such large-scale meanders are not an evolved form of the meanders observed off Onslow Bay. The meanders downstream from Cape Hatteras give the appearance of an amplifying disturbance (Fuglister and Worthington,- 50
-meanders excited upstream from Cape Hatteras and those which become amplified downstream would have similar periods.
Since the time scale of the large-scale meanders appears to be at least an order of magnitude larger than the week-long periods observed off Onslow Bay, the meanders observed at
Onslow Bay during the course of one month are probably not an incipient form of the larger meanders found farther
down-stream. If the large-scale meanders do have their origin
upstream from Cape Hatteras, and have a period longer than a month, observations should be extended over several
months to distinguish them.
An idealized meander. The thermal structure of the upper 200 meter layer may be determined from the BT data. In order to show this structure more clearly, an idealized
diagram has been drawn, in space and time, which combines
some features common to all the meanders. Figure 11 is a diagram of the thermal structure of an idealized meander, in which the period of the meander was chosen to be seven days. Each of the meanders resembles a sort of skewed wave motion and consists of an intense offshore-running current,
followed by a broad, confused flow onshore, then followed by another intense offshore current. The observations taken were not suitable to determine whether the cold subsurface water coinciding with the farthest offshore positions of the current maximum represents upwelling or not.
80
7 6 5 4 3 2 I 0
--- DAYS
Figure 11
Acknowledgements
The writer wishes to acknowledge the advice and
encouragment of W. S. von Arx, who first suggested that
this study be undertaken. Thanks are also due to B. A. Warren
for helpful criticisms. The data used were collected under the direction of W. S. von Arx, with the assistance of D. F. Bumpus and C. G. Day. Much of the data reduction was per-formed by Mrs. N. Andersen. The work was made possible by funds aupplied by the Office of Naval Research, under con-tract Nonr2196(oo).
References
Bumpus, D. F. (1955), The circulation over the continental
shelf south of Cape Hatteras. Thans. Amer. Geophys.
Union, 36 (4), 601-611.
Bumpus, D.F., and Pierce, E.L. (1955), The hydrography and the distribution of chaetognaths over the
continen-tal shelf of North Carolina. Pap. Mar. Biol. and
Oceanogr., Suppl. Deep-Sea Res., 3, 92-109.
Conrad, V., and Pollak, L.W. (1950), Methods in Climatology,
Cambridge, U.S.A., Harvard University Press,
459
pp.Day, C.G. (1959), Oceanographic observations, 1958 East
Coast of the United States. United States Fish and Wildlife Service, Special Sci. Rept., Fisheries No. 318, 119 pp.
Ford, W.L., Longard, J.R., and Banks, R.E. (1952), On the
nature, occurrence and origin of cold low salinity
water along the edge of the Gulf Stream. Jour. Mar.
Res., 11 (3), 281-293.
Ford, W.L., and Miller, A.R. (1952), The surface layer of the
Gulf Stream and adjacent waters. Jour. Mar. Res., 1.1,
(3), 267-280.
Fuglister, F.C. (1951), Multiple currents in the Gulf Stream System. Tellus, 3 (4), 230-233.
54
-Fuglister, F.C. (1954), Average temperature and salinity at a depth of 200 meters in the North Atlantic. Tellus,
6 (1),
46-58.
Fuglister, F.C. (1955), Alternative analyses of current
sur-veys. Deep-Sea Res., 2 (3), 213-229.
Fuglister, F.C., and Worthington, L.V. (1951), Some results of a multiple ship survey of the Gulf Stream. Tellus, 3 (1), 1-14.
Hela, I., and Wagner, L.P. (1954), Note on tidal fluctuations in the Florida Current, in: Marine Lab., Univ. of
Miami, Tech. Rept., No.
54-7,
14-24.Iselin, C. 0'D., and Fuglister, F.C. (1948), Some recent developments in the study of the Gulf Stream. Jour. Mar. Res., 7 (3), 317-329.
Schleicher, K.E., and Bradshaw, A.L. (1956), A conductivity bridge for measurement of the salinity of sea water.
Journ. du Cons., 22 (1), 9-20.
von Arx, W.S. (1950), An electromagnetic method for measuring
the velocities of ocean currents from a ship under way.
Pap. Phys. Oceanogr. Meteor., 11 (3), 1-62.
von Arx, W.S. (1951), Some measurements of the surface
Inst., Tech. Rept. Ref. No.
51-96
(unpublishedmanuscript).
von Arx, W.S., Bumpus, D.F., and Richardson, W.S. (1955),
On the fine structure of the Gulf Stream front. Deep-Sea Res., 3 (1),