HAL Id: hal-01872421
https://hal.umontpellier.fr/hal-01872421
Submitted on 12 Sep 2018
HAL is a multi-disciplinary open access
archive for the deposit and dissemination of
sci-entific research documents, whether they are
pub-lished or not. The documents may come from
teaching and research institutions in France or
abroad, or from public or private research centers.
L’archive ouverte pluridisciplinaire HAL, est
destinée au dépôt et à la diffusion de documents
scientifiques de niveau recherche, publiés ou non,
émanant des établissements d’enseignement et de
recherche français ou étrangers, des laboratoires
publics ou privés.
bats’ exceptional longevity
Nicole Foley, Graham Hughes, Zixia Huang, Michael Clarke, David Jebb,
Conor Whelan, Eric Petit, Frédéric Touzalin, Olivier Farcy, Gareth Jones, et
al.
To cite this version:
Nicole Foley, Graham Hughes, Zixia Huang, Michael Clarke, David Jebb, et al.. Growing old, yet
staying young: The role of telomeres in bats’ exceptional longevity. Science Advances , American
As-sociation for the Advancement of Science (AAAS), 2018, 4 (2), pp.eaao0926. �10.1126/sciadv.aao0926�.
�hal-01872421�
G E N E T I C S Copyright © 2018 The Authors, some rights reserved; exclusive licensee American Association for the Advancement of Science. No claim to original U.S. Government Works. Distributed under a Creative Commons Attribution NonCommercial License 4.0 (CC BY-NC).
Growing old, yet staying young: The role of telomeres
in bats
’ exceptional longevity
Nicole M. Foley,1Graham M. Hughes,1Zixia Huang,1Michael Clarke,1David Jebb,1 Conor V. Whelan,1Eric J. Petit,2 Frédéric Touzalin,3Olivier Farcy,4 Gareth Jones,5
Roger D. Ransome,5Joanna Kacprzyk,1Mary J. O’Connell,6Gerald Kerth,7Hugo Rebelo,5,8,9 Luísa Rodrigues,10Sébastien J. Puechmaille,1,7Emma C. Teeling1*
Understanding aging is a grand challenge in biology. Exceptionally long-lived animals have mechanisms that underpin extreme longevity. Telomeres are protective nucleotide repeats on chromosome tips that shorten with cell division, potentially limiting life span. Bats are the longest-lived mammals for their size, but it is unknown whether their telomeres shorten. Using >60 years of cumulative mark-recapture field data, we show that telomeres shorten with age inRhinolophus ferrumequinum and Miniopterus schreibersii, but not in the bat genus with greatest longevity, Myotis. As in humans, telomerase is not expressed in Myotis myotis blood or fibroblasts. Selection tests on telomere maintenance genes show thatATM and SETX, which repair and prevent DNA damage, potentially mediate telomere dynamics inMyotis bats. Twenty-one telomere maintenance genes are differentially expressed in Myotis, of which 14 are enriched for DNA repair, and 5 for alternative telomere-lengthening mechanisms. We demonstrate how telomeres, telomerase, and DNA repair genes have contributed to the evolution of exceptional longevity inMyotis bats, advancing our understanding of healthy aging.
INTRODUCTION
Aging is the gradual and irreversible breakdown of living systems due to the progressive deterioration of physiological function that causes an increase in susceptibility to disease and eventual mortality (1). Although the mean human life span in the European Union and United States is currently 78 years, and increasing by ~2 years per dec-ade, the age of onset of age-related degenerative diseases appears sta-tionary (for example, 77% of age-related cancers occur over 50 years of age) (2). Therefore, we urgently need to better understand the mecha-nisms of the aging process, with a view to improving the future quality of life of our aging populations (2, 3). Most aging studies have been carried out in shorter-lived laboratory model species, given the ease of manipulation, housing, and length of life span (4, 5). Although they are excellent study species, it is difficult to extrapolate experimental findings in these short-lived laboratory species to long-lived, outbred species such as humans (6). Therefore, it has been argued that long-lived, outbred species such as bats may be better models to investigate the aging processes of relevance to people (4).
Only 19 species of mammal are longer-lived than humans given their body size, and 18 of these species are bats (7). Bats are the longest-lived mammals relative to their body size (Fig. 1), with the oldest bat recap-tured (Myotis brandtii) being >41 years old, weighing ~7 g, and living ~9.8 times longer than predicted for its size (4, 8). Most bat species are longer-lived than similar-sized mammals (6, 9) and exhibit little or no
evidence of senescence (10, 11). Flight provides bats a means to escape predation and avoid adverse conditions that ultimately has driven the evolution of longer life spans (9). Of the species examined to date, the genus Myotis holds the longevity record with at least 13 species living beyond 20 years and 4 species exceeding 30 years (6, 12) despite their small body size (2 to 45 g). Although an excellent model species to study extended“health span,” logistically, it is difficult to study aging in bats because they are not easily maintained in captivity (5). Field-based aging studies require individuals to be marked, easily caught, and nonlethally sampled every year throughout their long life span. Here, uniquely drawing on more than 60 years of cumulative long-term, mark-recapture studies from four wild populations of long-lived bats, we determine whether telomeres, a driving factor of the aging process (1), shorten with age in Myotis myotis (n = 239; age, 0 to 6+ years), Rhinolophus ferrumequinum (n = 160; age, 0 to 24 years), Myotis bechsteinii (n = 49; age, 1 to 16 years), and Miniopterus schreibersii (n = 45; age, 0 to 17 years) (Table 1).
Telomeres are tandem 5′-TTAGGG-3′ repeats that form protective structures at both ends of chromosomes (13). Through the action of six telomere-associated proteins, collectively termed shelterin, telomeres are maintained by preventing the tips of chromosomes from being re-cognized as double-stranded breaks (14). In human somatic cells, telomeres shorten with successive rounds of cell division resulting from the“end replication problem” in which the cellular replicative machinery cannot replicate to the end of the chromosome (13). When telomeres become critically shortened, the cell elicits a DNA damage signal and undergoes cellular senescence (13, 15), ultimately driving the aging process. Although telomere shortening with age has been ob-served in a wide diversity of animal populations (16), no bats have been assessed to date. In germ, stem, and cancer cells, telomeres are main-tained through the action of telomerase, a reverse transcriptase capable of restoring repeats to telomere ends (15). Among mammals, repressed telomerase and telomere shortening has evolved as a cancer-suppressing mechanism (17). Despite reportedly having long telomeres (9 to 30 kb) and some species potentially expressing telomerase (17), cancer is rarely reported in bats (18). These factors, coupled with positive selec-tion acting on telomere maintenance genes in Myotis lucifugus (19),
1School of Biology and Environmental Science, Science Centre West, University College
Dublin, Belfield, Dublin 4, Ireland.2Ecologie et Santé des Ecosystèmes (ESE), Ecology and
Ecosystem Health, Agrocampus Ouest, INRA, 35042 Rennes, France.3Laboratoire
Évolu-tion et Diversité Biologique, UMR 5174: Université Toulouse III, CNRS, ENFA, 118 Route de
Narbonne, 31062 Toulouse cedex 9, France.4Le Groupe Chiroptères de Bretagne
Vivante/SEPNB, 19 rue Gouesnou BP 62132, 29221 Brest cedex 2, France.5School of
Biological Sciences, Life Sciences Building, University of Bristol, Bristol BS8 1TH, UK.
6School of Biology, Faculty of Biological Sciences, University of Leeds, Leeds LS2 9JT,
UK.7University of Greifswald, Loitzer Strasse 26, 17489 Greifswald, Germany.
8
CIBIO-InBIO, Universidade do Porto, Campus de Agrário Vairão, Rua Padre Armando
Quintas, 4485-661 Vairão, Portugal.9CEABN-InBIO, Instituto Superior de Agronomia,
Universidade de Lisboa, 1349-015 Lisboa, Portugal.10Instituto da Conservação da
Natureza e das Florestas, Avenida da República 16-16B, 1050-191 Lisboa, Portugal. *Corresponding author. Email: Emma.Teeling@ucd.ie
on September 12, 2018
http://advances.sciencemag.org/
suggest that the telomeres of long-lived bats may be unusual compared to other mammals. However, nothing is currently known about telomere dynamics in bats and its potential role in their longevity.
RESULTS
To address these questions, we captured four different species of wild bats (n = 493) of known age, at field sites (2013–2016) across Europe (see Materials and Methods and tables S1 and S2). Once captured, 3-mm wing biopsies were taken from each bat before release (see Materials and Methods). Samples were flash-frozen in liquid nitrogen (LN2) or desiccated using silica beads, and high–molecular weight DNA was extracted (see Materials and Methods). Quantitative
poly-merase chain reaction (qPCR) assays of telomere length were repeated in triplicate on each plate. Each plate was assayed three times, and the relative telomere length (rTL) was calculated (see Materials and Methods). For each species, we modeled the relationship between rTL and age using a suite of linear, parabolic, piecewise-linear, and linear mixed models (LMMs) (table S2). For all data sets, except M. schreibersii, for which a simple linear model was the best fit, an LMM controlling for factors relating to technical variation (for exam-ple, interplate variation between DNA extraction plates or qPCR runs) was the best fit (see Materials and Methods and table S2).
Our results show that telomeres shorten with age in R. ferrumequinum and M. schreibersii (P < 0.001 in both cases) (Fig. 2, A and B), typical of most mammals (16). In the genus Myotis, we did not detect a relationship
3 0 2 4 6 8 2 4 6
Log body mass (g)
Longevity quotient
Bats-telomeres measured Bats
All other mammals Naked mole rat
1 Myotis myotis 2 Rhinolophus ferrumequinum Myotis bechsteinii 4 Miniopterus schreibersii 1 2 3 4
Fig. 1. Longevity quotient (LQ = observed/expected longevity) for 779 mammalian species, plotted against body mass (see Materials and Methods). The dashed line indicates an LQ = 1. The vast majority of bat species live much longer than expected given body size (highlighted in blue), as does a single rodent species, the naked mole rat (position indicated by a black star). Here, the relationship between telomere length and age is estimated for species highlighted in black and denoted by a bat outline.
Table 1. List of species included in the study with details relating to maximum recorded life span from AnAge, sampling location, sampled age ranges for each species, and number of samples included.
Species Maximum life span (years) Sampling location Age range
samples (years)
Number of samples
M. myotis 37.1 Brittany, France 0–6+ 239
M. bechsteinii 21 Würzburg, Germany 1–16 49
R. ferrumequinum 30.5 Woodchester and Nailsworth, UK 0–24 160
M. schreibersii 22 Tomar and Grândola, Portugal 1–17+ 45
on September 12, 2018
http://advances.sciencemag.org/
between rTL and age in either M. myotis (P = 0.16) or M. bechsteinii (P = 0.27) (Fig. 2, C and D). This genus includes the longest-lived bat species that have been studied to date (6). The difference in effect size (slope of the line) does not explain the difference in significance, which is potentially explained by sources of variation unrelated to age in Myotis (fig. S1, table S8, and Supplementary Text). Jackknife analyses confirmed the robustness of results and direction of the slope in all data sets (figs. S2 and S3 and Supplementary Text). To investigate whether differing results between species were simply artifacts relating to differences in sample sizes or age ranges, we compared M. myotis and R. ferrumequinum data sets of identical composition (same number of individuals per age cohort, n = 91), and this analysis
reca-pitulated our initial results (fig. S4 and Supplementary Text). To ex-plore the selective disappearance of individuals with short telomeres as a potential confounding factor in our cross-sectional analyses, we performed an upper quartile regression using the M. myotis and R. ferrumequinum data sets. Significant telomere shortening with age is observed among the R. ferrumequinum individuals with the longest telomeres (upper quartile), but this effect is not detected in M. myotis (fig. S5 and Supplementary Text). Although increased sampling or longitudinal data will be necessary to fully elucidate the degree to which age is a driver of telomere dynamics in Myotis species, it is clear from our study that the association between rTL and age observed in R. ferrumequinum, M. schreibersii, and many other mammal species 0.6 0.8 1.0 1.2 1.4 0 5 10 15 20 25 Age (years) rTL A Rhinolophus ferrumequinum 1.0 1.5 2.0 0 2 4 6+ Age (years) rTL C Myotis myotis 1 2 3 4 5 4 8 12 16 Age (years) rTL D Myotis bechsteinii
Relative telomere length vs. age
1.4 1.6 1.8 0 5 10 15 Age (years) rTL B Miniopterus schreibersii P = 0.161 P < 0.001*** P = 0.270 P < 0.001*** n = 160 n = 49 n = 239 n = 45
Fig. 2. The relationship between rTL and age in four long lived bat species. Plot showing the relationship between Box-Cox transformed rTL and age modeled in an LMM statistical framework for (A) R. ferrumequinum, (C) M. myotis, and (D) M. bechsteinii, and (B) M. schreibersii, using a linear model. Corresponding P values indicate the relationship between rTL and age for each species and are shown in the top right-hand corner of each plot. Models are plotted where significant. Note that scales differ between plots.
on September 12, 2018
http://advances.sciencemag.org/
including humans (16, 20) is not detected in either of the Myotis species studied.
To better understand how telomeres may be maintained in Myotis species, we investigated telomerase expression in M. myotis. Using a publicly available blood transcriptome (table S3) derived from the same study population, we conducted an analysis of telomerase expression in M. myotis and compared it with data from mouse, pig, and human blood transcriptomes (table S3 and Supplementary Text). We also determined telomerase expression in primary fibroblast cell culture transcriptomes, generated from wing tissue of M. myotis and from a mouse ear biopsy (Supplementary Text). The expression of associated
shelterin genes was used as an internal control within species, given that expression levels measured in fragments per kilobase of transcript per million mapped reads (FPKM) are not readily comparable across species. Our analysis determined the presence or absence of expression, rather than relative amounts. Our results showed that telomerase was expressed in the blood in mice and pigs but that M. myotis, like humans, showed no signs of telomerase expression (Fig. 3, A to D). This is further supported by analysis of the wing-derived fibroblast transcriptome, which also shows telomerase expression in mice but not in M. myotis (Fig. 3, E and F). Our results suggest that the main-tenance of telomeres in M. myotis is not mediated by telomerase.
0.0 0.2 0 .4 0.6 0.8 1.0 1 .2 1.4 Logged laplace-smoothed FPKM v alues 0.0 0 .2 0.4 0 .6 0.8 1 .0 1.2 1 .4 Logged laplace-smoothed FPKM v alues 024 6 8 10 12 14 Logged laplace-smoothed FPKM v a lues 012345 6 Logged laplace-smoothed FPKM v a lues 01 2 34 5 6 Logged laplace-smoothed FPKM v a lues 02468 Logged laplace-smoothed FPKM v a lues A Myotis myotis Libraries n = 4 C Pig Libraries n = 3
Max. life span 37.1 years
Max. life span 27 years E Myotis myotis Libraries n = 1 B Mouse Libraries n = 4 D Human Libraries n = 6
Max. life span 122.5 years Max. life span
4 years
F Mouse
Libraries
n = 1
Cell Culture Fibroblast Transcriptomes
Blood transcriptomes
POT1
TERF2IP
TER
T
TINF2 TPP1 TERF1 TERF2 POT1
TERF2IP
TER
T
TINF2 TPP1 TERF1 TERF2
POT1
TERF2IP
TER
T
TINF2 TPP1 TERF1 TERF2 POT1
TERF2IP
TER
T
TINF2 TPP1 TERF1 TERF2
POT1
TERF2IP
TER
T
TINF2 TPP1 TERF1 TERF2 POT1
TERF2IP
TER
T
TINF2 TPP1 TERF1 TERF2
Fig. 3. Comparative analysis of telomerase expression. Analysis of telomerase expression (TERT) in blood transcriptomes of (A) M. myotis, (B) mouse, and (C) pig, and (D) human and fibroblast cell cultures in (E) M. myotis and (F) mouse. Expression of other shelterin genes (POT1, TERF2IP, TINF2, TPP1, TERF1, and TERF2) is provided as a comparison to TERT expression levels within species. Note that scales differ between plots.
on September 12, 2018
http://advances.sciencemag.org/
To further explore the genetic basis of telomere maintenance in M. myotis, we identified 225 target genes using gene ontology (GO) terms associated with telomere maintenance and literature searches (table S4). Coding sequences from our targeted gene set were mined from 52 publicly available eutherian mammal genomes, including 12 bat species, spanning ~98 million years of mammalian evolution (ta-bles S4 and S5) (21). Where possible, data were mined using the Reference Sequence (RefSeq) database. A custom approach incorpo-rating the annotation pipeline MAKER was designed to optimize data mining from poorly annotated genomes (see Materials and Methods). This enabled the inclusion of additional genome data from five bat species and three eutherian species (table S5 and Supplementary Text). Two data sets were prepared for downstream selection analyses, one containing only RefSeq data and one combining RefSeq and data mined using our custom MAKER pipeline. Tests of positive and divergent selection were carried out independently along five branches of the tree (fig. S6): the branches leading to (i) all bats, (ii) the genus Myotis, (iii) R. ferrumequinum, (iv) Miniopterus natalensis (M. schreibersii genome data were not available), and (v) the naked mole rat, an addi-tional excepaddi-tionally long-lived mammal given its small size (Fig. 1) (4). CodeML selective pressure variation tests were automated using a
custom-built workflow, OH-SNAP (Optimised High-throughput SNakemake Automation of PAML; available at https://github.com/ batlabucd/OHSNAP) (see Materials and Methods and fig. S7). To ensure that our results were robust to the addition or removal of data, only results recovered as significant in both data sets after false discovery rate (FDR) correction are further considered (tables S6 and S7).
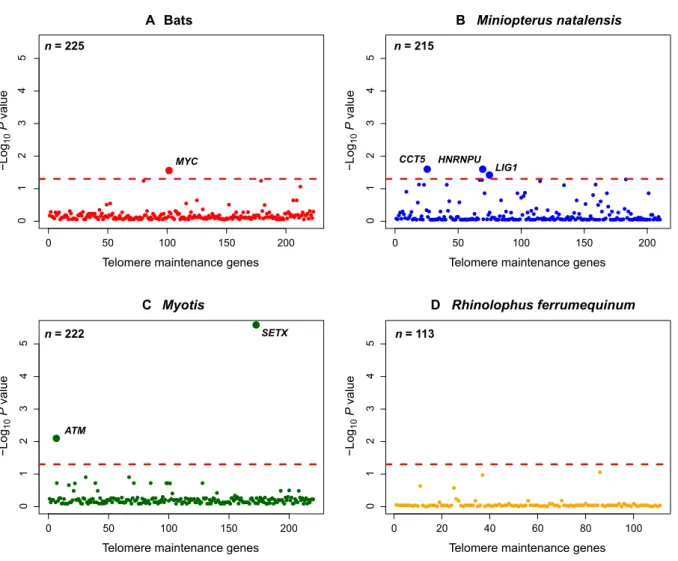
Our analyses of selective pressure heterogeneity revealed a pauci-ty of positive selection in all branches tested (table S6). This is un-surprising given the role that telomere maintenance genes play in controlling the cell cycle and maintaining genomic integrity. For exam-ple, deletion of all shelterin components except TERF2IP are lethal in mice (14), suggesting that conservative evolutionary forces have shaped the evolution of these genes in mammals. However, after FDR correc-tion, divergent selection was detected in SETX and ATM along the branch leading to the genus Myotis (Fig. 4C and table S7). ATM is the chief mobilizer of the DNA damage response, and the helicase SETX is a known interactor. Advancing a known role for enhanced DNA repair in long-lived species (22), ATM and SETX may contribute to genomic stability in bats through transcriptional silencing at DNA damage sites and by preventing DNA damage at replication forks
0 50 100 150 200
012345
Telomere maintenance genes
−Log 10 P value 0 50 100 150 200 012345
Telomere maintenance genes
−Log 10 P value 0 50 100 150 200 012345
Telomere maintenance genes
−Log 10 P value 0 20 40 60 80 100 012345
Telomere maintenance genes
−Log
10
P
value
A B Miniopterus natalensis
C Myotis D Rhinolophus ferrumequinum
n = 225 n = 113 n = 222 n = 215 MYC CCT5 HNRNPU LIG1 ATM Bats SETX
Fig. 4. Selective pressure heterogeneity in telomere maintenance genes. Results of tests for divergent selection using the CodeML model clade model C conducted on four
branches: (A) the bat ancestor, (B) the branch leading to M. natalensis, (C) the Myotis ancestor, and (D) the branch leading to R. ferrumequinum. P values are transformed using−log10.
Genes significant after FDR correction and appearing in both RefSeq + MAKER and RefSeq data sets are labeled above the red line, which indicates a significance cutoff ofa = 0.05.
on September 12, 2018
http://advances.sciencemag.org/
(23–25). Defects in either of these genes cause ataxia, a disorder that is associated with accelerated telomere shortening and reduced life span (26, 27). Hence, adaptations in these genes in Myotis bats could serve as new targets for anti-aging research.
A comparative multi-tissue transcriptome analysis was conducted using publicly available data to investigate whether the same set of telomere maintenance genes are differentially expressed in Myotis bats compared to other mammals (for example, cow, pig, bowhead whale, human, mouse, rat, and naked mole rat; Materials and Methods and table S3). After FDR correction, our analysis showed significant differ-ential expression of 21 telomere maintenance genes in Myotis bats compared to all other mammals. This list includes 20 up-regulated genes, including ATM and SETX that we showed to be evolving under divergent selection in the genus Myotis, as well as ABL1, CCT4, DCLRE1A, DOT1L, GNL3L, MLH3, MRE11A, PARP1, RAD50, RB1, RFC3, RPA1, SDE2, SSB, TERF2IP, WRAP53, WRN, XRCC5, and one down-regulated gene, TEN1 (table S8 and Supplementary Text). Because these genes were chosen with a focus on telomere maintenance a priori, a STRING (Search Tool for Recurring Instances of Neighbour-ing Genes) network analysis was conducted to determine whether these were enriched for any secondary biological process or pathway (see Sup-plementary Text). After FDR correction, our analysis showed significant functional enrichment (P < 0.05) for GO terms and KEGG (Kyoto Encyclopedia of Genes and Genomes) pathways associated with DNA repair (fig. S8 and tables S10 and S11). Divergent genomic and tran-scriptomic changes in these DNA repair genes, positioned at the axes of telomere maintenance, DNA damage prevention, and repair, may represent the molecular adaptations that have underpinned the evo-lution of exceptional longevity in the genus Myotis.
DISCUSSION
While we do not detect a significant relationship between rTL and age in Myotis and do not detect telomerase expression in M. myotis blood or fibroblasts, the specific mechanism through which these bats may maintain their telomeres is not clear. In human cancers, in the absence of telomerase, telomeres can be maintained by homology-directed telomere synthesis or alternative lengthening of telomeres (ALT) (28, 29). Results from our comparative transcriptomic analyses show that genes that have roles in pathways associated with ALT, ATM, MRE11a, RAD50, and WRN (28, 29) are significantly differentially expressed in all tissues of Myotis bats compared to all other mam-mals examined. Furthermore, genes that play a role in resolving re-plication forks and recombination-mediated repair are essential for telomere maintenance in ALT cells (28). SETX performs these functions (24, 30) and is differentially expressed and divergently evolving in Myotis species; however, it has not yet been investigated in an ALT context. Given the observed divergent selection in ATM and SETX as well as differential expression of these genes and MRE11a, RAD50, and WRN, our results are suggestive of a potential role for ALT in the maintenance of telomeres in the genus Myotis with age. However, to date, ALT activity has only been reported in anomalous situations (for example, cancer), and so, hypotheses arising from our transcriptomic and genomic analyses relating to ALT-mediated telomere maintenance should be subject to future experimental validation to fully elucidate telomere dynamics in Myotis species.
Despite also living much longer than expected given their body size (Fig. 1), there was no evidence of divergent selection on the branches
leading to R. ferrumequinum or the naked mole rat (Fig. 4D and table S7). This suggests that adaptation of telomere maintenance may be spe-cific to the Myotis lineage and that other longevity mechanisms may have evolved in Rhinolophus and the naked mole rat (see Supplemen-tary Text). Divergent selection was detected in CCT5, HNRNPU, and LIG1 along the branch leading to M. natalensis, suggesting the evolu-tion of enhanced proteostasis mechanisms (Fig. 4B and Supplementary Text) rather than telomere maintenance in Miniopterus. This could ex-plain the association of telomere shortening with age in this lineage and highlights the potential evolution of different longevity strategies in bats (see Supplementary Text). MYC was shown to be evolving under diver-gent selection along the bat ancestral branch (Fig. 4A). Although widely known as an oncogene, this pleiotropic transcription factor can also in-duce tumor suppression mechanisms, such as apoptosis, cellular se-nescence and the DNA damage response (31), which may contribute to longer life span and lower cancer incidence observed in bats (18). Because these results are based on in silico analyses, future functional assays are needed to confirm the role of these suggested pathways in bat longevity.
CONCLUSION
Among mammals, bats are unparalleled in their ubiquitous longevity in relation to their body size. The genus Myotis, in particular, includes the longest-lived species known to date (8) with field-based evidence for negligible senescence in M. bechsteinii (11). For the first time, we show that, unlike other long-lived bat species, we do not detect a rela-tionship between rTL and age in either Myotis species studied. A com-parative analysis of telomerase expression in blood transcriptomes revealed that, like in human blood, telomerase is not expressed in M. myotis blood, suggesting that telomere maintenance in this species is unlikely to be mediated by telomerase. Instead, tests of selective pres-sure heterogeneity in telomere maintenance genes suggest that ATM and SETX, which function to repair and prevent DNA damage, may contribute to telomere maintenance in this long-lived genus. These results, coupled with differential expression of ATM, SETX, MRE11a, RAD50, and WRN across all tissues in the genus Myotis compared to other mammals, suggest a potential role for ALT mechanisms in the maintenance of telomeres in these species. If telomeres are maintained by ALT mechanisms in Myotis species, then these genes may represent excellent therapeutic targets given that cancer incidence in bats is rare (18). In addition, from a human perspective, telomere maintenance in the absence of telomerase is highly desirable given that telomerase ex-pression is present in ~90% of human cancers (13). Our analyses sug-gest that DNA repair genes, ATM and SETX, affecting DNA repair and telomere maintenance have contributed to the evolution of exceptional longevity in these Myotis species and represent excellent future study targets to better understand the aging process.
MATERIALS AND METHODS
LQ estimation
The data used to determine the mammalian LQ included all mammal species (n = 779) from the data set of Healy et al. (9). For each species, expected longevity was calculated using a linear regression fitted to logged values of maximum longevity and mass for all nonflying euthe-rian species (slope = 0.186, intercept = 0.546), following Austad and Fischer (7). As per Austad and Fischer (7), the LQ was calculated as follows: LQ = observed longevity/expected longevity.
on September 12, 2018
http://advances.sciencemag.org/
Telomere length analysis
Study species and wing biopsy sampling
Full ethical approval and permission (AREC-13-38-Teeling) for cap-ture and field sampling were awarded by the University College Dublin ethics committee to E.C.T. Sampling was carried out in accordance with the ethical guidelines and sampling permits issued in each country and are detailed in table S1. M. myotis, between ages 0 and 6+ years (that is, first fitted with transponders as adults 6 years before subsequent recapture, therefore true age unknown), were captured from Brittany, France, as they left the roost, using modified harp traps (Table 1). R. ferrumequinum, between ages 0 and 24 years from Woodchester, near Bristol, UK, were captured using hand nets in the roost. M. bechsteinii, between ages 1 and 16 years, were captured from bat boxes in forests close to Wurzburg, Germany. M. schreibersii, between ages 0 and 17+ years, were captured as they left the roost, using a harp trap from Tomar and Grândola, Portugal.
Once captured, all bats were placed in individual cloth bags or boxes before processing. Wing biopsies were taken using a 3-mm biopsy punch and were either flash-frozen in LN2and transferred to a−150°C freezer for long-term storage (M. myotis), or immediate-ly preserved in silica beads (32) at room temperature and then trans-ferred to a−20°C freezer for long-term storage (R. ferrumequinum, M. bechsteinii, and M. schreibersii). To explore the viability of silica beads as an alternative preservation medium to LN2, we carried out an experiment using a subset of individual bats (n = 6). Two wing biop-sies were taken from each individual; one biopsy was flash-frozen in LN2and then stored at−150°C, whereas the other was stored in silica in the field and then transferred to−20°C for long-term storage. After 5 months, all 12 samples were extracted and assayed as described below. Tests indicated our data were homogeneous with respect to variance and non-normally distributed. The nonparametric Kruskal-Wallace and Wilcoxon rank sum tests showed that there was no significant difference (P = 0.423 and P = 0.48, respectively) in rTL ob-tained from the samples preserved with LN2or silica.
DNA extraction and qPCR assay
DNA was extracted from biopsies using membrane filter-based extrac-tion kits [Promega Wizard SV DNA Extracextrac-tion kit (catalog no. A2371, Promega Corporation) or the Qiagen DNeasy Blood and Tissue kit (Qiagen)]. The Promega 96-well extraction protocol was partially automated using a custom protocol for the Hamilton STAR deck liquid handling robot but otherwise followed the manufacturer’s in-structions. Qiagen DNeasy extractions were carried out following the manufacturer’s instructions. The integrity of DNA from subsets of ex-tracted samples was confirmed using electrophoresis on a 1% agarose gel. DNA concentration and purity were quantified using a NanoDrop 8000 Spectrophotometer (Thermo Fisher Scientific).
rTL was measured using a modified version of Cawthon’s (33) method to measure telomere length in humans. Telomeres were am-plified using primers described by Cawthon (33). A novel single copy gene (SCG) primer pair was designed for the mammalian brain-derived neurotrophic factor (BDNF) gene (BDNF_F1: AGCTGAGCG-TATGTGACAGT; BDNF_R1: TGGGATTACACTTGGTCTCGT). These primers were designed to amplify across diverse mammalian taxa and were optimized here for use in bats. Because of differences in optimum annealing temperatures, the telomere and SCG reactions were carried out on separate plates. All primer stocks were used at 50mM concentration. Telomere reactions were carried out in 10 ml re-action volumes containing 2.5ml of DNA (~2 to 5 ng/ml), 5 ml of Takara SYBR Green (Clontech), 0.027ml of Tel1 primer, 0.09 ml of
Tel2 primer, 0.2ml of ROX (Takara SYBR Green, Clontech), and the remaining volume with PCR grade water (Invitrogen). The compo-sitions of telomere and SCG reactions were identical except for the primers: 0.12ml of BDNF_F1 and 0.2 ml of BDNF_R1. qPCR amplifi-cations were carried out using the Stratagene Mx3000TM real-time PCR machine. Telomere reactions were amplified using the following cycling conditions: an initial step of 30 s at 95°C, then 25 cycles of 15 s at 95°C, and 2 min at 54°C, followed by a melt curve. SCG reactions were amplified as follows: an initial step of 30 s at 95°C, then 40 cycles of 15 s at 95°C, and 1 min at 58°C, followed by a melt curve. On each plate, samples were assayed in triplicate, and each plate was run three times to account for machine variation between runs. A“golden sam-ple” was prepared from wing tissue and stored in identical 50 ml ali-quots at−80°C for use throughout the experiment to account for among-plate variation (33, 34). A golden sample and a negative con-trol were run on each plate in triplicate.
Data analysis and rTL
Raw data were exported from the Stratagene Mx3000TM software. Baseline correction and per-well amplification efficiencies were calculated using LinRegPCR (35). Data were normalized across plates for both telo-mere and SCG reactions using the golden sample as a reference. The coefficient of variation (CoV) was calculated for each sample. Where the CoV exceeded arbitrary cutoff values chosen to maximize the data (5% for telomeres and 2.5% for SCG), results from individual reaction replicates were either removed or the sample was excluded from the anal-ysis. The average Ct (cycle threshold) value was calculated across nine replicates for each sample. The Pfaffl (36) method, which takes into ac-count the difference in amplification efficiencies between primer sets, was used to calculate rTL. The average amplification efficiency for the telo-mere primer set was 90% and 93% for the SCG primer pair.
Statistical analysis
All statistical analyses were carried out in R v.3.311 (37). Data sets from individual species were analyzed separately. A Box-Cox transformation (38) was used to normalize each data set. A suite of linear, parabolic, piecewise, and linear mixed-effect models were constructed using the R packages MASS (39) and lme4 (40). Models were constructed with rTL as the response variable, age as the fixed variable, and with addi-tional random variables listed in table S2. The best-fitting model was selected using the Akaike information criteria (AIC). In addition to the AIC, model residuals were examined to ensure a good fit of the model to the data. Analysis of variance (ANOVA) was used to deter-mine the significance of the fixed effect, age. Jackknife analyses were used to estimate the robustness of our results. The number of indi-viduals subsampled without replacement varied with each data set (M. myotis, n = 160; R. ferrumequinum, n = 100; M. bechsteinii, n = 30; and M. schreibersii, n = 30). The P values from 100 resulting models were compared, as were slopes where underlying models were signifi-cant, for example, R. ferrumequinum and M. schreibersii (figs. S1 and S2). To determine whether differences in sample size or sampled age ranges affected our results, we directly compared the two largest data sets, M. myotis and R. ferrumequinum, by randomly subsampling data sets to have equal age cohorts and equal numbers of samples per age cohort (1 to 6+ years; n = 91). To explore selective disappearance as a confounding factor in our analyses, we performed an upper quartile regression using the M. myotis and R. ferrumequinum data sets. The upper quartile range of rTL for each age cohort was subsampled from the original data set, and the best-fitting model (Table 1) was refitted to the upper quartile data set. Significance was assessed as described above. The rate of telomere loss can be compared between species if
on September 12, 2018
http://advances.sciencemag.org/
the control sample used to calculate telomere length is consistent, as it is in this study (16). Previous analyses have calculated the rate of telo-mere loss after the removal of the youngest age cohorts to control for developmental differences, which may accelerate the rate of shortening (16). Hence, the data sets described in table S2 were reanalyzed with the 0-age cohort removed to facilitate a comparison of slopes (effect sizes). LMMs were used to analyze all data sets to ease comparison. R2values (conditional and marginal) were calculated to investigate the proportion of variance explained by each model.
Telomerase expression
Blood transcriptome analysis of telomerase expression Owing to the greater availability of publicly available transcriptome data for blood tissues in species of interest, telomerase expression was principally investigated using blood; however, given that we did not detect telomere shortening in Myotis wing tissue, we also inves-tigated telomerase expression in a smaller fibroblast transcriptome data set. Libraries used for M. myotis, pig, mouse, and human blood transcriptome analyses are listed in table S3.
Skin fibroblasts from M. myotis and Mus musculus were grown as described previously (41), with some modifications. Two 3-mm wing skin biopsies (M. myotis, one individual) or 3-mm ear biopsies (M. musculus, one individual) were minced into ~0.5-mm fragments and resuspended in 3-cm cell culture–treated petri dishes in growth medium (high glucose, glutamate Dulbecco’s modified Eagle’s medi-um, supplemented with 20% fetal bovine sermedi-um, and 1% penicillin-streptomycin-Fungizone) supplemented with 0.1% collagenase type II. After overnight incubation at 37°C at 5% CO2, the collagenase was re-placed with 2 ml of growth medium. Cells were fed every second day with growth medium (reduced antibiotic concentration of 0.2%) until confluent and passaged using trypsin-EDTA (0.025%). All reagents used were from Gibco. For fibroblast transcriptome preparation, 100,000 cells per well were seeded in 24-well plates. High-quality total RNA [RNA integrity number (RIN) score, 10] was extracted from 90% confluent cultures using miRNeasy Mini Kit (Qiagen) and deoxyribonuclease treated with TURBO DNA-free Kit (Ambion) according to the man-ufacturer’s instructions. Ribosomal RNA was depleted with RiboZero treatment (Fasteris) as part of RNA library preparation. Samples were sequenced using the Illumina HiSeq2500 platform (Fasteris), resulting in 25 million single reads [1 × 125 base pairs (bp)] per sample.
Transcriptomic gene expression is typically quantified using TPM (transcripts per million reads) or FPKM. Where genes of interest are expressed at low levels (such as telomerase and shelterin in these data sets), TPM returns extremely small values, which hinder useful com-parisons. Hence, we calculated gene expression using FPKM for both the blood and fibroblast data sets. Raw reads from each RNA sequenc-ing (RNA-seq) transcriptome were mapped to their respective refer-ence genomes using TopHat (v2.0.11) (42). Transcripts were further assembled and quantified using Cufflinks (v1.3.0) (43). FPKM values for telomerase and shelterin genes were calculated on the basis of their respective genome annotations. Laplace smoothing and a log trans-formation were applied to FPKM values before plotting.
Phylogenomic analyses of telomere maintenance genes M. myotis genome
A draft assembly of the M. myotis genome was generated by Dovetail genomics from approximately 30× coverage of an Illumina paired-end library and 23× coverage of a Dovetail Chicago library (44), using high–molecular weight DNA extracted from tissues collected from a
juvenile female from the French rTL study population. The reads were first assembled with the Meraculous assembler (45) and then scaffolded using custom software developed by Dovetail. The MAKER annotation pipeline (46) was used to annotate the draft genome assembly from (i) the coding domain sequence (CDS) of M. brandtii and M. lucifugus; (ii) the protein sequences of M. brandtii, M. lucifugus, and UniProt Swiss-Prot; and (iii) the gene predictors AUGUSTUS (47) and SNAP (48). These ab initio gene predictors were trained using the CDS of the M. brandtii genome and a publicly available reference-based blood transcriptome assembly (49) using Cufflinks (43). The resulting tran-scripts were searched against the UniProt Swiss-Prot database using Basic Local Alignment Search Tool (BLAST) (50, 51), and gene names were assigned on the basis of a cutoff of 70% alignment length and 80% identity. This assembly was then mined for downstream selec-tive pressure variation analyses, as detailed below. This assembly is available from the authors upon request.
Data selection and genome mining
Telomere maintenance genes were identified using associated GO terms through the Bioconductor package (52) in R. Gene targets used in previous analyses (19) were incorporated into our data set, resulting in a total of 225 genes for downstream analysis (table S4). In total, genomes from 52 eutherian mammals were mined to include a representative from each mammalian order where possible (table S5). This included 12 bat genomes, of which 5 are representatives from Yinpterochiroptera, which includes R. ferrumequinum; the remaining 7 are representatives from Yangochiroptera, which includes 4 from the genus Myotis and 1 from M. natalensis, a species closely related to M. schreibersii. Where genome data existed for multiple taxa in a given mammalian order, taxa with data covering the highest number of telomere maintenance genes were chosen for inclusion in the final data set.
Gene sequences from annotated mammalian genomes were down-loaded using their gene identification numbers in the Entrez RefSeq database. For poorly annotated genomes, such as the 17× unannotated R. ferrumequinum genome, a custom MAKER (46) pipeline was ap-plied, using gene sets from closely related sister taxa as a reference (see table S5 for details). Because of the fragmented nature of the poorly annotated genomes, exonic gene regions can span multiple contigs/ scaffolds, rendering annotation extremely difficult. To overcome this, the first pre-MAKER modification step involved locating all these exon-containing genome sequences in poorly annotated genomes using BLAST (50, 51) and a phylogenetically related reference gene. These sequences are concatenated end-to-end into a single larger “pseudo-scaffold,” which is then passed to MAKER. Within MAKER, putative coding regions were identified with blastn, spliced alignments with intron-exon boundaries resolved using Exonerate (53), and Hidden Markov Model (HMM) gene models trained on each individual gene within the telomere maintenance data set using SNAP (48). Output transcripts from MAKER were aligned to their respective reference genes using a pairwise aligner, matcher in the European Molecular Biology Open Software Suite (EMBOSS) software (54), to determine sequence cov-erage. A minimum threshold of 70% coverage was required before a gene could be considered“useable.” Any sequences containing an internal stop codon were removed because these likely represented poor-quality data, pseudogenes, or alternative isoforms. Where multiple transcript variants were available for a target gene, the longest variant was chosen to max-imize coverage.
Given that significantly less gene information could be mined from the unannotated genomes, often because of poor quality, two data sets were prepared for downstream analyses. One contained RefSeq data
on September 12, 2018
http://advances.sciencemag.org/
only, whereas the other included RefSeq data and the species mined using MAKER (table S4). This approach ensured that our results would be robust to the trade-off between the quality (RefSeq) and quantity (RefSeq and MAKER) of data. Both data sets were initially aligned as nu-cleotides with default settings using the Aqua (55) alignment optimization workflow, which compares MUSCLE (multiple sequence comparison by log-expectation) (56) and MAFFT (multiple alignment using fast fourier transform) (57, 58) alignments, applies a refinement step using RASCAL (59), and provides a norMD (60) score as a measure of alignment quality. Alignments were further optimized using the phylogeny-aware aligner Prank (61) by aligning as codons, using six iterations of the alignment and the−F option to specify that insertions should be trusted. Gblocks (62) was used to remove any large indels from the alignment by specifying the data as codons, a minimum block length of 2 and allowing positions that were half gaps. Alignments were visually inspected to remove any ob-vious poor-quality data, and the data were realigned as described above. OH-SNAP: Automation of CodeML using Snakemake
An automated workflow called OH-SNAP was constructed to run CodeML as implemented in the PAML package (63). The workflow was designed using the Snakemake workflow management system (64) and was executed on a high-performance compute cluster. The workflow requires a species tree (described below), an alignment, a list of taxa contained within the branch to be labeled, and a template con-trol file specifying the model(s) to run (fig. S7). To account for heter-ogeneity in missing data across the data set, the workflow begins by pruning the species tree to match the taxa present in the alignment. Using the aforementioned taxa list, the target branch to be tested is then labeled. The template control file, which details the model, is then populated, specifying the alignment, labeled tree, and output file names. The workflow then runs CodeML across a specified number of nodes, parallelizing this single threaded program. The species tree for all taxa contained within the data set was constructed using the topology of Meredith et al. (21) and Ruedi et al. (65) for the branching pattern within the genus Myotis (fig. S7). The following branches were labeled to detect selection in the branches leading to (i) bats, (ii) the genus Myotis, (iii) R. ferrumequinum, (iv) M. natalensis, and (v) Heterocephalus glaber, the naked mole rat (fig. S6).
We used two tests to detect signatures of adaptation in telomere maintenance genes: the branch site test (model A versus model A null) (66), which is used to detect positive selection, and clade model C ver-sus M2a_rel, which is used to detect divergent selection (67). In the branch site test, omega (w) was calculated on a site-wise basis for the labeled branch designated as the foreground before being com-pared with estimates obtained for the background branch of the tree (model A; model = 2, NSsites = 2, fix_omega = 0, omega = 0.4, and clean_data = 0). This alternative model was then compared with a null model which assumes no positive selection (model A null; model = 2, NSsites = 2, fix_omega = 1, omega = 1, and clean_data = 0). A likeli-hood ratio test (LRT) was used to compare the fit of the two models, and ac2test with one degree of freedom was used to assess the signif-icance of the model fit. To detect divergent selection, we used the clade model C, which estimates the averagew of the labeled foreground clade and compared it with the estimated averagew of the background clade (model = 3, NSsites = 2, and clean_data = 0). This model was compared with the null model M2a_rel (model = 0, NSsites = 22, and clean_data = 0) following Weadick and Chang (67), using an LRT and ac2test with one degree of freedom to determine the signif-icance. Resulting P values from both tests were corrected using the FDR method to account for multiple testing with a significance level of 0.05.
Alignments of significant results were once more visually inspected to confirm data quality for target branches and rule out alignment error, because poorly aligned positions can lead to false positive results. Where data did not meet this standard, the gene was removed from our final list of results (tables S6 and S7).
Comparative transcriptomics of telomere maintenance genes Data selection
To determine whether our data set of 225 telomere maintenance genes was differentially expressed in bats compared to other mammals, we carried out a comparative transcriptomic analysis. Data were chosen un-der two criteria: (i) The study individual must be an adult and (ii) the tissue must be derived from a healthy individual. Using M. brandtii and M. myotis as representatives of the long-lived bat genus Myotis, we com-pared the expression of these genes with their homologous counterparts in diverse mammalian taxa—cow (Bos taurus), human (Homo sapiens), mouse (M. musculus), naked mole rat (H. glaber), pig (Sus scrofa), rat (Rattus norvegicus) and bowhead whale (Balaena mysticetus) across four tissue types: blood, kidney, liver and brain (table S3).
1:1 ortholog identification
For genome-wide, cross-species comparison of gene expression, 1:1 orthologs were identified between Myotis and other species for quan-tification. CDSs were obtained from their respective genomes (table S3). The M. lucifugus genome was used as the common reference to stan-dardize the analysis for both M. myotis and M. brandtii because it is better annotated. Where multiple transcripts were present, the longest transcript was chosen for analysis. The genomic telomere maintenance gene data set was added to the CDS data sets for each species. Reciprocal BLAST was performed on the filtered CDS data set between Myotis and other species, with the e value cutoff of 1 × 10⁻¹⁰. Resulting pair-wise orthologs were extracted for differential gene expression analysis. Analysis of differentially expressed genes
Adaptor trimming and base quality filtering of raw RNA-seq data were carried out following Huang et al. (49). Using Sailfish v.0.7.6 (68), clean reads were mapped to 1:1 orthologous transcript sets that were identi-fied between Myotis and other species respectively and the orthologs were quantified. Sailfish k-mer parameter settings were determined on the basis of the length of RNA-seq reads. k-mer values were set to 31 when RNA-seq reads were longer than 75 bp and set to 25 when reads were shorter than 75 bp. Because library type varied across data sets (single-end or paired-end), the single-end mode (−l SR) was applied to all libraries for transcript quantification. For each tissue type, a pair-wise differential gene expression analysis was carried out between Myotis and other species using the Bioconductor package DESeq2 in R v.3.0.3 (69). Expression values for our target 225 telomere mainte-nance genes were extracted from this data set for further investigation. After FDR correction, genes with a significance value of <0.05 were con-sidered significantly differentially expressed. To investigate whether dif-ferentially expressed genes (DEGs) were consistently difdif-ferentially expressed across multiple tissues, we selected DEGs that showed up-or down-regulation in Myotis compared to at least three other species, for further analysis. Given that our data set was chosen a priori to explore telomere maintenance genes, a protein-protein interaction network was constructed to determine whether Myotis DEGs showed signs of second-ary enrichment for any other process besides telomere maintenance. To explore this, the STRING database v.10.0 (70) was queried using significant DEGs as input. H. sapiens was chosen as the query species because it has the best characterized protein interactions. Default param-eters were chosen to construct a protein-protein interaction network.
on September 12, 2018
http://advances.sciencemag.org/
SUPPLEMENTARY MATERIALS
Supplementary material for this article is available at http://advances.sciencemag.org/cgi/ content/full/4/2/eaao0926/DC1
Supplementary Text
table S1. Details of capture and sampling permits for each population included in this study. table S2. Detailed model input and output.
table S3. List of taxa and tissues used in the comparative transcriptome analysis of telomere maintenance genes.
table S4. Summary of alignment details for the RefSeq and RefSeq + MAKER data sets used in the selective pressure variation tests of telomere maintenance genes.
table S5. List of eutherian mammal genomes mined for the selective pressure heterogeneity analyses.
table S6. Positive selection test results for the RefSeq + MAKER and RefSeq-only data sets. table S7. Divergent selection test results for the RefSeq + MAKER and RefSeq-only data sets. table S8. Detailed model output and R2values for LMMs fitted to data sets with the 0-age
cohort removed to facilitate a comparison of slopes (effect sizes).
table S9. Results of pairwise comparisons of DEGs in Myotis compared to other mammals across tissue types.
table S10. GO terms corresponding to biological processes that are significantly enriched in the telomere maintenance protein-protein interaction network.
table S11. KEGG pathways that are significantly enriched in the telomere maintenance protein-protein interaction network.
fig. S1. LMMs fitted to each data set after the removal of the 0-age cohort.
fig. S2. Analysis of P values arising from 100 jackknifed models of telomere length versus age. fig. S3. Analysis of slope values arising from 100 jackknifed models of telomere length versus age. fig. S4. Randomly subsampled M. myotis and R. ferrumequinum data sets containing equal numbers of samples per age cohort recapitulate results from Fig. 2 and show that telomeres shorten in R. ferrumequinum, but we do not detect a significant relationship between rTL and age in M. myotis.
fig. S5. Upper Quartile Regression analysis.
fig. S6. Tree topology used for selective pressure analyses.
fig. S7. Schematic depicting steps in the OH-SNAP workflow to automate CodeML analysis. fig. S8. STRING protein-protein interaction network for 14 significantly DEGs in Myotis bats compared to all other mammals.
References (71–94)
REFERENCES AND NOTES
1. C. López-Otín, M. A. Blasco, L. Partridge, M. Serrano, G. Kroemer, The hallmarks of aging. Cell 153, 1194–1217 (2013).
2. A. J. Hickey, M. Jüllig, J. Aitken, K. Loomes, M. E. Hauber, A. R. Phillips, Birds and longevity: Does flight driven aerobicity provide an oxidative sink? Ageing Res. Rev. 11, 242–253 (2012).
3. J. P. de Magalhães, The scientific quest for lasting youth: Prospects for curing aging. Rejuvenation Res. 17, 458–467 (2014).
4. S. N. Austad, Methusaleh’s zoo: How nature provides us with clues for extending human health span. J. Comp. Pathol. 142, S10–S21 (2010).
5. A. M. Valdes, D. Glass, T. D. Spector, Omics technologies and the study of human ageing. Nat. Rev. Genet. 14, 601–607 (2013).
6. J. Munshi-South, G. S. Wilkinson, Bats and birds: Exceptional longevity despite high metabolic rates. Ageing Res. Rev. 9, 12–19 (2010).
7. S. N. Austad, K. E. Fischer, Mammalian aging, metabolism, and ecology: Evidence from the bats and marsupials. J. Gerontol. 46, B47–B53 (1991).
8. A. J. Podlutsky, A. M. Khritankov, N. D. Ovodov, S. N. Austad, A new field record for bat longevity. J. Gerontol. A Biol. Sci. Med. Sci. 60, 1366–1368 (2005).
9. K. Healy, T. Guillerme, S. Finlay, A. Kane, S. B. A. Kelly, D. McClean, D. J. Kelly, I. Donohoe, A. L. Jackson, N. Cooper, Ecology and mode-of-life explain lifespan variation in birds and mammals. Proc. R. Soc. Lond. B Biol. Sci. 281, 20140298 (2014).
10. R. E. Ricklefs, Life-history connections to rates of aging in terrestrial vertebrates. Proc. Natl. Acad. Sci. U.S.A. 107, 10314–10319 (2010).
11. T. Fleischer, J. Gampe, A. Scheuerlein, G. Kerth, Rare catastrophic events drive population dynamics in a bat species with negligible senescence. Sci. Rep. 7, 7370 (2017). 12. R. Tacutu, T. Craig, A. Budovsky, D. Wuttke, G. Lehmann, D. Taranukha, J. Costa,
V. E. Friafeld, J. P. de Magalhães, Human ageing genomic resources: Integrated databases and tools for the biology and genetics of ageing. Nucleic Acids Res. 41, D1027–D1033 (2013).
13. M. A. Jafri, S. A. Ansari, M. H. Alqahtani, J. W. Shay, Roles of telomeres and telomerase in cancer, and advances in telomerase-targeted therapies. Genome Med. 8, 69 (2016). 14. I. Schmutz, T. de Lange, Shelterin. Curr. Biol. 26, R397–R399 (2016).
15. J. Campisi, Aging, cellular senescence, and cancer. Annu. Rev. Physiol. 75, 685–705 (2013). 16. B. Dantzer, Q. E. Fletcher, Telomeres shorten more slowly in slow-aging wild animals
than in fast-aging ones. Exp. Gerontol. 71, 38–47 (2015).
17. N. M. V. Gomes, O. A. Ryder, M. L. Houck, S. J. Charter, W. Walker, N. R. Forsyth, S. N. Austad, C. Venditti, M. Pagel, J. W. Shay, W. E. Wright, Comparative biology of mammalian telomeres: Hypotheses on ancestral states and the roles of telomeres in longevity determination. Aging Cell 10, 761–768 (2011).
18. L.-F. Wang, P. J. Walker, L. L. Poon, Mass extinctions, biodiversity and mitochondrial function: Are bats‘special’ as reservoirs for emerging viruses? Curr. Opin. Virol. 1, 649–657 (2011).
19. C. C. Morgan, A. M. Mc Cartney, M. T. Donoghue, N. B. Loughran, C. Spillane, E. C. Teeling, M. J. O’Connell, Molecular adaptation of telomere associated genes in mammals. BMC Evol. Biol. 13, 251 (2013).
20. A. Aviv, S. C. Hunt, J. Lin, X. Cao, M. Kimura, E. Blackburn, Impartial comparative analysis of measurement of leukocyte telomere length/DNA content by Southern blots and qPCR. Nucleic Acids Res. 39, e134 (2011).
21. R. W. Meredith, J. E. Janečka, J. Gatesy, O. A. Ryder, C. A. Fisher, E. C. Teeling, A. Goodbla, E. Eizirik, T. L. Simão, T. Stadler, D. L. Rabosky, R. L. Honeycutt, J. J. Flynn, C. M. Ingram, C. Steiner, T. L. Williams, T. J. Robinson, A. Burk-Herrick, M. Westerman, N. A. Ayoub, M. S. Springer, W. J. Murphy, Impacts of the cretaceous terrestrial revolution and KPg extinction on mammal diversification. Science 334, 521–524 (2011).
22. Z. Huang, D. Jebb, E. C. Teeling, Blood miRNomes and transcriptomes reveal novel longevity mechanisms in the long-lived bat, Myotis myotis. BMC Genomics 17, 906 (2016).
23. F. Ammazzalorso, L. M. Pirzio, M. Bignami, A. Franchitto, P. Pichierri, ATR and ATM differently regulate WRN to prevent DSBs at stalled replication forks and promote replication fork recovery. EMBO J. 29, 3156–3169 (2010).
24. A. Alzu, R. Bermejo, M. Begnis, C. Lucca, D. Piccini, W. Carotenuto, M. Saponaro, A. Brambati, A. Cocito, M. Foiani, G. Liberi, Senataxin associates with replication forks to protect fork integrity across RNA-polymerase-II-transcribed genes. Cell 151, 835–846 (2012).
25. N. M. Shanbhag, I. U. Rafalska-Metcalf, C. Balane-Bolivar, S. M. Janicki, R. A. Greenberg, ATM-dependent chromatin changes silence transcription in cis to DNA double-strand breaks. Cell 141, 970–981 (2010).
26. A. Elson, Y. Wang, C. J. Daugherty, C. C. Morton, F. Zhou, J. Campos-Torres, P. Leder, Pleiotropic defects in ataxia-telangiectasia protein-deficient mice. Proc. Natl. Acad. Sci. U.S.A. 93, 13084–13089 (1996).
27. A. De Amicis, M. Piane, F. Ferrari, M. Fanciulli, D. Delia, L. Chessa, Role of senataxin in DNA damage and telomeric stability. DNA Repair 10, 199–209 (2011).
28. A. J. Cesare, R. R. Reddel, Alternative lengthening of telomeres: Models, mechanisms and implications. Nat. Rev. Genet. 11, 319–330 (2010).
29. A. Mendez-Bermudez, A. Hidalgo-Bravo, V. E. Cotton, A. Gravani, J. N. Jeyapalan, N. J. Royle, The roles of WRN and BLM RecQ helicases in the alternative lengthening of telomeres. Nucleic Acids Res. 40, 10809–10820 (2012).
30. O. J. Becherel, A. J. Yeo, A. Stellati, E. Y. Heng, J. Luff, A. M. Suraweera, R. Woods, J. Fleming, D. Carrie, K. McKinney, X. Xu, C. Deng, M. F. Lavin, Senataxin plays an essential role with DNA damage response proteins in meiotic recombination and gene silencing. PLOS Genet. 9, e1003435 (2013).
31. L.-G. Larsson, M. A. Henriksson, The Yin and Yang functions of the Myc oncoprotein in cancer development and as targets for therapy. Exp. Cell Res. 316, 1429–1437 (2010). 32. S. J. Puechmaille, M. Ar Gouilh, P. Piyapan, M. Yokubol, K. M. Mie, P. J. Bates, C. Satasook,
T. Nwe, S. S. H. Bu, I. J. Mackie, E. J. Petit, E. C. Teeling, The evolution of sensory divergence in the context of limited gene flow in the bumblebee bat. Nat. Commun. 2, 573 (2011).
33. R. M. Cawthon, Telomere measurement by quantitative PCR. Nucleic Acids Res. 30, e47 (2002).
34. D. H. Nussey, D. Baird, E. Barrett, W. Boner, J. Fairlie, N. Gemmell, N. Hartmann, T. Horn, M. Haussmann, M. Olsson, C. Turbill, S. Verhulst, S. Zahn, P. Monaghan, Measuring telomere length and telomere dynamics in evolutionary biology and ecology. Methods Ecol. Evol. 5, 299–310 (2014).
35. J. M. Ruijter, C. Ramakers, W. M. Hoogaars, Y. Karlen, O. Bakker, M. J. van den Hoff, A. F. Moorman, Amplification efficiency: Linking baseline and bias in the analysis of quantitative PCR data. Nucleic Acids Res. 37, e45 (2009).
36. M. W. Pfaffl, A new mathematical model for relative quantification in real-time RT–PCR. Nucleic Acids Res. 29, e45 (2001).
37. R Development Core Team, R: A language and environment for statistical computing (R Foundation for Statistical Computing, 2016).
38. G. E. Box, D. R. Cox, An analysis of transformations. J. R. Stat. Soc. B 26, 211–252 (1964). 39. W. N. Venables, B. D. Ripley, Modern Applied Statistics with S (Springer, 2002), pp. 271–300. 40. D. Bates, M. Mächler, B. Bolker, S. Walker, Fitting linear mixed-effects models using
lme4. arXiv preprint arXIV:1406.5823 (2014).
41. J. Kacprzyk, E. C. Teeling, C. Kelleher, M. Volleth, Wing membrane biopsies for bat cytogenetics: Finding of 2n = 54 in Irish Rhinolophushipposideros (Rhinolophidae, Chiroptera, Mammalia) supports two geographically separated chromosomal variants in Europe. Cytogenet. Genome Res. 148, 279–283 (2016).
on September 12, 2018
http://advances.sciencemag.org/
42. C. Trapnell, L. Pachter, S. L. Salzberg, TopHat: Discovering splice junctions with RNA-Seq. Bioinformatics 25, 1105–1111 (2009).
43. C. Trapnell, B. A. Williams, G. Pertea, A. Mortazavi, G. Kwan, M. J. van Baren, S. L. Salzberg, B. J. Wold, L. Pachter, Transcript assembly and quantification by RNA-Seq reveals unannotated transcripts and isoform switching during cell differentiation. Nat. Biotechnol. 28, 511–515 (2010).
44. N. H. Putnam, B. L. O’Connell, J. C. Stites, B. J. Rice, M. Blanchette, R. Calef, C. J. Troll, A. Fields, P. D. Hartley, C. W. Sugnet, D. Haussler, D. S. Rokhsar, R. E. Green Chromosome-scale shotgun assembly using an in vitro method for long-range linkage. Genome Res. 26, 342–350 (2016).
45. J. A. Chapman, I. Ho, S. Sunkara, S. Luo, G. P. Schroth, D. S. Rokhsar, Meraculous: De novo genome assembly with short paired-end reads. PLOS ONE 6, e23501 (2011). 46. B. L. Cantarel, I. Korf, S. M. Robb, G. Parra, E. Ross, B. Moore, C. Holt, A. S. Alvarado,
M. Yandell, MAKER: An easy-to-use annotation pipeline designed for emerging model organism genomes. Genome Res. 18, 188–196 (2008).
47. M. Stanke, M. Diekhans, R. Baertsch, D. Haussler, Using native and syntenically mapped cDNA alignments to improve de novo gene finding. Bioinformatics 24, 637–644 (2008). 48. I. Korf, Gene finding in novel genomes. BMC Bioinformatics 5, 59 (2004).
49. Z. Huang, A. Gallot, N. T. Lao, S. J. Puechmaille, N. M. Foley, D. Jebb, M. Bekaert, E. C. Teeling, A nonlethal sampling method to obtain, generate and assemble whole blood transcriptomes from small, wild mammals. Mol. Ecol. Resour. 16, 150–162 (2015). 50. S. F. Altschul, T. L. Madden, A. A. Schäffer, J. Zhang, Z. Zhang, W. Miller, D. J. Lipman,
Gapped BLAST and PSI-BLAST: A new generation of protein database search programs. Nucleic Acids Res. 25, 3389–3402 (1997).
51. C. Camacho, G. Coulouris, V. Avagyan, N. Ma, J. Papadopoulos, K. Bealer, T. L. Madden, BLAST+: Architecture and applications. BMC Bioinformatics 10, 421 (2009).
52. R. C. Gentleman, V. J. Carey, D. M. Bates, B. Bolstad, M. Dettling, S. Dudoit, B. Ellis, L. Gautier, Y. Ge, J. Gentry, K. Hornik, T. Hothorn, W. Huber, S. Iacus, R. Irizarry, F. Leisch, C. Li, M. Maechler, A. J. Rossini, G. Sawitzki, C. Smith, G. Smyth, L. Tierney, J. YH Yang, J. Zhang, Bioconductor: Open software development for computational biology and bioinformatics. Genome Biol. 5, R80 (2004).
53. G. S. Slater, E. Birney, Automated generation of heuristics for biological sequence comparison. BMC Bioinformatics 6, 31 (2005).
54. P. Rice, I. Longden, A. Bleasby, EMBOSS: The European Molecular Biology Open Software Suite. Trends Genet. 16, 276–277 (2000).
55. J. Muller, C. J. Creevey, J. D. Thompson, D. Arendt, P. Bork, AQUA: Automated quality improvement for multiple sequence alignments. Bioinformatics 26, 263–265 (2010). 56. R. C. Edgar, MUSCLE: Multiple sequence alignment with high accuracy and high
throughput. Nucleic Acids Res. 32, 1792–1797 (2004).
57. K. Katoh, K. Misawa, K.-I. Kuma, T. Miyata, MAFFT: A novel method for rapid multiple sequence alignment based on fast Fourier transform. Nucleic Acids Res. 30, 3059–3066 (2002).
58. K. Katoh, D. M. Standley, MAFFT multiple sequence alignment software version 7: Improvements in performance and usability. Mol. Biol. Evol. 30, 772–780 (2013). 59. J. D. Thompson, J.-C. Thierry, O. Poch, RASCAL: Rapid scanning and correction of multiple
sequence alignments. Bioinformatics 19, 1155–1161 (2003).
60. J. D. Thompson, F. Plewniak, R. Ripp, J.-C. Thierry, O. Poch, Towards a reliable objective function for multiple sequence alignments. J. Mol. Biol. 314, 937–951 (2001). 61. A. Löytynoja, N. Goldman, Phylogeny-aware gap placement prevents errors in sequence
alignment and evolutionary analysis. Science 320, 1632–1635 (2008).
62. J. Castresana, Selection of conserved blocks from multiple alignments for their use in phylogenetic analysis. Mol. Biol. Evol. 17, 540–552 (2000).
63. Z. Yang, PAML 4: Phylogenetic analysis by maximum likelihood. Mol. Biol. Evol. 24, 1586–1591 (2007).
64. J. Köster, S. Rahmann, Snakemake—A scalable bioinformatics workflow engine. Bioinformatics 28, 2520–2522 (2012).
65. M. Ruedi, B. Stadelmann, Y. Gager, E. J. Douzery, C. M. Francis, L.-K. Lin, A. Guillén-Servent, A. Cibois, Molecular phylogenetic reconstructions identify East Asia as the cradle for the evolution of the cosmopolitan genus Myotis (Mammalia, Chiroptera). Mol. Phylogenet. Evol. 69, 437–449 (2013).
66. J. Zhang, R. Nielsen, Z. Yang, Evaluation of an improved branch-site likelihood method for detecting positive selection at the molecular level. Mol. Biol. Evol. 22, 2472–2479 (2005). 67. C. J. Weadick, B. S. Chang, An improved likelihood ratio test for detecting site-specific
functional divergence among clades of protein-coding genes. Mol. Biol. Evol. 29, 1297–1300 (2012).
68. R. Patro, S. M. Mount, C. Kingsford, Sailfish enables alignment-free isoform quantification from RNA-seq reads using lightweight algorithms. Nat. Biotechnol. 32, 462–464 (2014). 69. M. I. Love, W. Huber, S. Anders, Moderated estimation of fold change and dispersion
for RNA-seq data with DESeq2. Genome Biol. 15, 550 (2014).
70. D. Szklarczyk, A. Franceschini, S. Wyder, K. Forslund, D. Heller, J. Huerta-Cepas, M. Simonovic, A. Roth, A. Santos, K. P. Tsafou, M. Kuhn, P. Bork, L. J. Jensen, C. von Mering, STRING v10: Protein–protein interaction networks, integrated over the tree of life. Nucleic Acids Res. 43, D447–D452 (2014).
71. D. Dong, M. Lei, P. Hua, Y.-H. Pan, S. Mu, G. Zheng, E. Pang, K. Lin, S. Zhang, The genomes of two bat species with long constant frequency echolocation calls. Mol. Biol. Evol. 34, 20–34 (2016).
72. E. B. Kim, X. Fang, A. A. Fushan, Z. Huang, A. V. Lobanov, L. Han, S. M. Marino, X. Sun, A. A. Turanov, P. Yang, S. H. Yim, X. Zhao, M. V. Kasaikina, N. Stoletzki, C. Peng, P. Polak, Z. Xiong, A. Kiezun, Y. Zhu, Y. Chen, G. V. Kryukov, Q. Zhang, L. Peshkin, L. Yang, R. T. Bronson, R. Buffenstein, B. Wang, C. Han, Q. Li, L. Chen, W. Zhao, S. R. Sunyaev, T. J. Park, G. Zhang, J. Wang, V. N. Gladyshev, Genome sequencing reveals insights into physiology and longevity of the naked mole rat. Nature 479, 223–227 (2011). 73. P. Pavlidis, J. D. Jensen, W. Stephan, A. Stamatakis, A critical assessment of storytelling:
Gene ontology categories and the importance of validating genomic scans. Mol. Biol. Evol. 29, 3237–3248 (2012).
74. J. M. Pascal, P. J. O’Brien, A. E. Tomkinson, T. Ellenberger, Human DNA ligase I completely encircles and partially unwinds nicked DNA. Nature 432, 473–478 (2004).
75. C. Spiess, A. S. Meyer, S. Reissmann, J. Frydman, Mechanism of the eukaryotic chaperonin: Protein folding in the chamber of secrets. Trends Cell Biol. 14, 598–604 (2004). 76. A.-B. Shyu, M. F. Wilkinson, The double lives of shuttling mRNA binding proteins. Cell 102,
135–138 (2000).
77. H. Pride, Z. Yu, B. Sunchu, J. Mochnick, A. Coles, Y. Zhang, R. Buffenstein, P. J. Hornsby, S. N. Austad, V. I. Pérez, Long-lived species have improved proteostasis compared to phylogenetically-related shorter-lived species. Biochem. Biophys. Res. Commun. 457, 669–675 (2015).
78. G. Zhang, C. Cowled, Z. Shi, Z. Huang, K. Bishop-Lilly, X. Fang, J. W. Wynne, Z. Xiong, M. L. Baker, W. Zhao, M. Tachedjian, Y. Zhu, P. Zhou, X. Jiang, J. Ng, L. Yang, L. Wu, J. Xiao, Y. Feng, Y. Chen, X. Sun, Y. Zhang, G. A. Marsh, G. Crameri, C. C. Broder, K. G. Frey, L.-F. Wang, J. Wang, Comparative analysis of bat genomes provides insight into the evolution of flight and immunity. Science 339, 456–460 (2013).
79. F. Olivieri, M. R. Rippo, V. Monsurrò, S. Salvioli, M. Capri, A. D. Procopio, C. Franceschi, MicroRNAs linking inflamm-aging, cellular senescence and cancer. Ageing Res. Rev. 12, 1056–1068 (2013).
80. L. Fang, S. Choudhary, Y. Zhao, C. B. Edeh, C. Yang, I. Boldogh, A. R. Brasier, ATM regulates NF-kB-dependent immediate-early genes via RelA Ser 276 phosphorylation coupled to CDK9 promoter recruitment. Nucleic Acids Res. 42, 8416–8432 (2014).
81. M. S. Miller, A. Rialdi, J. S. Y. Ho, M. Tilove, L. Martinez-Gil, N. P. Moshkina, Z. Peralta, J. Noel, C. Melegari, A. M. Maestre, P. Mitsopoulos, J. Madrenas, S. Heinz, C. Benner, J. A. T. Young, A. R. Feagins, C. F. Basler, A. Fernandez-Sesma, O. J. Becherel, M. F. Lavin, H. van Bakel, I. Marazzi, Senataxin suppresses the antiviral transcriptional response and controls viral biogenesis. Nat. Immunol. 16, 485–494 (2015).
82. M. Yugami, Y. Kabe, Y. Yamaguchi, T. Wada, H. Handa, hnRNP‐U enhances the expression of specific genes by stabilizing mRNA. FEBS Lett. 581, 1–7 (2007).
83. I. Seim, X. Fang, Z. Xiong, A. V. Lobanov, Z. Huang, S. Ma, Y. Feng, A. A. Turanov, Y. Zhu, T. L. Lenz, M. V. Gerashchenko, D. Fan, S. H. Yim, X. Yao, D. Jordan, Y. Xiong, Y. Ma, A. N. Lyapunov, G. Chen, O. I. Kulakova, Y. Sun, S.-G. Lee, R. T. Bronson, A. A. Moskalev, S. R. Sunyaev, G. Zhang, A. Krogh, J. Wang, V. N. Gladyshev, Genome analysis reveals insights into physiology and longevity of the Brandt’s bat Myotis brandtii. Nat. Commun. 4, 2212 (2013).
84. Z. Chen, D. E. Hagen, C. G. Elsik, T. Ji, C. J. Morris, L. E. Moon, R. M. Rivera, Characterization of global loss of imprinting in fetal overgrowth syndrome induced by assisted reproduction. Proc. Natl. Acad. Sci. U.S.A. 112, 4618–4623 (2015).
85. H. Bao, A. Kommadath, X. Sun, Y. Meng, A. S. Arantes, G. S. Plastow, L. L. Guan, P. Stothard, Expansion of ruminant-specific microRNAs shapes target gene expression divergence between ruminant and non-ruminant species. BMC Genomics 14, 609 (2013). 86. M. Li, S. Tian, L. Jin, G. Zhou, Y. Li, Y. Zhang, T. Wang, C. K. Yeung, L. Chen, J. Ma, J. Zhang,
A. Jiang, J. Li, C. Zhou, J. Zhang, Y. Liu, X. Sun, H. Zhao, Z. Niu, P. Lou, L. Xian, X. Shen, S. Liu, S. Zhang, M. Zhang, L. Zhu, S. Shuai, L. Bai, G. Tang, H. Liu, Y. Jiang, M. Mai, J. Xiao, X. Wang, Q. Zhou, Z. Wang, P. Stothard, M. Xue, X. Gao, Z. Luo, Y. Gu, H. Zhu, X. Hu, Y. Zhao, G. S. Plastow, J. Wang, Z. Jiang, K. Li, N. Li, X. Li, R. Li, Genomic analyses identify distinct patterns of selection in domesticated pigs and Tibetan wild boars. Nat. Genet. 45, 1431–1438 (2013).
87. S. S. Sodhi, W. C. Park, M. Ghosh, J. N. Kim, N. Sharma, K. Y. Shin, I. C. Cho, Y. C. Ryu, S. J. Oh, S. H. Kim, K.-D. Song, S. P. Hong, S. A. Cho, H. B. Kim, D. K. Jeong, Comparative transcriptomic analysis to identify differentially expressed genes in fat tissue of adult Berkshire and Jeju Native Pig using RNA-seq. Mol. Biol. Rep. 41, 6305–6315 (2014). 88. I. Seim, S. Ma, X. Zhou, M. V. Gerashchenko, S.-G. Lee, R. Suydam, J. C. George, J. W. Bickham, V. N. Gladyshev, The transcriptome of the bowhead whale Balaena mysticetus reveals adaptations of the longest-lived mammal. Aging 6, 879–899 (2014).
89. S. Memczak, P. Papavasileiou, O. Peters, N. Rajewsky, Identification and characterization of circular RNAs as a new class of putative biomarkers in human blood. PLOS ONE 10, e0141214 (2015).
90. L. Fagerberg, B. M. Hallström, P. Oksvold, C. Kampf, D. Djureinovic, J. Odeberg, M. Habuka, S. Tahmasebpoor, A. Danielsson, K. Edlund, A. Asplund, E. Sjöstedt, E. Lundberg,
on September 12, 2018
http://advances.sciencemag.org/