HAL Id: hal-02658579
https://hal.inrae.fr/hal-02658579
Submitted on 30 May 2020
HAL is a multi-disciplinary open access archive for the deposit and dissemination of sci-entific research documents, whether they are pub-lished or not. The documents may come from teaching and research institutions in France or abroad, or from public or private research centers.
L’archive ouverte pluridisciplinaire HAL, est destinée au dépôt et à la diffusion de documents scientifiques de niveau recherche, publiés ou non, émanant des établissements d’enseignement et de recherche français ou étrangers, des laboratoires publics ou privés.
Revealing the dynamics of gene expression during
embryonic genome activation and first differentiation in
the rabbit embryo with a dedicated array screening
Roger Léandri, Catherine Archilla, Linh Chi Bui, Nathalie Peynot, Zichuan
Liu, Cédric Cabau, Annie Chastellier, Jean Paul Renard, Véronique
Duranthon
To cite this version:
Roger Léandri, Catherine Archilla, Linh Chi Bui, Nathalie Peynot, Zichuan Liu, et al.. Revealing the dynamics of gene expression during embryonic genome activation and first differentiation in the rabbit embryo with a dedicated array screening. Physiological Genomics, American Physiological Society, 2009, 36 (2), pp.98-113. �10.1152/physiolgenomics.90310.2008�. �hal-02658579�
Revealing the dynamics of gene expression during embryonic genome
activation and first differentiation in the rabbit embryo with a dedicated
array screening
R. D. Le´andri,1C. Archilla,1L. C. Bui,1N. Peynot,1Z. Liu,1C. Cabau,2A. Chastellier,3J. P. Renard,1
and V. Duranthon1
1INRA UMR 1198, Biologie du De´veloppement et Reproduction,2Agenae, Unite´ Mathe´matique, Informatique et Ge´nome,
and3UMR INRA/CEA Radiobiologie et Etude du Ge´nome/Centre de Ressources Biologiques pour la Ge´nomique des Animaux
d’Elevages et d’Inte´reˆt Economique, Jouy-en-Josas, France
Submitted 8 August 2008; accepted in final form 31 October 2008
Le´andri RD, Archilla C, Bui LC, Peynot N, Liu Z, Cabau C, Chastellier A, Renard JP, Duranthon V. Revealing the dynamics of gene expression during embryonic genome activation and first differ-entiation in the rabbit embryo with a dedicated array screening.
Physiol Genomics 36: 98 –113, 2009. First published November 11,
2008; doi:10.1152/physiolgenomics.90310.2008.—Early mammalian development is characterized by extensive changes in nuclear func-tions that result from epigenetic modificafunc-tions of the newly formed embryonic genome. While the first embryonic cells are totipotent, this status spans only a few cell cycles. At the blastocyst stage, the embryo already contains differentiated trophectoderm cells and pluripotent inner cell mass cells. Concomitantly, the embryonic genome becomes progressively transcriptionally active. During this unique period of development, the gene expression pattern has been mainly character-ized in the mouse, in which embryonic genome activation (EGA) spans a single cell cycle after abrupt epigenetic modifications. To further characterize this period, we chose to analyze it in the rabbit, in which, as in most mammals, EGA is more progressive and occurs closer to the first cell differentiation events. In this species, for which no transcriptomic arrays were available, we focused on genes ex-pressed at EGA and first differentiation and established a 2,000-gene dedicated cDNA array. Screening this with pre-EGA, early post-EGA, and blastocyst embryos divided genes into seven clusters of expres-sion according to their regulation during this period and revealed their dynamics of expression during EGA and first differentiation. Our results point to transient properties of embryo transcriptome at EGA, due not only to the transition between maternal and embryonic transcripts but also to the transient expression of a subset of embry-onic genes whose functions remained largely uncharacterized. They also provide a first view of the functional consequences of the changes in gene expression program.
blastocyst; morula; transient expression; maternal embryo transition
EARLY MAMMALIAN DEVELOPMENT is characterized by extensive
modifications in nuclear functions. In the few hours after fertilization, highly differentiated gamete nuclei are trans-formed into a totipotent zygote nucleus able to give rise to a whole organism. This transient totipotent state is equally shared by the early blastomeres (19, 36) and spans a few cell cycles. However, it disappears at the blastocyst stage, when the early embryo displays two distinct cell types: the trophecto-derm cells that are the first differentiated cells of the organism and the pluripotent inner cell mass cells (27). This rapid
transition in embryonic nuclear function resulting from epige-netic modifications is concomitant to a transition in geepige-netic control of embryo development. Since the newly formed em-bryonic nucleus is first transcriptionally silent (22), the earliest developmental events are triggered by a maternally encoded gene expression program regulated at the posttranscriptional level. During the first cleavages, the embryonic nuclei become progressively transcriptionally active, so that embryonic devel-opment progressively becomes controlled by the embryonic genome (see Ref. 21 for review).
During this very unique period of development the embryo transcriptome has been mainly characterized in the mouse embryo (17, 34, 37, 38). From these analyses, it appears that gene expression is finely regulated as soon as the embryonic genome is transcribed, and results in a specific transcriptome (13, 14, 20).
The mouse embryo, however, is a particular model. The transcriptional activation of its genome spans a single cell cycle, so that development beyond the two-cell stage already depends on the embryonic genome (3, 15). This abrupt tran-scriptional activation thus takes place long before the appear-ance of the first differentiated cells at the blastocyst stage. In addition, it occurs concomitantly with extensive and asymmet-ric modifications of parental genome epigenetic status. This is first evidenced by an active demethylation of the paternal genome during the one-cell stage as well as an extensive and more progressive demethylation of the maternal genome over the first cell divisions (30). In contrast, in most mammalian species, including humans (4), embryonic genome transcrip-tional activation spans several cell cycles (5, 7–9, 24). In species with delayed genome transcriptional activation, the embryo relies on maternally inherited factors for a longer period than in the mouse and the activation of the embryonic genome occurs closer to the first cell differentiation events. Moreover, many recent epigenetic studies have underlined the specificity of the mouse, because most mammals show pro-gressive epigenetic modifications over several embryonic cell cycles, to an extent that varies with species (16).
To characterize the transcriptome of early embryonic cells, during their genome activation as well as the progressive restriction of their totipotency, it is necessary to provide further data on species with delayed transcriptional activation and with
Address for reprint requests and other correspondence: R. D. Le´andri, Laboratoire de Biologie de la Reproduction, Hoˆpital Paule de Viguier, 330, Ave. de Grande Bretagne, TSA, 70034-31059 Toulouse Cedex 9, France (e-mail: [email protected]).
The costs of publication of this article were defrayed in part by the payment of page charges. The article must therefore be hereby marked “advertisement” in accordance with 18 U.S.C. Section 1734 solely to indicate this fact. First published November 11, 2008; doi:10.1152/physiolgenomics.90310.2008.
by 10.220.33.4 on December 6, 2016
http://physiolgenomics.physiology.org/
various extents of embryonic genome epigenetic modifications. We therefore chose the rabbit as an alternative model to analyze variations in gene expression during the period of embryonic genome activation (EGA) and appearance of the first differentiations. In this species, the transcriptional activa-tion of the embryonic genome only is required to lead further embryo development from the 8- to 16-cell stage onward (24), although the embryonic genome is already able to transcribe at the end of the 1-cell stage (8). Furthermore, epigenetic alter-ations that accompany this transition period are quite different from those observed in the mouse embryo: the paternal genome either remains highly methylated (1, 30) or may be transiently demethylated and then remethylated (29) during the one-cell stage, and the global demethylation of the embryonic genome over the period of cleavage and EGA is very limited (1, 31).
The rabbit has been retained for deep-coverage sequencing of its genome mainly because of its interest in biomedical research, including analysis of drug effects on embryo and fetal development (http://www.genome.gov/25521745). Transcrip-tomic tools are, however, still not commercially available in this species, for which genome annotation is in progress. To characterize transcriptome variations during EGA and first differentiations in in vivo-developed rabbit embryos, we thus established a rabbit cDNA array dedicated to this critical period of development and screened it with pre- and early post-EGA embryos as well as blastocysts. Our results point to transient properties of the transcriptome at EGA, and provide first information concerning the functional relay between ma-ternal and embryonic information over this period in the rabbit species.
MATERIALS AND METHODS
Embryo collection. The experiment was performed in accordance
with the International Guiding Principles for Biomedical Research involving animals as promulgated by the Society for the Study of Reproduction and with the European Convention on Animal Experi-mentation. Researchers involved in direct work with the animals possessed an animal experimentation license from the French veteri-nary services.
New Zealand White female rabbit (INRA line 1077) were super-ovulated as described by Henrion et al. (18) and mated with normal males. In vivo four-cell stage, early morulae (20 –30 cells), late morulae, and blastocyst stage embryos were recovered from oviducts and uterus flushed with PBS at 32, 50, 65 and 90 hours postcoitum (hpc), respectively. In vitro embryos were recovered at the one-cell stage (19 hpc) from superovulated females. They were cultured from the one-cell stage onward (19 hpc) until the early morula (58 hpc) and blastocyst (100 hpc) stages in four different culture media: B2 me-dium (Laboratoire C.C.D., Paris, France), B2 meme-dium plus 2.5% fetal calf serum; ISM1/ISM2sequential medium (Medicult, Jyllinge,
Den-mark) with a transition from ISM1to ISM2at the eight-cell stage; and
G1/G2 sequential medium (Vitrolife, Kungsbacka, Sweden) with a
transition at the early morula stage (the sequences used for embryo culture mimicked those used in human in vitro fertilization in terms of genome transcriptional activation timing).
Construction of libraries and clone sequencing. Total RNA was
extracted from batches of embryos (n ⫽ 60–140 depending on embryo stage and culture condition) with the RNeasy Mini Kit (Qiagen) and a DNase I treatment (37°C, 30 min).
Two different cDNA subtracted libraries were constructed. Tester materials (early morulae and blastocysts) contained equal proportions of total RNA from embryos produced in each of the in vivo or in vitro conditions: 110 ng from each condition for the EGA library and 145
ng for the first differentiation (FD) library. In vitro-produced embryos were included in the tester materials because we aimed at using our dedicated array also for the analysis of in vitro-developed embryos (Leandri et al., manuscript in preparation). Driver materials (4-cell embryos and late morulae) exclusively contained total RNA from in vivo-developed embryos: 550 ng for the EGA library and 725 ng for the FD library.
Starting from total RNA, cDNA synthesis and amplification was carried out with the SMART PCR cDNA amplification procedure (SMART-PCR cDNA Synthesis Kit, Clontech, Palo Alto, CA). Sub-tracted libraries were constructed by suppressive subtractive hybrid-ization (SSH) with the PCR Select cDNA Subtraction Kit (Clontech) as described by Bui et al. (6). PCR-amplified subtracted products were cloned into the pGEM-T-Easy vector (Promega France, Charbon-nie`res, France). DH5␣ Max-Efficiency Escherichia coli bacteria (In-vitrogen, Cergy Pontoise, France) were transformed. After overnight culture, they were arrayed in 384-well plates. Replicates of these arrayed libraries were spotted onto nylon membranes (Hybond N⫹, Amersham, Little Chalfont, UK). Since no endogenous transcript with constant expression during preimplantation development is known in the rabbit embryo, the addition of exogenous reporter transcripts mimicking tester-driver common transcripts or tester-specific tran-scripts allowed us to validate the quality of the subtraction procedure in both of the libraries (6). We showed that the SSH procedure makes it possible to clone very scarce tester-specific transcripts (0.0005% of the total mRNAs). However, some subtraction failures occurred for very abundant transcripts (6). Therefore, we used a two-step sequenc-ing procedure to reduce the redundancy among the sequenced clones. First, 1,920 clones from the FD library were sequenced. Sequences were analyzed with the SURF software suite (see http://www.sigenae. org/fileadmin/Sigenae/Documentation/SURF_Users_Guide-0.6.pdf for details), resulting in 1,550 “good quality” expressed sequence tags (ESTs). The corresponding 1,550 bacterial clones were then pooled and cultured in liquid Luria Bertani medium before plasmid extraction (Wizard Plasmid Miniprep, Promega). cDNA inserts were PCR am-plified with NP1 and NP2R primers (PCR Select cDNA Subtraction Kit, Clontech). This amplified material was [␣-33P]ATP labeled
(Atlas SMART Probe Amplification Kit, Clontech). This radiolabeled target was hybridized to 4,608 new FD library clones and 4,608 EGA library clones spotted on nylon macroarrays. Nine hundred sixty clones from the FD library and 2,400 clones from the EGA library were selected as negative and sequenced. Eight hundred fifty-six and 2,029 good-quality sequences were selected by the SURF procedure. The resulting 2,406 FD ESTs and 2,029 EGA ESTs were then assembled into contigs with the publicly available rabbit ESTs, using Megablast and CAP-3 tools (see http://www.sigenae.org/fileadmin/Sigenae/Documenta-tion/SIGENAE_ContigBrowser_User_Manual_0.4.pdf for details). Two thousand twenty-two contigs containing at least one of these ESTs were built.
For each of the 2,022 contigs, the longest EST was selected. The corresponding clones were cultured in a fresh 2YT medium contain-ing ampicillin. They were submitted to an hyposmotic freezcontain-ing/ thawing lysis. cDNA inserts were amplified by PCR using universal M13 and M13 reverse primers and PCR Master Mix (Promega) starting from 10l of bacterial lysis. Quality of the PCR inserts was checked on a 2% agarose gel. PCR products were concentrated with a speed-vac concentrator and spotted on a nylon microarray with a Microgrid II robot (Biorobotics, Cambridge, UK) to obtain a 2,304-spot probe (containing negative and positive controls).
Unigene annotations of the rabbit embryo cDNA contigs. Contig
sequences obtained from the EST clustering were blasted on the Human Unigene Database and the Mouse Unigene Database. Since the length of the rabbit contig sequences varies widely, we did not retain informative annotations according to the length-dependent score but according to the E value, which is length independent. Only annotations with a blast E value inferior to 10⫺30 were retained as informative.
by 10.220.33.4 on December 6, 2016
http://physiolgenomics.physiology.org/
Target amplifications. Targets were composed of batches of in vivo
embryos (16 blastocysts, 34 early morulae, or 52 four-cell-stage embryos). Each batch originated from at least three different rabbit couples. For each stage, three replicates were conducted. Total RNA was extracted as previously described and divided into two equal parts. One half was used for a single-round in vitro transcription of antisense RNA (aRNA) with the MessageAmp aRNA Kit (Ambion, Austin, TX) according to manufacturer’s instructions. The second half was used for “global RT-PCR” amplification according to the protocol described by Pacheco-Trigon et al. (28). Indeed, we observed that the use of two independent amplification procedures makes it possible to detect a greater number of differentially expressed genes by an ANOVA analysis that takes the amplification method into account (L. C. Bui, unpublished observation). Each repeat was amplified according to both methods, with one repeat of each stage being amplified at the same time in order to minimize potential technical bias.
Labeling and microarray hybridization. Prehybridization of the
microarrays was performed in 12-ml glass tubes with 1 ml of Ex-pressHyb Hybridization Solution (Clontech) at 68°C over 44 h.
An Atlas SMART Probe Amplification Kit (Clontech) and [␣-33P]ATP (Perkin Elmer, Waltham, MA) were used to label 500 ng
of cDNA from the global RT-PCR. Five hundred nanograms of aRNA were reverse transcribed and [␣-33P]ATP labeled as described by
Decraene et al. (10). Unincorporated nucleotides were eliminated by passage through a 1-ml G50-Sephadex column. Labeled targets re-covered in a 50-l final volume were added to the prehybridization solution. Hybridization was performed at 68°C for 24 h. Membranes were washed four times in 2⫻ SSC, 1% SDS at 68°C for 30 min and once in 0.1⫻ SSC, 0.5% SDS at 68°C for 30 min . Microarrays were then exposed to a phosphoscreen (IP plate, FujiFilm) for 20 h and scanned on a Fuji BAS 5000 phosphorimager. Hybridization signals were quantified with AGScan software (http://mulcyber.toulouse.inra. fr/gf/project/agscan).
Statistical analysis. After quantification, hybridization signals were
log transformed and normalized before data analysis. All data sets are accessible in the NCBI Gene Expression Omnibus database (experi-mental series GSE12084). Differential analysis was performed by ANOVA with GenAnova software (11). For each array probe, the equation used for ANOVA was the following: Yijk⫽ ⫹ Si⫹ Mj⫹
Rk ⫹ εijk, where Yijk is array probe intensity; is the mean of
intensities of expression measured for the probe; Si, Mj, and Rkare the
effects of the analyzed stage i, the amplification method j, and the biological repetition k, respectively; and εijk is the residual error
including all interactions between these factors.
Hierarchical clustering. To classify our different “conditions,”
unsupervised hierarchical clustering was performed with Multiexperi-ment Viewer (TMeV) software from the TM4 suite (http://www. tm4.org/mev.html).
Functional analysis of the rabbit embryo transcriptome. Functional
interpretation of the microarray data was performed based on the Gene Ontology (GO) consortium annotation categories GO biological process, GO molecular function, and GO cellular component with the GeneTools web service (www.genetools.no). This software was cho-sen because it allows input of a gene reporter list (in our case Unigene cluster ID) without any specification concerning the species, which made it possible to take into account information obtained either from human or from mouse data banks. This resulted in a higher number of annotated sequences. Moreover, GeneTools (2) not only finds over- or underrepresented GO categories in a defined list of genes, comparing them to all the GO categories represented on the microarray, but also permits a direct comparison of two candidate gene lists, which is particularly interesting when performing a gene expression profile cluster-based comparison.
Real time RT-PCR. RNA was extracted from batches of 40
in vivo-developed embryos at the four-cell, early morula (20 –30 cell), and blastocyst stages as described above. cDNAs were synthesized
from total RNA extracted from the 40 embryos with the Superscript III enzyme (Invitrogen) and random primer hexamers (Roche Diag-nostics, Meylan, France) in a 20-l final volume. The RT reaction was diluted to 400l in water. Each RT reaction was used to quantify the six candidate genes.
A PCR mix was prepared for each gene as follows: 12.5l of 2⫻ Sybr Green Mastermix (Applied Biosystems, Courtaboeuf, France), 0.25l of uracyl N-glycosylase (1 U/l), 0.5 l of each primer (10 M initial concentration), 1.25 l of H2O, 10l for each diluted RT
reaction. For each sample the PCR reaction was carried out in triplicate and the mean threshold cycle was determined. The thermal cyclic profile started with a 2-min step at 50°C, followed by 10 min at 95°C and 45 cycles of 95°C denaturation for 15 s, 60°C annealing and extension for 60 s. The reactions were performed on an ABI Prism 7000 sequence detector (Applied Biosystems). Dissociation curves were performed after each PCR run to ensure that a single PCR product had been amplified. A standard curve consisting in 10-fold dilution series of quantified amplicon was included in each run. Experiments were carried out three times starting from distinct batches of embryos. The three samples corresponding to the different embryo stages and making one repetition were extracted, reverse transcribed, and PCR amplified simultaneously. Gene expression data were thus obtained first per embryo equivalent whatever the stage. However, because of the huge increase in cell number and total RNA content between the early morula and the blastocyst stage, such a quantification can result in an increase in amounts despite the fact that the real expression per cell is unchanged (or even perhaps decreased). For this reason, and because the transcriptome results were obtained by hybridizing constant amounts of labeled cDNAs regardless of stage, we normalized the real-time quantitative RT-PCR (qRT-PCR) results to express them relative to a constant amount of total messen-ger RNA whatever the stage. This was done by dividing at each stage the estimated number of transcript copies by the amount of total messenger RNA.
RESULTS AND DISCUSSION
Construction of rabbit cDNA array dedicated to early em-bryonic development. To obtain a first-generation cDNA array dedicated to the rabbit preimplantation embryo, we focused on two gene categories: those expressed by the genome just after EGA and those expressed once FD events have resulted in a blastocyst. We therefore combined a PCR amplification of all the cDNA and a SSH strategy to construct two independent subtracted libraries enriched in EGA and FD transcripts, re-spectively. The EGA library was obtained by subtracting the latest pre-EGA stage (4-cell stage) embryo cDNAs from the earliest post-EGA stage (20- to 30-cell early morulae) cDNAs. Similarly, the FD library was obtained by subtracting predif-ferentiation-stage (late morulae) cDNAs from early postdiffer-entiation-stage (blastocyst stage) cDNAs. Such subtracted li-braries, obtained from small amounts of starting RNA, have been shown to contain very scarce transcripts despite a nor-malization efficiency that varies with the initial abundance of the transcripts (6). For this reason, and also because early morulae and blastocysts express common genes, we applied a two-step sequencing strategy to both of these libraries before selecting candidate genes to include in our array. A first set of 1,920 clones from the FD library were sequenced. PCR inserts corresponding to 1,550 “high-quality” sequences of this set were then further hybridized to another set of 4,608 FD library clones, and to 4,608 EGA library clones, in order to select negative clones and eliminate positive redundant clones. From these two sets of FD and EGA library clones, 960 and 2,400
by 10.220.33.4 on December 6, 2016
http://physiolgenomics.physiology.org/
negative clones, respectively, were selected and sequenced, from which 856 and 2,029 “high-quality” sequences were obtained.
These sequences were then assembled with the available public rabbit ESTs into 2,022 contigs, of which 982 contain only EGA ESTs, 937 contain only FD ESTs, and only 103 contain both EGA and FD ESTs. The reduced size of this last category of contigs confirms the interest of the two-step se-quencing strategy we developed. Because ESTs were obtained by SSH, their size varies between 150 and 800 bp. For each contig, the longest EST was chosen as the best representative. PCR inserts of the corresponding clones were synthesized and spotted onto nylon micromembranes, thus resulting in the first 2,022-“unique contig” rabbit array.
Embryo transcriptome analysis. To analyze gene regulation at EGA and during the FD events we screened the new rabbit embryo dedicated array with cDNA complex targets corre-sponding to early (20 –30 cell) morulae, considered as an early post-EGA stage, and blastocyst-stage embryos. Since tran-scripts of maternal and embryonic origin coexist at these early stages, we included four-cell-stage embryo cDNAs in our screening because they represent the last stage containing the persistent maternal inheritance just before EGA. This addi-tional stage thus provided information about the origin of the transcripts.
Embryos from at least three different rabbit couples were pooled in each sample to avoid any maternal or paternal effect on gene expression. Three biological replicates per stage were performed, each corresponding to a different pool of embryos. For each biological sample, RNA was extracted and divided
into two equal parts. Each part was subjected to one amplifi-cation method: RT-PCR amplifiamplifi-cation of all the cDNAs or in vitro transcription of aRNA to obtain the target material. A total of 18 hybridizations were performed (6 for each stage corresponding to 3 biological repeats each amplified by 2 different methods).
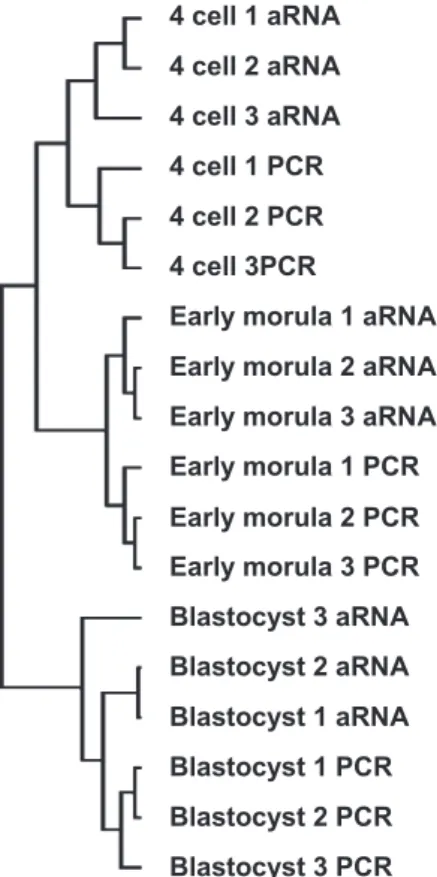
A hierarchical clustering of the experimental conditions was performed (Fig. 1). This clustering clearly individualized each of the three embryonic stages. Within each stage, the two amplification methods were then separated, evidencing an expected amplification method effect. The four-cell embryos and early morulae were grouped together, thus giving to the blastocyst stage a particular position regarding the expression of the genes present on the array. Interestingly, however, the blastocyst-to-early morula distance was greater than the blas-tocyst-to-four cell distance, indicating that the embryo tran-scriptome displayed transient properties at EGA.
To get more precise insight into the relationship between two successive stages, we performed a pairwise comparison of gene expression data for the three stages. Four hundred fifty-three and 505 genes were found differentially expressed [paired t-test, false discovery rate (FDR) ⬍ 0.05%] between four-cell and early morula stages and between early morula and blastocyst stages, respectively (Fig. 2). Among these differen-tially expressed genes, 262 genes (58.3%) displayed an in-creased expression between the four-cell and early morula stages, reflecting the expected increase in transcription at EGA, while only 200 genes (39.8%) showed an increased expression between the early morula and blastocyst stages. According to this screening, the proportion of genes whose expression in-creased was thus significantly higher during EGA than during the appearance of the first differentiations (P⬍ 10⫺7,2-test).
For a majority of the genes differentially expressed between the early morula and blastocyst stages (60.2% according to our screening), the amount of transcripts thus decreased between these two stages. Such a decrease might result either from the degradation of maternal transcripts or from an early downregu-lation of embryonic gene transcription. To distinguish both
Fig. 1. Hierarchical clustering analysis of the 18 experimental conditions involving all the genes present on the array. aRNA, antisense RNA.
Fig. 2. Up- and downregulated genes between 2 consecutive stages. Histogram shows the numbers of differentially expressed genes between 2 consecutive stages according to paired t-test with false discovery rate (FDR) correction (P⬍ 0.05) and their distribution into up- and downregulated genes. Propor-tions of up- and downregulated genes are significantly different during the transitions from 4-cell to early morula stage and from early morula to blastocyst stage (aP⬍ 0.002 andbP⬍ 10⫺7for up- and downregulated genes,
respectively).
by 10.220.33.4 on December 6, 2016
http://physiolgenomics.physiology.org/
possibilities and to obtain information about the expression changes of individual genes during preimplantation develop-ment, we performed a supervised nonhierarchical clustering with the K-means method (TmeV software).
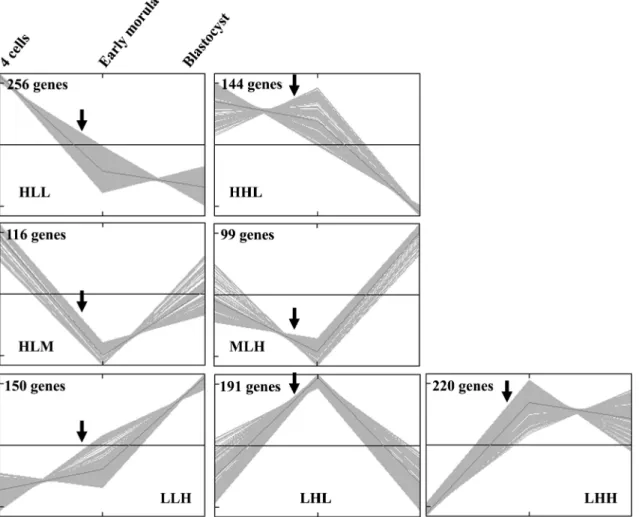
Expression profiles of individual genes. This clustering was performed for the subgroup of 1,176 genes displaying a “stage effect” with an FDR threshold of 0.10 when analyzed by ANOVA. These 1,176 genes were divided by the super-vised nonhierarchical clustering into seven clusters that will be referred to hereafter by a combination of three letters: H, L, and M for high, low, and medium describing the relative level of expression of the genes in the cluster at the four-cell, early morula (20 –30 cell), and blastocyst stages, re-spectively (Fig. 3).
We first validated this clustering in two different ways, comparing for some genes the pattern of expression obtained in this clustering with the profile established in a previous study (28) and comparing the clustering data with qRT-PCR results for six other candidate genes.
We previously had characterized in the rabbit embryo two categories of genes that displayed either transient or long-term induced expression at EGA. This distinction was founded on their different behavior between the 8- to 16-cell stage and the late morula stage: a decrease in expression was observed for
transiently expressed genes, whereas an increase in expression was observed for long-term induced genes (28). We first validated the clustering by comparing the results of this pre-vious characterization with those obtained in the present large-scale analysis for eight genes that are common to both analyses (Fig. 4). For those genes previously described as transiently expressed at EGA (SAMDC, clone 1, clone 8, clone 22, and clone 27), the patterns obtained in the present analysis approx-imately confirmed the transient expression at EGA. Small differences due to differences in the number and the exact timing of embryo stages were revealed in each study (only 3 stages were taken into account in the present analysis, and the early morula stage of the present study was flanked by the 8-to 16-cell and late morula stages analyzed in the previous analysis). The present study also confirmed the progressive increase in transcript accumulation for the genes previously described as “long-term induced” (ribl7, Uba80, and clone 72). Their rate of accumulation, however, might display some differences according to the study (see, for example, ribl7), which were probably caused by the use of two amplification methods in the present analysis. Based on the results obtained using these eight candidate genes, we concluded that our present results are valid.
Fig. 3. Time course analysis of individual genes. The 1,176 genes with a stage effect (ANOVA with FDR correction⬍0.10) were dispatched into 7 clusters by a K-means nonhierarchical clustering method. The mnemonic description of these clusters relies on a combination of 3 letters: H, L, and M for high, low, and medium, describing the relative level of expression of the genes in the cluster at the 4-cell, early morula (20 –30 cell), and blastocyst stages, respectively. Arrows indicate embryonic genome activation at the 8- to 16-cell stage.
by 10.220.33.4 on December 6, 2016
http://physiolgenomics.physiology.org/
Another way to validate the clustering results was to analyze by qRT-PCR the expression patterns of six additional candi-date genes that belong to three different clusters (clusters HLL, LHL, and LHH). We choose to analyze both identified and unidentified genes (see Table 1). RNAs were extracted from
pools of 40 in vivo developed embryos. Three independent pools were used at each stage (4 cells, 20- to 30-cell early morulae, and blastocyst stage) to provide three independent repetitions of the quantifications. Each pool of embryos was used to quantify the transcripts of the six candidate genes
Fig. 4. Validation of microarray data by comparison with patterns of expression previously established for 8 clones. Expression profiles obtained from the microarray data (mean of 6 hybridizations per stage: 3 biological repetitions and 2 amplification methods) are shown as dashed lines. In microarray experiments expression levels were assessed in 4-cell embryos [4c, 32 hours postcoitum (hpc)], early morulae (EM, 58 hpc), and blastocysts (Blasto, 100 hpc). Solid lines represent expression profiles previously characterized for these clones (28). In the previous analysis expression levels were assessed in zygotes (1c, 19 hpc), 4-cell (4c, 32 hpc), 8- to 16-cell embryos (8 –16, 50 hpc), late morulae (LM, 69 hpc), and blastocysts at 100 hpc; each line represents 1 repetition of the quantification experiment. Expression levels are expressed as % of maximal expression value detected for the clone.
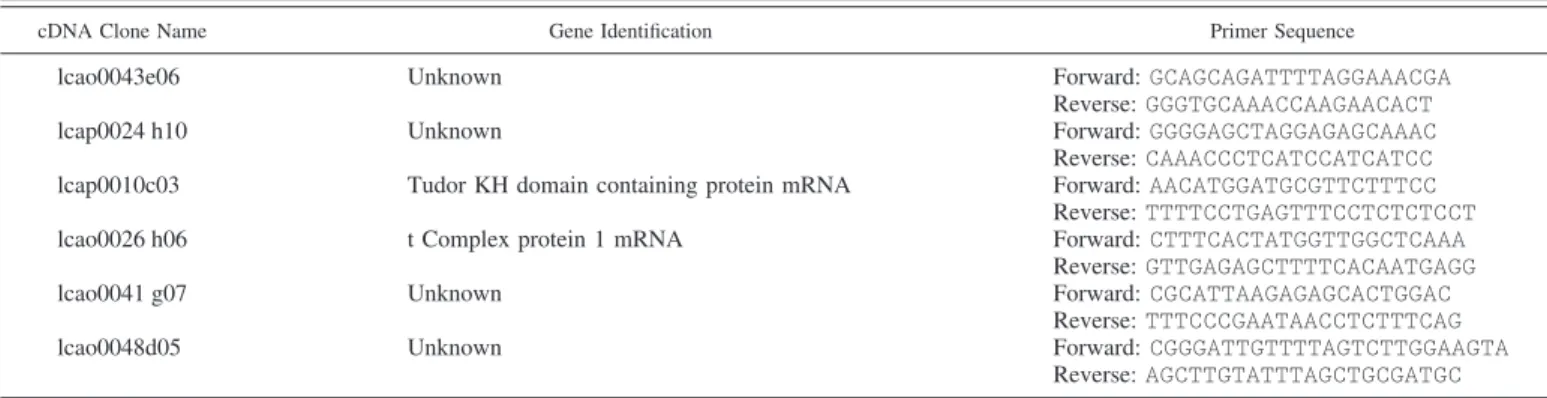
Table 1. Identification of candidate genes analyzed by qRT-PCR and sequence of corresponding primers
cDNA Clone Name Gene Identification Primer Sequence
lcao0043e06 Unknown Forward: GCAGCAGATTTTAGGAAACGA
Reverse: GGGTGCAAACCAAGAACACT
lcap0024 h10 Unknown Forward: GGGGAGCTAGGAGAGCAAAC
Reverse: CAAACCCTCATCCATCATCC lcap0010c03 Tudor KH domain containing protein mRNA Forward: AACATGGATGCGTTCTTTCC
Reverse: TTTTCCTGAGTTTCCTCTCTCCT
lcao0026 h06 t Complex protein 1 mRNA Forward: CTTTCACTATGGTTGGCTCAAA
Reverse: GTTGAGAGCTTTTCACAATGAGG
lcao0041 g07 Unknown Forward: CGCATTAAGAGAGCACTGGAC
Reverse: TTTCCCGAATAACCTCTTTCAG
lcao0048d05 Unknown Forward: CGGGATTGTTTTAGTCTTGGAAGTA
Reverse: AGCTTGTATTTAGCTGCGATGC qRT-PCR, quantitative real-time RT-PCR.
by 10.220.33.4 on December 6, 2016
http://physiolgenomics.physiology.org/
starting from one equivalent embryo per stage. The rough qRT-PCR results showed an apparent overexpression of the transcripts at the blastocyst stage compared with the large-scale transcriptomic analysis results (data not shown). In the rabbit embryo, however, the total amount of poly(A) RNA increased hugely at the blastocyst stage [⬃13 times more total poly(A) RNA at the blastocyst stage than at the previous stages] (12). Since the transcriptome results were obtained by hybridizing constant amounts of labeled cDNAs whatever the stage, we normalized the qRT-PCR results to express them relative to a constant amount of total messenger RNA whatever the stage; this was done by dividing at each stage the estimated number
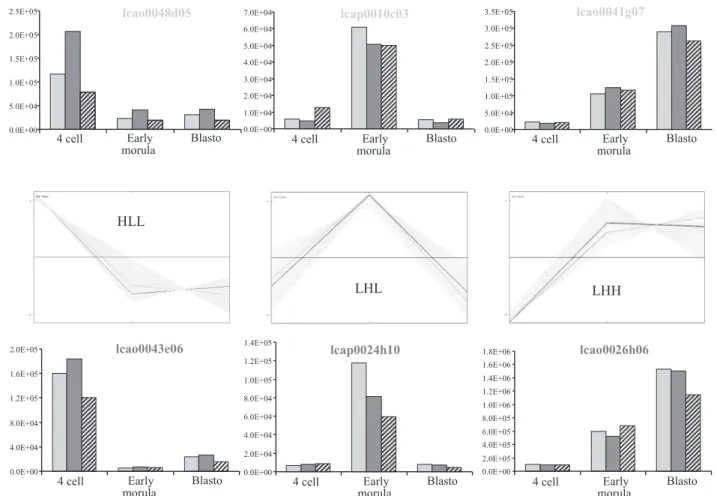
of transcript copies by the amount of total messenger RNA. In these conditions we observed a good correlation between qRT-PCR results and transcriptomic results for each candidate gene (Fig. 5). The initial discrepancies between both kinds of analysis was thus due to the relative underloading of the blastocyst sample in the transcriptome analysis, as discussed by Su et al. (32). We thus concluded that our transcriptome analysis properly described the relative quantities of transcripts in a constant amount of total messenger RNAs all over preim-plantation development.
Clusters HLL and HHL represented genes whose maternal transcripts were still abundant at the four-cell stage compared Table 2. Distribution of up- and downregulated genes among clusters
n Cluster HLL Cluster LLH Cluster HHL Cluster LHL Cluster HLM Cluster LHH Cluster MLH
Stage effect* 1,176 256 150 144 191 116 220 99
4-Cell to early morula† 264 0 13 (4.9) 0 93 (35.2) 0 158 (59.8) 0
4-Cell to early morula† 181 110 (60.8) 0 7 (3.8) 0 51 (28.2) 0 13 (7.2)
Early morula to blastocyst† 201 0 98 (48.8) 0 0 30 (14.9) 2 (0.01) 71 (35.3)
Early morula to blastocyst† 268 28 (10.4) 0 90 (33.6) 132 (43.4) 0 18 (6.7) 0 Data are total number of genes (n), upregulated ( ) and downregulated ( ) genes between the consecutive embryo stages, and their distribution among the 7 clusters关number (percentage)兴. The 1,176 genes with a stage effect in ANOVA were taken into account. L, low, M, medium, H, high expression. *ANOVA with false discovery rate (FDR) correction (P⬍ 0.1); †paired t-test with FDR correction (P ⬍ 0.05).
Fig. 5. Validation of the microarray data by quantitative real-time RT-PCR (qRT-PCR). Expression profiles of 6 candidate genes belonging to 3 different clusters (HLL, LHL, and LHH) were assessed by qRT-PCR. Three repetitions were performed starting from total RNA extracted from 3 different batches of 40 embryos at each of the 3 stages involved in the clustering. Total RNAs from 1 equivalent embryo were used for qRT-PCR with designed primers. Since messenger RNAs hugely increase at blastocyst stage in the rabbit, qRT-PCR values expressed in number of copies of the candidate transcript were normalized to relate them to a constant amount of mRNA whatever the stage (see details in the text). Dark gray and pale gray lines in each cluster represent the 2 gene profiles according to the microarray data. Their corresponding qRT-PCR results are represented on both sides.
by 10.220.33.4 on December 6, 2016
http://physiolgenomics.physiology.org/
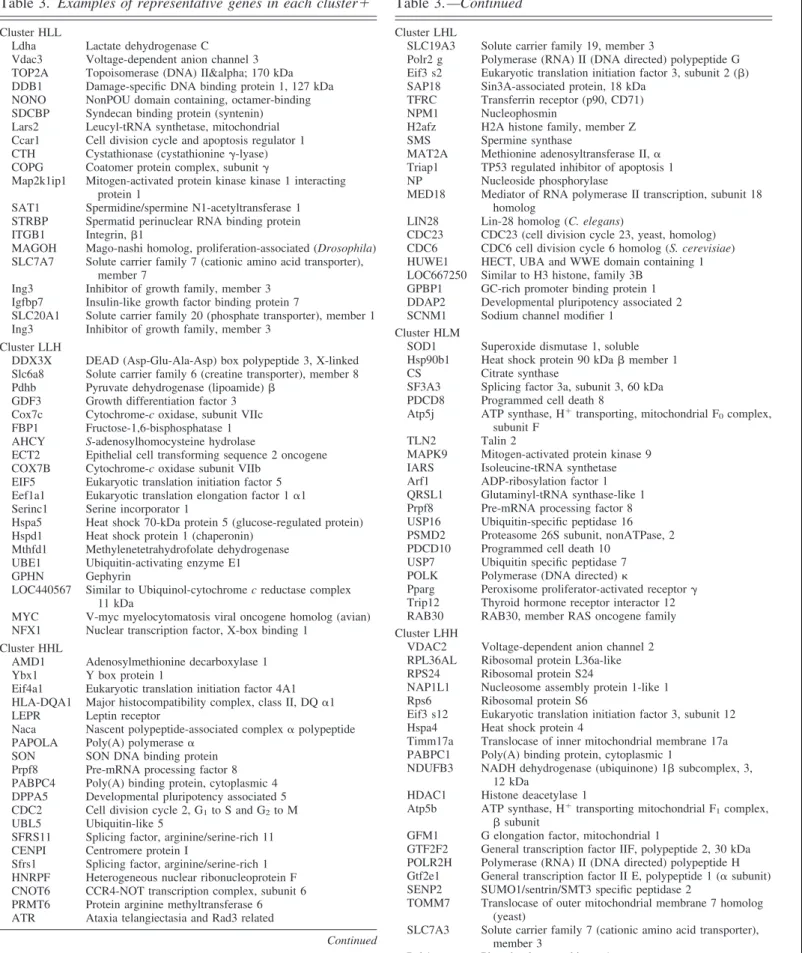
Table 3. Examples of representative genes in each cluster⫹
Cluster HLL
Ldha Lactate dehydrogenase C Vdac3 Voltage-dependent anion channel 3 TOP2A Topoisomerase (DNA) IIα 170 kDa DDB1 Damage-specific DNA binding protein 1, 127 kDa NONO NonPOU domain containing, octamer-binding SDCBP Syndecan binding protein (syntenin) Lars2 Leucyl-tRNA synthetase, mitochondrial Ccar1 Cell division cycle and apoptosis regulator 1 CTH Cystathionase (cystathionine␥-lyase) COPG Coatomer protein complex, subunit␥
Map2k1ip1 Mitogen-activated protein kinase kinase 1 interacting protein 1
SAT1 Spermidine/spermine N1-acetyltransferase 1 STRBP Spermatid perinuclear RNA binding protein ITGB1 Integrin,1
MAGOH Mago-nashi homolog, proliferation-associated (Drosophila) SLC7A7 Solute carrier family 7 (cationic amino acid transporter),
member 7
Ing3 Inhibitor of growth family, member 3 Igfbp7 Insulin-like growth factor binding protein 7
SLC20A1 Solute carrier family 20 (phosphate transporter), member 1 Ing3 Inhibitor of growth family, member 3
Cluster LLH
DDX3X DEAD (Asp-Glu-Ala-Asp) box polypeptide 3, X-linked Slc6a8 Solute carrier family 6 (creatine transporter), member 8 Pdhb Pyruvate dehydrogenase (lipoamide)
GDF3 Growth differentiation factor 3 Cox7c Cytochrome-c oxidase, subunit VIIc FBP1 Fructose-1,6-bisphosphatase 1 AHCY S-adenosylhomocysteine hydrolase
ECT2 Epithelial cell transforming sequence 2 oncogene COX7B Cytochrome-c oxidase subunit VIIb
EIF5 Eukaryotic translation initiation factor 5 Eef1a1 Eukaryotic translation elongation factor 1␣1 Serinc1 Serine incorporator 1
Hspa5 Heat shock 70-kDa protein 5 (glucose-regulated protein) Hspd1 Heat shock protein 1 (chaperonin)
Mthfd1 Methylenetetrahydrofolate dehydrogenase UBE1 Ubiquitin-activating enzyme E1 GPHN Gephyrin
LOC440567 Similar to Ubiquinol-cytochrome c reductase complex 11 kDa
MYC V-myc myelocytomatosis viral oncogene homolog (avian) NFX1 Nuclear transcription factor, X-box binding 1
Cluster HHL
AMD1 Adenosylmethionine decarboxylase 1 Ybx1 Y box protein 1
Eif4a1 Eukaryotic translation initiation factor 4A1 HLA-DQA1 Major histocompatibility complex, class II, DQ␣1 LEPR Leptin receptor
Naca Nascent polypeptide-associated complex␣ polypeptide PAPOLA Poly(A) polymerase␣
SON SON DNA binding protein Prpf8 Pre-mRNA processing factor 8 PABPC4 Poly(A) binding protein, cytoplasmic 4 DPPA5 Developmental pluripotency associated 5 CDC2 Cell division cycle 2, G1to S and G2to M
UBL5 Ubiquitin-like 5
SFRS11 Splicing factor, arginine/serine-rich 11 CENPI Centromere protein I
Sfrs1 Splicing factor, arginine/serine-rich 1 HNRPF Heterogeneous nuclear ribonucleoprotein F CNOT6 CCR4-NOT transcription complex, subunit 6 PRMT6 Protein arginine methyltransferase 6 ATR Ataxia telangiectasia and Rad3 related
Continued
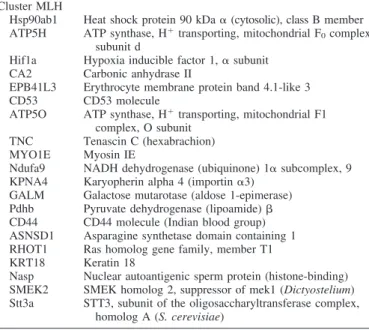
Table 3. —Continued
Cluster LHL
SLC19A3 Solute carrier family 19, member 3
Polr2 g Polymerase (RNA) II (DNA directed) polypeptide G Eif3 s2 Eukaryotic translation initiation factor 3, subunit 2 () SAP18 Sin3A-associated protein, 18 kDa
TFRC Transferrin receptor (p90, CD71) NPM1 Nucleophosmin
H2afz H2A histone family, member Z SMS Spermine synthase
MAT2A Methionine adenosyltransferase II,␣ Triap1 TP53 regulated inhibitor of apoptosis 1 NP Nucleoside phosphorylase
MED18 Mediator of RNA polymerase II transcription, subunit 18 homolog
LIN28 Lin-28 homolog (C. elegans)
CDC23 CDC23 (cell division cycle 23, yeast, homolog) CDC6 CDC6 cell division cycle 6 homolog (S. cerevisiae) HUWE1 HECT, UBA and WWE domain containing 1 LOC667250 Similar to H3 histone, family 3B
GPBP1 GC-rich promoter binding protein 1 DDAP2 Developmental pluripotency associated 2 SCNM1 Sodium channel modifier 1
Cluster HLM
SOD1 Superoxide dismutase 1, soluble Hsp90b1 Heat shock protein 90 kDa member 1 CS Citrate synthase
SF3A3 Splicing factor 3a, subunit 3, 60 kDa PDCD8 Programmed cell death 8
Atp5j ATP synthase, H⫹transporting, mitochondrial F0complex,
subunit F TLN2 Talin 2
MAPK9 Mitogen-activated protein kinase 9 IARS Isoleucine-tRNA synthetase Arf1 ADP-ribosylation factor 1 QRSL1 Glutaminyl-tRNA synthase-like 1 Prpf8 Pre-mRNA processing factor 8 USP16 Ubiquitin-specific peptidase 16 PSMD2 Proteasome 26S subunit, nonATPase, 2 PDCD10 Programmed cell death 10
USP7 Ubiquitin specific peptidase 7 POLK Polymerase (DNA directed)
Pparg Peroxisome proliferator-activated receptor␥ Trip12 Thyroid hormone receptor interactor 12 RAB30 RAB30, member RAS oncogene family Cluster LHH
VDAC2 Voltage-dependent anion channel 2 RPL36AL Ribosomal protein L36a-like RPS24 Ribosomal protein S24
NAP1L1 Nucleosome assembly protein 1-like 1 Rps6 Ribosomal protein S6
Eif3 s12 Eukaryotic translation initiation factor 3, subunit 12 Hspa4 Heat shock protein 4
Timm17a Translocase of inner mitochondrial membrane 17a PABPC1 Poly(A) binding protein, cytoplasmic 1
NDUFB3 NADH dehydrogenase (ubiquinone) 1 subcomplex, 3, 12 kDa
HDAC1 Histone deacetylase 1
Atp5b ATP synthase, H⫹transporting mitochondrial F1complex,
 subunit
GFM1 G elongation factor, mitochondrial 1
GTF2F2 General transcription factor IIF, polypeptide 2, 30 kDa POLR2H Polymerase (RNA) II (DNA directed) polypeptide H Gtf2e1 General transcription factor II E, polypeptide 1 (␣ subunit) SENP2 SUMO1/sentrin/SMT3 specific peptidase 2
TOMM7 Translocase of outer mitochondrial membrane 7 homolog (yeast)
SLC7A3 Solute carrier family 7 (cationic amino acid transporter), member 3 Pgk1 Phosphoglycerate kinase 1 Continued by 10.220.33.4 on December 6, 2016 http://physiolgenomics.physiology.org/ Downloaded from
with post-EGA stages. Cluster HLL gathered genes whose maternal transcripts were rapidly degraded between the four-cell and EGA stages, while cluster HHL gathered genes whose maternal transcript degradation was delayed until after the onset of embryonic transcription. The presence of such mater-nally expressed genes on our array dedicated to EGA and FD may result from defaults in subtraction efficiency when tran-scripts are abundant in both tester and driver material as described in our previous validation of SSH libraries obtained from early embryos (6). Clusters HLM and MLH regrouped genes whose transcripts were inherited from the oocyte at the four-cell stage, but were highly reexpressed from the embry-onic genome as soon as EGA. Both of these clusters differed from the relative abundance of maternally inherited transcripts still present at the four-cell stage and embryonic transcripts already accumulated at the blastocyst stage. Maternally inher-ited transcripts were predominant for cluster HLM genes, whereas they were less abundant than embryonic transcripts for cluster MLH genes. Clusters LLH, LHL, and LHH represented genes whose transcripts were scarce in the maternal inheritance at the four-cell stage and were hugely transcribed from the embryonic genome during the four cell-to-blastocyst period. These genes were dispatched between the three clusters ac-cording to both the stage of initiation of their transcription, EGA for cluster LHL and LHH or mainly post-EGA for cluster LLH, and the duration of their transcription period: “long-lasting” transcription for clusters LLH and LHH vs. abrupt and transient expression for cluster LHL.
To answer the question of the maternal or embryonic origin of the predominant gene downregulation evidenced after EGA, we investigated how downregulated genes were distributed across the different clusters (Table 2). Among the 1,176 genes dispatched in the 7 clusters, 268 genes were detected as downregulated between the early morula stage and the blasto-cyst stage (P⬍ 0.05, paired t-test with FDR correction), only 118 (28 ⫹ 90), or 44% (118/268), of which belonged to clusters HLL and HHL. These were maternally inherited
tran-scripts still in course of degradation after EGA. Embryonically transcribed genes thus significantly took part [56%, (132 ⫹ 18)/268] in the broad downregulation we showed after EGA, and most of these embryonically transcribed genes belonged to cluster LHL (transiently expressed at EGA, then abruptly downregulated). Their expression pattern was thus greatly responsible for the transient properties of EGA transcriptome evidenced by the hierarchical clustering of our hybridization experiments.
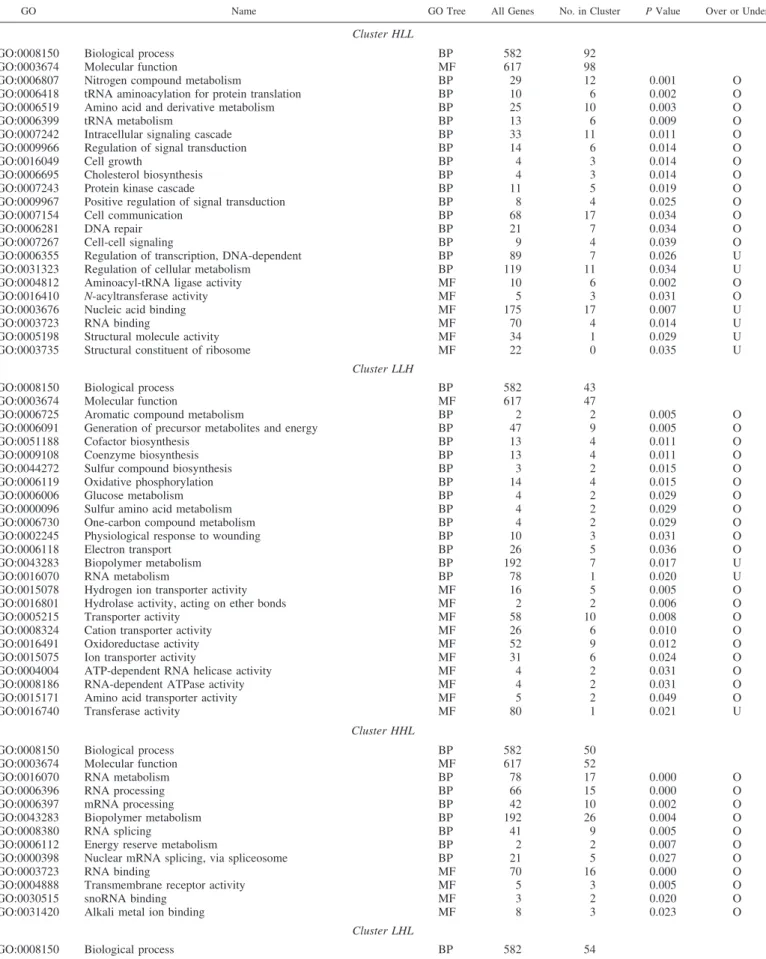
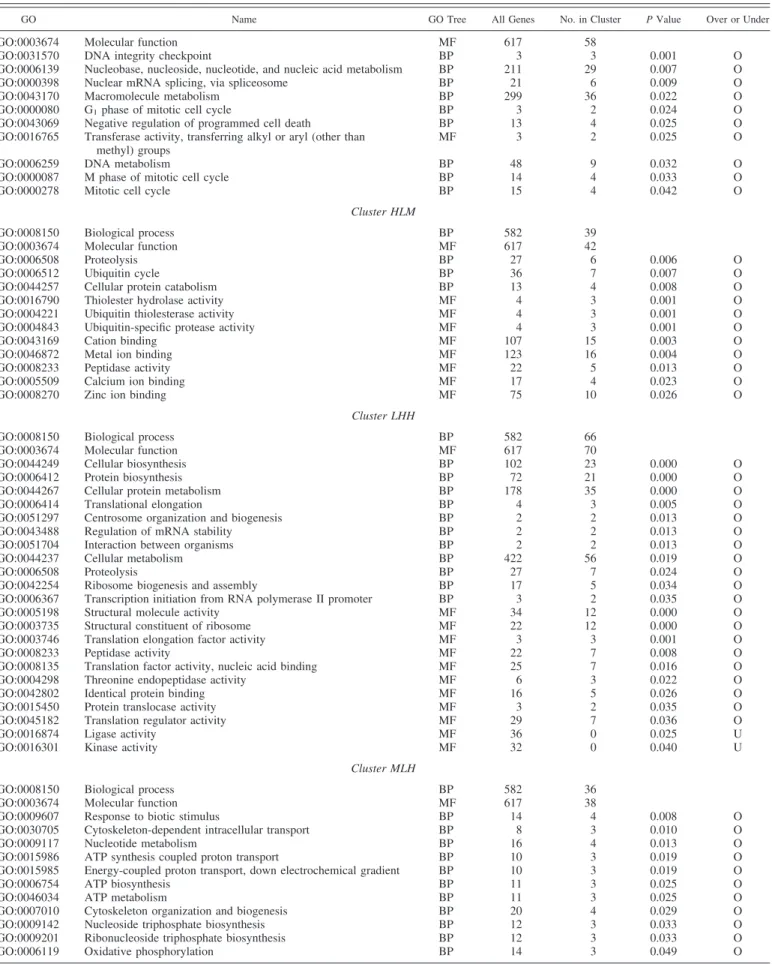
Functional evolution of embryo transcriptome from pre-EGA to FD stages. We looked for the identity of genes in each cluster and for their functional significance. Therefore, we blasted the sequences of the 2,022 contigs containing the ESTs present on the array against the human and mouse genomes and retained the significant results (E⬍ 10⫺30; seeMATERIALS AND METHODS). With this threshold, 65% of the genes present on our
array were identified and could be associated to a GO func-tional annotation. Table 3 gives examples of genes belonging to each of the seven clusters. We then performed an automated ontological analysis using the GeneTools web service (2). Table 4 gives a representative view of the GO categories over-or underrepresented in each cluster compared with those of the whole microarray. The most significant functions among these are pointed out thereafter, keeping, however, their diversity because it reflected the highly dynamic properties of the transcriptome at these early stages.
The main overrepresented biological processes in cluster HLL were “nitrogen compound metabolism,” “tRNA metabo-lism,” “amino acid and derivative metabometabo-lism,” and “intracel-lular signaling cascade,” while transcripts involved in “regu-lation of transcription, DNA dependent” were underrepre-sented among these pre-EGA eliminated maternal transcripts. Genes involved in “biopolymer metabolism” and “energy re-serve metabolism” were overrepresented in cluster HHL. In this cluster, “RNA metabolism” and “RNA processing” were also overrepresented. This suggested a delay in the degradation of maternal transcripts involved in these functions, making them available for the processing of the first embryonically encoded transcripts at EGA.
The most overrepresented genes in cluster HLM were in-volved in protein degradation, as exemplified by biological processes “proteolysis” and “ubiquitin cycle,” while cluster MLH gathered genes involved in “cytoskeleton-dependent in-tracellular transport,” “nucleotide metabolism,” and “ATP me-tabolism.”
Genes involved in cell metabolism were overrepresented in cluster LLH, while the mostly overrepresented genes in cluster LHH encoded for protein biosynthesis. Besides genes involved in “nuclear mRNA splicing via spliceosome,” cluster LHL displayed genes involved in “DNA integrity checkpoint,” “mi-tosis,” “DNA metabolism,” and “nucleobase and nucleic acid metabolism.” The corresponding genes were involved in “con-trol of mitotic program via DNA replication checkpoints” (CDC23, CDC6, Cdc2a) and in “negative regulation of pro-grammed cell death” (Triap1, TXNDC1, NPM1). Interestingly, a unique molecular function was found overrepresented in cluster LHL: “transferase activity, transferring alkyl or aryl groups.” However, the functions encoded by those genes grouped in cluster LHL in development were more difficult to describe since this cluster displayed the highest proportion of unannotated sequences according to our annotation strategy. Table 3. —Continued
Cluster MLH
Hsp90ab1 Heat shock protein 90 kDa␣ (cytosolic), class B member 1 ATP5H ATP synthase, H⫹transporting, mitochondrial F0complex,
subunit d
Hif1a Hypoxia inducible factor 1,␣ subunit CA2 Carbonic anhydrase II
EPB41L3 Erythrocyte membrane protein band 4.1-like 3 CD53 CD53 molecule
ATP5O ATP synthase, H⫹transporting, mitochondrial F1 complex, O subunit
TNC Tenascin C (hexabrachion) MYO1E Myosin IE
Ndufa9 NADH dehydrogenase (ubiquinone) 1␣ subcomplex, 9 KPNA4 Karyopherin alpha 4 (importin␣3)
GALM Galactose mutarotase (aldose 1-epimerase) Pdhb Pyruvate dehydrogenase (lipoamide) CD44 CD44 molecule (Indian blood group) ASNSD1 Asparagine synthetase domain containing 1 RHOT1 Ras homolog gene family, member T1 KRT18 Keratin 18
Nasp Nuclear autoantigenic sperm protein (histone-binding) SMEK2 SMEK homolog 2, suppressor of mek1 (Dictyostelium) Stt3a STT3, subunit of the oligosaccharyltransferase complex,
homolog A (S. cerevisiae)
by 10.220.33.4 on December 6, 2016
http://physiolgenomics.physiology.org/
Table 4. Functional analysis of genes in the seven clusters
GO Name GO Tree All Genes No. in Cluster P Value Over or Under
Cluster HLL
GO:0008150 Biological process BP 582 92
GO:0003674 Molecular function MF 617 98
GO:0006807 Nitrogen compound metabolism BP 29 12 0.001 O
GO:0006418 tRNA aminoacylation for protein translation BP 10 6 0.002 O
GO:0006519 Amino acid and derivative metabolism BP 25 10 0.003 O
GO:0006399 tRNA metabolism BP 13 6 0.009 O
GO:0007242 Intracellular signaling cascade BP 33 11 0.011 O
GO:0009966 Regulation of signal transduction BP 14 6 0.014 O
GO:0016049 Cell growth BP 4 3 0.014 O
GO:0006695 Cholesterol biosynthesis BP 4 3 0.014 O
GO:0007243 Protein kinase cascade BP 11 5 0.019 O
GO:0009967 Positive regulation of signal transduction BP 8 4 0.025 O
GO:0007154 Cell communication BP 68 17 0.034 O
GO:0006281 DNA repair BP 21 7 0.034 O
GO:0007267 Cell-cell signaling BP 9 4 0.039 O
GO:0006355 Regulation of transcription, DNA-dependent BP 89 7 0.026 U
GO:0031323 Regulation of cellular metabolism BP 119 11 0.034 U
GO:0004812 Aminoacyl-tRNA ligase activity MF 10 6 0.002 O
GO:0016410 N-acyltransferase activity MF 5 3 0.031 O
GO:0003676 Nucleic acid binding MF 175 17 0.007 U
GO:0003723 RNA binding MF 70 4 0.014 U
GO:0005198 Structural molecule activity MF 34 1 0.029 U
GO:0003735 Structural constituent of ribosome MF 22 0 0.035 U
Cluster LLH
GO:0008150 Biological process BP 582 43
GO:0003674 Molecular function MF 617 47
GO:0006725 Aromatic compound metabolism BP 2 2 0.005 O
GO:0006091 Generation of precursor metabolites and energy BP 47 9 0.005 O
GO:0051188 Cofactor biosynthesis BP 13 4 0.011 O
GO:0009108 Coenzyme biosynthesis BP 13 4 0.011 O
GO:0044272 Sulfur compound biosynthesis BP 3 2 0.015 O
GO:0006119 Oxidative phosphorylation BP 14 4 0.015 O
GO:0006006 Glucose metabolism BP 4 2 0.029 O
GO:0000096 Sulfur amino acid metabolism BP 4 2 0.029 O
GO:0006730 One-carbon compound metabolism BP 4 2 0.029 O
GO:0002245 Physiological response to wounding BP 10 3 0.031 O
GO:0006118 Electron transport BP 26 5 0.036 O
GO:0043283 Biopolymer metabolism BP 192 7 0.017 U
GO:0016070 RNA metabolism BP 78 1 0.020 U
GO:0015078 Hydrogen ion transporter activity MF 16 5 0.005 O
GO:0016801 Hydrolase activity, acting on ether bonds MF 2 2 0.006 O
GO:0005215 Transporter activity MF 58 10 0.008 O
GO:0008324 Cation transporter activity MF 26 6 0.010 O
GO:0016491 Oxidoreductase activity MF 52 9 0.012 O
GO:0015075 Ion transporter activity MF 31 6 0.024 O
GO:0004004 ATP-dependent RNA helicase activity MF 4 2 0.031 O
GO:0008186 RNA-dependent ATPase activity MF 4 2 0.031 O
GO:0015171 Amino acid transporter activity MF 5 2 0.049 O
GO:0016740 Transferase activity MF 80 1 0.021 U
Cluster HHL
GO:0008150 Biological process BP 582 50
GO:0003674 Molecular function MF 617 52
GO:0016070 RNA metabolism BP 78 17 0.000 O
GO:0006396 RNA processing BP 66 15 0.000 O
GO:0006397 mRNA processing BP 42 10 0.002 O
GO:0043283 Biopolymer metabolism BP 192 26 0.004 O
GO:0008380 RNA splicing BP 41 9 0.005 O
GO:0006112 Energy reserve metabolism BP 2 2 0.007 O
GO:0000398 Nuclear mRNA splicing, via spliceosome BP 21 5 0.027 O
GO:0003723 RNA binding MF 70 16 0.000 O
GO:0004888 Transmembrane receptor activity MF 5 3 0.005 O
GO:0030515 snoRNA binding MF 3 2 0.020 O
GO:0031420 Alkali metal ion binding MF 8 3 0.023 O
Cluster LHL
GO:0008150 Biological process BP 582 54
Continued
by 10.220.33.4 on December 6, 2016
http://physiolgenomics.physiology.org/
Table 4. —Continued
GO Name GO Tree All Genes No. in Cluster P Value Over or Under
GO:0003674 Molecular function MF 617 58
GO:0031570 DNA integrity checkpoint BP 3 3 0.001 O
GO:0006139 Nucleobase, nucleoside, nucleotide, and nucleic acid metabolism BP 211 29 0.007 O
GO:0000398 Nuclear mRNA splicing, via spliceosome BP 21 6 0.009 O
GO:0043170 Macromolecule metabolism BP 299 36 0.022 O
GO:0000080 G1phase of mitotic cell cycle BP 3 2 0.024 O
GO:0043069 Negative regulation of programmed cell death BP 13 4 0.025 O
GO:0016765 Transferase activity, transferring alkyl or aryl (other than methyl) groups
MF 3 2 0.025 O
GO:0006259 DNA metabolism BP 48 9 0.032 O
GO:0000087 M phase of mitotic cell cycle BP 14 4 0.033 O
GO:0000278 Mitotic cell cycle BP 15 4 0.042 O
Cluster HLM
GO:0008150 Biological process BP 582 39
GO:0003674 Molecular function MF 617 42
GO:0006508 Proteolysis BP 27 6 0.006 O
GO:0006512 Ubiquitin cycle BP 36 7 0.007 O
GO:0044257 Cellular protein catabolism BP 13 4 0.008 O
GO:0016790 Thiolester hydrolase activity MF 4 3 0.001 O
GO:0004221 Ubiquitin thiolesterase activity MF 4 3 0.001 O
GO:0004843 Ubiquitin-specific protease activity MF 4 3 0.001 O
GO:0043169 Cation binding MF 107 15 0.003 O
GO:0046872 Metal ion binding MF 123 16 0.004 O
GO:0008233 Peptidase activity MF 22 5 0.013 O
GO:0005509 Calcium ion binding MF 17 4 0.023 O
GO:0008270 Zinc ion binding MF 75 10 0.026 O
Cluster LHH
GO:0008150 Biological process BP 582 66
GO:0003674 Molecular function MF 617 70
GO:0044249 Cellular biosynthesis BP 102 23 0.000 O
GO:0006412 Protein biosynthesis BP 72 21 0.000 O
GO:0044267 Cellular protein metabolism BP 178 35 0.000 O
GO:0006414 Translational elongation BP 4 3 0.005 O
GO:0051297 Centrosome organization and biogenesis BP 2 2 0.013 O
GO:0043488 Regulation of mRNA stability BP 2 2 0.013 O
GO:0051704 Interaction between organisms BP 2 2 0.013 O
GO:0044237 Cellular metabolism BP 422 56 0.019 O
GO:0006508 Proteolysis BP 27 7 0.024 O
GO:0042254 Ribosome biogenesis and assembly BP 17 5 0.034 O
GO:0006367 Transcription initiation from RNA polymerase II promoter BP 3 2 0.035 O
GO:0005198 Structural molecule activity MF 34 12 0.000 O
GO:0003735 Structural constituent of ribosome MF 22 12 0.000 O
GO:0003746 Translation elongation factor activity MF 3 3 0.001 O
GO:0008233 Peptidase activity MF 22 7 0.008 O
GO:0008135 Translation factor activity, nucleic acid binding MF 25 7 0.016 O
GO:0004298 Threonine endopeptidase activity MF 6 3 0.022 O
GO:0042802 Identical protein binding MF 16 5 0.026 O
GO:0015450 Protein translocase activity MF 3 2 0.035 O
GO:0045182 Translation regulator activity MF 29 7 0.036 O
GO:0016874 Ligase activity MF 36 0 0.025 U
GO:0016301 Kinase activity MF 32 0 0.040 U
Cluster MLH
GO:0008150 Biological process BP 582 36
GO:0003674 Molecular function MF 617 38
GO:0009607 Response to biotic stimulus BP 14 4 0.008 O
GO:0030705 Cytoskeleton-dependent intracellular transport BP 8 3 0.010 O
GO:0009117 Nucleotide metabolism BP 16 4 0.013 O
GO:0015986 ATP synthesis coupled proton transport BP 10 3 0.019 O
GO:0015985 Energy-coupled proton transport, down electrochemical gradient BP 10 3 0.019 O
GO:0006754 ATP biosynthesis BP 11 3 0.025 O
GO:0046034 ATP metabolism BP 11 3 0.025 O
GO:0007010 Cytoskeleton organization and biogenesis BP 20 4 0.029 O
GO:0009142 Nucleoside triphosphate biosynthesis BP 12 3 0.033 O
GO:0009201 Ribonucleoside triphosphate biosynthesis BP 12 3 0.033 O
GO:0006119 Oxidative phosphorylation BP 14 3 0.049 O
Continued
by 10.220.33.4 on December 6, 2016
http://physiolgenomics.physiology.org/
While 65% of the genes present on the array were identified, this proportion was significantly lower for genes belonging to cluster LHL (57.6%; P⬍ 0.05, 2-test) but significantly higher
for cluster LHH (76.8%; P ⬍ 0.001, 2-test). The high
pro-portion of still unknown genes in cluster LHL confirmed the interest in establishing dedicated arrays to analyze specific stages of embryo development. It also suggested that a high proportion of genes transiently expressed at EGA were in-volved in embryo-specific and still not precisely known events. This proportion was higher among genes transiently expressed at EGA (cluster LHL) than among those progressively tran-scribed from EGA onward (cluster LHH).
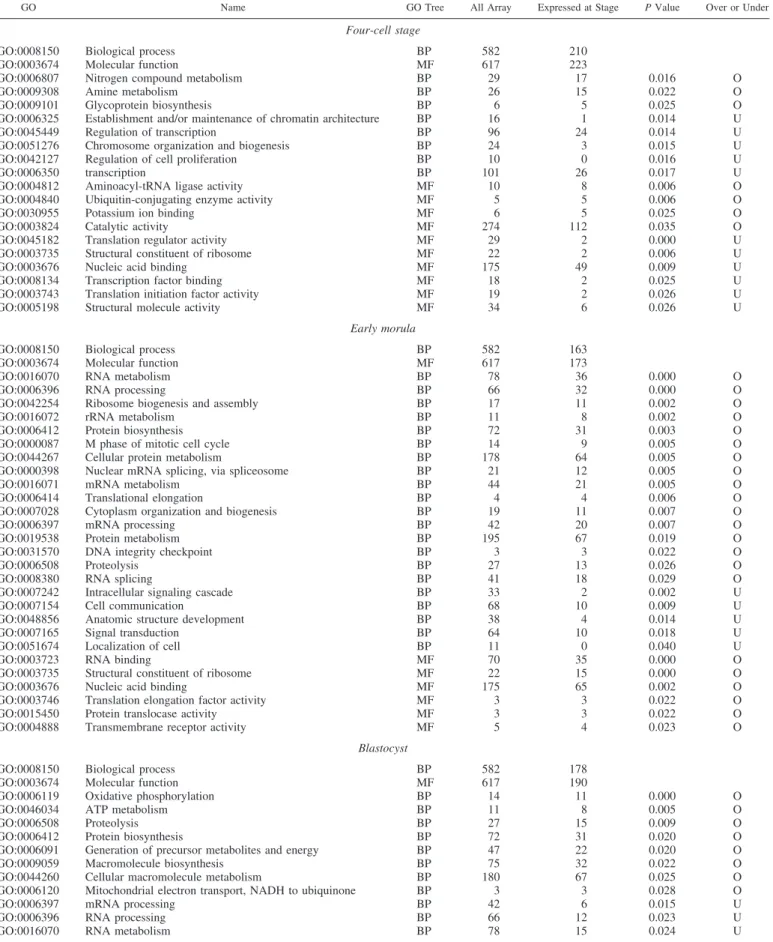
To get a more dynamic view of the functional incidence of transcriptome variations, we then analyzed transcripts overrep-resented at each stage by grouping genes of several clusters according to prevalence of their transcripts at the four-cell, early morula, and blastocyst stage, respectively.
We performed an automated ontological analysis on tran-scripts present in the maternal inheritance at the four-cell stage (transcripts from clusters HLL, HHL, HLM, and MLH). At this stage, overrepresented molecular processes mainly involved amine, glycoprotein, and nitrogen compound metabolisms. “Aminoacyl tRNA ligase activity” remained intensively en-coded by the maternal transcripts (Table 5). In contrast, bio-logical processes concerning “transcription,” “translation,” “regulation of protein synthesis,” and “chromosome or chro-matin organization” were underrepresented, which was con-firmed by the underrepresentation of molecular functions such as “structural constituent of ribosomes,” “translation regulation activity,” “translation factor activity,” and “translation initia-tion factors” on the one hand and “transcripinitia-tion factor binding” on the other hand.
Interestingly, at EGA, analysis of transcripts from clusters HHL, LHL, and LHH revealed an overexpression of molecular processes involved in “RNA metabolism,” including “mRNA and rRNA metabolism” and “RNA processing and splicing.” Biological processes concerning macromolecule biosynthesis including “protein synthesis” were also overrepresented. Be-sides these activities, which were probably necessary to the modification in gene expression program occurring at that stage and which directly reflected the maternal to embryo transition in the control of development, we observed an overrepresentation of biological processes involved in “cell cycle” and “DNA integrity checkpoint.” In contrast, biological processes linked to cell communication, such as “signal trans-duction” and “protein kinase cascades,” were underrepre-sented.
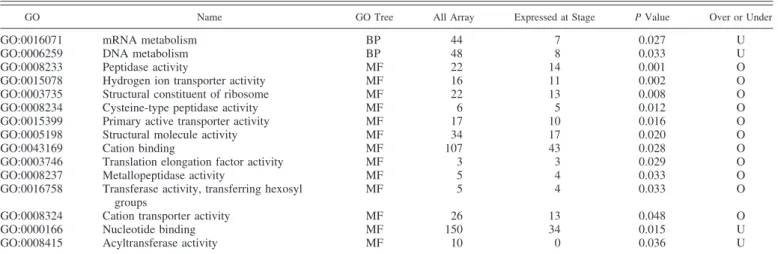
When reaching the blastocyst stage (clusters LLH, HLM, LHH, MLH), the embryo transcriptome still encoded for “mac-romolecule and protein biosynthesis,” but new synthesis activ-ities appeared as overrepresented: these concerned “ATP me-tabolism” and “generation of precursor metabolites and energy”; also, “ion transport activities” appeared to be overrepresented in biological processes from this stage onward. Interestingly, “DNA and RNA metabolism,” which were overrepresented at EGA, were underrepresented in the blastocyst transcriptome. In agreement with these results, the analysis of molecular functions at this stage pointed to a still high “structural con-stituent of ribosome” function, the appearance of “ion bind-ing,” “cation transporter,” and “hydrolase and NADH dehy-drogenase” activities, but also of a “peptidase” activity that was not represented until this stage and might be involved in the erasure of the maternally encoded program of gene expres-sion.
We completed our functional analysis by comparing sets of genes according to the maternal or embryonic origin of their transcripts during the four-cell to blastocyst period of devel-opment. Therefore, the seven clusters of genes were regrouped in two sets. The first set gathered genes with maternal expres-sion (set 1⫽ clusters HLL ⫹ HHL ⫹ HLM ⫹ MLH), while the second set regrouped genes with an embryonic expression (set 2⫽ clusters LLH ⫹ LHL ⫹ HLM ⫹ LHH ⫹ MLH). Both sets of genes were then pair-compared for their GO annota-tions. This analysis contrasted “transferase activities” includ-ing “kinase and phosphotransferase” molecular functions mainly encoded by maternal transcripts with “structural mol-ecule,” including “structural constituents of ribosome,” “trans-lation regulator,” and “trans“trans-lation factor, nucleic acid binding” functions assumed by embryonic transcripts (Table 6).
In the rabbit species, transcriptional activation of the embry-onic genome is very progressive and is only required to drive further development from the 8- to 16-cell stage onward. Both the total amount of RNA and the amount of messenger RNA are stable over the first cleavages (12, 23). Also, the protein content remains quantitatively stable until the morula stage (26), and the pattern of synthesis is only very progressively modified from the 2-cell to the 16-cell stage, with a large proportion of them still being translated from maternal tran-scripts (33). Both this apparent stability of the maternal legacy and the moderate epigenetic modifications of the embryonic genome at EGA (1, 31) raised the question of the control of gene expression over EGA and first differentiations in this species. To analyze this question, we focused on transcripts Table 4. —Continued
GO Name GO Tree All Genes No. in Cluster P Value Over or Under
GO:0043283 Biopolymer metabolism BP 192 6 0.042 U
GO:0004576 Oligosaccharyl transferase activity MF 3 2 0.011 O
GO:0046961 Hydrogen-transporting ATPase activity, rotational mechanism MF 10 3 0.019 O
GO:0019829 Cation-transporting ATPase activity MF 11 3 0.025 O
GO:0003774 Motor activity MF 12 3 0.032 O
GO:0016758 Transferase activity, transferring hexosyl groups MF 5 2 0.033 O
GO:0003676 Nucleic acid binding MF 175 2 0.001 U
GO:0003723 RNA binding MF 70 0 0.015 U
Data are Gene Ontology (GO) categories from 2 branches of the GO tree (BP, biological process; MF, molecular function) overrepresented (O) or underrepresented (U) in each cluster. Lines without P value represent the total number of GO categories in a GO tree branch for the considered cluster.
by 10.220.33.4 on December 6, 2016
http://physiolgenomics.physiology.org/
Table 5. Functional analysis of genes at each embryo stage
GO Name GO Tree All Array Expressed at Stage P Value Over or Under
Four-cell stage
GO:0008150 Biological process BP 582 210
GO:0003674 Molecular function MF 617 223
GO:0006807 Nitrogen compound metabolism BP 29 17 0.016 O
GO:0009308 Amine metabolism BP 26 15 0.022 O
GO:0009101 Glycoprotein biosynthesis BP 6 5 0.025 O
GO:0006325 Establishment and/or maintenance of chromatin architecture BP 16 1 0.014 U
GO:0045449 Regulation of transcription BP 96 24 0.014 U
GO:0051276 Chromosome organization and biogenesis BP 24 3 0.015 U
GO:0042127 Regulation of cell proliferation BP 10 0 0.016 U
GO:0006350 transcription BP 101 26 0.017 U
GO:0004812 Aminoacyl-tRNA ligase activity MF 10 8 0.006 O
GO:0004840 Ubiquitin-conjugating enzyme activity MF 5 5 0.006 O
GO:0030955 Potassium ion binding MF 6 5 0.025 O
GO:0003824 Catalytic activity MF 274 112 0.035 O
GO:0045182 Translation regulator activity MF 29 2 0.000 U
GO:0003735 Structural constituent of ribosome MF 22 2 0.006 U
GO:0003676 Nucleic acid binding MF 175 49 0.009 U
GO:0008134 Transcription factor binding MF 18 2 0.025 U
GO:0003743 Translation initiation factor activity MF 19 2 0.026 U
GO:0005198 Structural molecule activity MF 34 6 0.026 U
Early morula
GO:0008150 Biological process BP 582 163
GO:0003674 Molecular function MF 617 173
GO:0016070 RNA metabolism BP 78 36 0.000 O
GO:0006396 RNA processing BP 66 32 0.000 O
GO:0042254 Ribosome biogenesis and assembly BP 17 11 0.002 O
GO:0016072 rRNA metabolism BP 11 8 0.002 O
GO:0006412 Protein biosynthesis BP 72 31 0.003 O
GO:0000087 M phase of mitotic cell cycle BP 14 9 0.005 O
GO:0044267 Cellular protein metabolism BP 178 64 0.005 O
GO:0000398 Nuclear mRNA splicing, via spliceosome BP 21 12 0.005 O
GO:0016071 mRNA metabolism BP 44 21 0.005 O
GO:0006414 Translational elongation BP 4 4 0.006 O
GO:0007028 Cytoplasm organization and biogenesis BP 19 11 0.007 O
GO:0006397 mRNA processing BP 42 20 0.007 O
GO:0019538 Protein metabolism BP 195 67 0.019 O
GO:0031570 DNA integrity checkpoint BP 3 3 0.022 O
GO:0006508 Proteolysis BP 27 13 0.026 O
GO:0008380 RNA splicing BP 41 18 0.029 O
GO:0007242 Intracellular signaling cascade BP 33 2 0.002 U
GO:0007154 Cell communication BP 68 10 0.009 U
GO:0048856 Anatomic structure development BP 38 4 0.014 U
GO:0007165 Signal transduction BP 64 10 0.018 U
GO:0051674 Localization of cell BP 11 0 0.040 U
GO:0003723 RNA binding MF 70 35 0.000 O
GO:0003735 Structural constituent of ribosome MF 22 15 0.000 O
GO:0003676 Nucleic acid binding MF 175 65 0.002 O
GO:0003746 Translation elongation factor activity MF 3 3 0.022 O
GO:0015450 Protein translocase activity MF 3 3 0.022 O
GO:0004888 Transmembrane receptor activity MF 5 4 0.023 O
Blastocyst
GO:0008150 Biological process BP 582 178
GO:0003674 Molecular function MF 617 190
GO:0006119 Oxidative phosphorylation BP 14 11 0.000 O
GO:0046034 ATP metabolism BP 11 8 0.005 O
GO:0006508 Proteolysis BP 27 15 0.009 O
GO:0006412 Protein biosynthesis BP 72 31 0.020 O
GO:0006091 Generation of precursor metabolites and energy BP 47 22 0.020 O
GO:0009059 Macromolecule biosynthesis BP 75 32 0.022 O
GO:0044260 Cellular macromolecule metabolism BP 180 67 0.025 O
GO:0006120 Mitochondrial electron transport, NADH to ubiquinone BP 3 3 0.028 O
GO:0006397 mRNA processing BP 42 6 0.015 U
GO:0006396 RNA processing BP 66 12 0.023 U
GO:0016070 RNA metabolism BP 78 15 0.024 U
Continued
by 10.220.33.4 on December 6, 2016
http://physiolgenomics.physiology.org/
expressed at EGA and at blastocyst stages by establishing a dedicated array.
The size of this first-generation array and the fact that only those maternal transcripts stable until the four-cell stage were represented make the functional transition between maternal legacy and early embryonic transcriptome difficult to compare with the data available in the mouse, where results are obtained on larger sets of genes (17, 34, 38), or even in the bovine (25) and the pig (35), where the stages analyzed are quite different
from those involved in our study. However, our data point to the overrepresentation of genes involved in protein synthesis, RNA metabolism, and ribosome biogenesis and assembly among those genes transcribed at EGA, and this appears as a common trait in both mouse and rabbit models (38) despite their different EGA kinetics.
Our results also evidenced a highly dynamic transcriptome over the preimplantation period, and thus confirmed and ex-tended some previous results established from the analyses of Table 5. —Continued
GO Name GO Tree All Array Expressed at Stage P Value Over or Under
GO:0016071 mRNA metabolism BP 44 7 0.027 U
GO:0006259 DNA metabolism BP 48 8 0.033 U
GO:0008233 Peptidase activity MF 22 14 0.001 O
GO:0015078 Hydrogen ion transporter activity MF 16 11 0.002 O
GO:0003735 Structural constituent of ribosome MF 22 13 0.008 O
GO:0008234 Cysteine-type peptidase activity MF 6 5 0.012 O
GO:0015399 Primary active transporter activity MF 17 10 0.016 O
GO:0005198 Structural molecule activity MF 34 17 0.020 O
GO:0043169 Cation binding MF 107 43 0.028 O
GO:0003746 Translation elongation factor activity MF 3 3 0.029 O
GO:0008237 Metallopeptidase activity MF 5 4 0.033 O
GO:0016758 Transferase activity, transferring hexosyl groups
MF 5 4 0.033 O
GO:0008324 Cation transporter activity MF 26 13 0.048 O
GO:0000166 Nucleotide binding MF 150 34 0.015 U
GO:0008415 Acyltransferase activity MF 10 0 0.036 U
Data are GO categories from 2 branches of the GO tree (BP, MF) overrepresented (O) or underrepresented (U) among the genes expressed at each of the 3 embryo stages. Genes were considered expressed at the 4-cell stage if they belong to Hxx- or Mxx-type clusters, at the early morula if they belong to xHx-type clusters, and at the blastocyst stage if they belong to xxH- or xxM-type clusters. Lines without P value represent the total number of GO categories in a GO tree branch in the considered group of clusters.
Table 6. Functional analysis of genes according to their maternal or embryonic status
GO Name GO Tree Set 1 (maternal) Set 2 (embryonic) P Value Overrepresented
GO:0008150 Biological process BP 210 224
GO:0003674 Molecular function MF 222 237
GO:0006412 Translation BP 16 33 0.007 E
GO:0022618 Protein-RNA complex assembly BP 3 11 0.013 E
GO:0022613 Ribonucleoprotein complex biogenesis and assembly BP 6 17 0.013 E
GO:0016043 Cellular component organization and biogenesis BP 37 57 0.014 E
GO:0006417 Regulation of translation BP 2 8 0.016 E
GO:0044249 Cellular biosynthetic process BP 15 26 0.033 E
GO:0006414 Translational elongation BP 0 4 0.044 E
GO:0006119 Oxidative phosphorylation BP 7 14 0.048 E
GO:0006807 Nitrogen compound metabolic process BP 17 7 0.007 M
GO:0006418 tRNA aminoacylation for protein translation BP 8 2 0.011 M
GO:0009308 Amine metabolic process BP 15 7 0.019 M
GO:0006519 Amino acid and derivative metabolic process BP 14 7 0.032 M
GO:0006399 tRNA metabolic process BP 8 3 0.045 M
GO:0007154 Cell communication BP 33 24 0.047 M
GO:0005198 Structural molecule activity MF 6 22 0.000 E
GO:0003735 Structural constituent of ribosome MF 2 15 0.001 E
GO:0008135 Translation factor activity, nucleic acid binding MF 2 13 0.005 E
GO:0045182 Translation regulator activity MF 2 13 0.005 E
GO:0048037 Cofactor binding MF 1 6 0.026 E
GO:0008237 Metallopeptidase activity MF 1 6 0.026 E
GO:0008565 Protein transporter activity MF 2 7 0.029 E
GO:0008233 Peptidase activity MF 8 16 0.045 E
GO:0016740 Transferase activity MF 33 18 0.005 M
GO:0004812 Aminoacyl-tRNA ligase activity MF 8 2 0.012 M
GO:0016301 Kinase activity MF 14 5 0.013 M
GO:0016773 Phosphotransferase activity, alcohol group as acceptor MF 11 4 0.037 M Data are GO categories from 2 branches of the GO tree (BP, MF) detected as overrepresented in the set of maternally expressed genes (M) or in the set of embryonically expressed genes (E). Genes were considered as maternally expressed if they belong to Hxx- or Mxx-type clusters and as embryonically expressed if they belong to xxH-, xxM-, or xHx-type clusters. Lines without P value represent the total number of GO categories in a GO tree branch.
by 10.220.33.4 on December 6, 2016
http://physiolgenomics.physiology.org/