HAL Id: hal-01381793
https://hal.archives-ouvertes.fr/hal-01381793
Submitted on 30 Oct 2020
HAL is a multi-disciplinary open access
archive for the deposit and dissemination of
sci-entific research documents, whether they are
pub-lished or not. The documents may come from
teaching and research institutions in France or
abroad, or from public or private research centers.
L’archive ouverte pluridisciplinaire HAL, est
destinée au dépôt et à la diffusion de documents
scientifiques de niveau recherche, publiés ou non,
émanant des établissements d’enseignement et de
recherche français ou étrangers, des laboratoires
publics ou privés.
the VAHINE mesocosms experiment in the New
Caledonia lagoon
Ulrike Pfreundt, France van Wambeke, Mathieu Caffin, Sophie Bonnet,
Wolfgang R. Hess
To cite this version:
Ulrike Pfreundt, France van Wambeke, Mathieu Caffin, Sophie Bonnet, Wolfgang R. Hess. Succession
within the prokaryotic communities during the VAHINE mesocosms experiment in the New Caledonia
lagoon. Biogeosciences, European Geosciences Union, 2016, 13 (8), pp.2319-2337.
�10.5194/bg-13-2319-2016�. �hal-01381793�
doi:10.5194/bg-13-2319-2016
© Author(s) 2016. CC Attribution 3.0 License.
Succession within the prokaryotic communities during the VAHINE
mesocosms experiment in the New Caledonia lagoon
Ulrike Pfreundt1, France Van Wambeke2, Mathieu Caffin2, Sophie Bonnet2,3, and Wolfgang R. Hess1 1Faculty of Biology, University of Freiburg, Schaenzlestr. 1, 79104 Freiburg, Germany
2Aix Marseille Université, CNRS/INSU, Université de Toulon, IRD, Mediterranean Institute of Oceanography
(MIO) UM110, 13288 Marseille, France
3Institute de Recherche pour la Développement (IRD) Nouméa, 101 Promenade R. Laroque, BPA5, 98848,
Nouméa CEDEX, New Caledonia
Correspondence to: Wolfgang R. Hess (wolfgang.hess@biologie.uni-freiburg.de)
Received: 4 December 2015 – Published in Biogeosciences Discuss.: 18 December 2015 Revised: 31 March 2016 – Accepted: 11 April 2016 – Published: 21 April 2016
Abstract. N2fixation fuels ∼ 50 % of new primary
produc-tion in the oligotrophic South Pacific Ocean. The VAHINE experiment has been designed to track the fate of diazotroph-derived nitrogen (DDN) and carbon within a coastal lagoon ecosystem in a comprehensive way. For this, large-volume (∼ 50 m3) mesocosms were deployed in the New Caledo-nian lagoon and were intentionally fertilized with dissolved inorganic phosphorus (DIP) to stimulate N2 fixation. This
study examined the temporal dynamics of the prokaryotic community together with the evolution of biogeochemical parameters for 23 consecutive days in one of these meso-cosms (M1) and in the Nouméa lagoon using MiSeq 16S rRNA gene sequencing and flow cytometry. Combining these methods allowed for inference of absolute cell numbers from 16S data. We observed clear successions within M1, some of which were not mirrored in the lagoon. The dominat-ing classes in M1 were Alpha- and Gammaproteobacteria, Cyanobacteria, eukaryotic microalgae, Marine Group II Eur-yarchaeota, Flavobacteriia, and Acidimicrobia. Enclosure led to significant changes in the M1 microbial community, prob-ably initiated by the early decay of Synechococcus and di-atoms. However, we did not detect a pronounced bottle ef-fect with a copiotroph-dominated community. The fertiliza-tion with ∼ 0.8 µM DIP on day 4 did not have directly ob-servable effects on the overall community within M1, as the data samples obtained from before and 4 days after fertil-ization clustered together, but likely influenced the develop-ment of individual populations later on, like Defluviicoccus-related bacteria and UCYN-C-type diazotrophic
cyanobac-teria (Cyanothece). Growth of UCYN-C led to among the highest N2-fixation rates ever measured in this region and
enhanced growth of nearly all abundant heterotrophic groups in M1. We further show that different Rhodobacteraceae were the most efficient heterotrophs in the investigated sys-tem and we observed niche partitioning within the SAR86 clade. Whereas the location in- or outside the mesocosm had a significant effect on community composition, the tempo-ral effect was significantly stronger and similar in both loca-tions, suggesting that overarching abiotic factors were more influential than the enclosure. While temporal community changes were evident, prokaryotic diversity (Shannon index) only declined slightly from ∼ 6.5 to 5.7 or 6.05 in the lagoon and M1, respectively, throughout the experiment, highlight-ing the importance of multiple and varyhighlight-ing sources of organic matter maintaining competition.
1 Introduction
The Southwest Pacific Ocean is recognized as an area with one of the highest dinitrogen (N2)-fixation rates in the global
ocean (Garcia et al., 2007; Luo et al., 2012). In this re-gion, plankton taxa capable of N2fixation (N2-fixing or
di-azotrophic organisms) are very diverse (Moisander et al., 2010) and fuel up to 60 % of primary production (Bon-net et al., 2015a), yet their interactions with surrounding planktonic communities are rarely studied. Within this vast oceanic region, most of the studies investigating coupling
between phytoplankton and heterotrophic bacteria have tar-geted the Nouméa lagoon in New Caledonia. Phytoplank-ton and heterotrophic bacterial production (BP) shows sea-sonal patterns, with maxima in December and January and an annual BP representing 21 to 34 % of primary production (Torréton et al., 2010). High N2-fixation rates are a
recur-rent feature in the Nouméa lagoon (Biegala and Raimbault, 2008; Garcia et al., 2007), and diazotroph-derived N (DDN) was shown to be significantly channeled through the het-erotrophic bacterial compartment in this environment (Berth-elot et al., 2015; Bonnet et al., 2015b). However, no informa-tion is available on the potential effects of this N2fixation on
bacterial successions.
The production and quality of varying sources of organic matter is expected to vary as blooms of diazotrophic organ-isms are transient events. Such variation is expected to in-fluence not only biogeochemical fluxes but also the succes-sion of different heterotrophic bacteria, according to their metabolic capabilities. Indeed, the importance of quality and quantity of dissolved organic matter (DOM) in struc-turing bacterioplankton communities has been well estab-lished (Alonso-Sáez and Gasol, 2007; Beier and de Al-buquerque, 2015), by either comparing the continuum of trophic conditions in situ (West et al., 2008) or following phytoplankton blooms under natural (Teeling et al., 2012) or experimental (Lebaron et al., 2001) conditions. Since the 1970s, heterotrophic bacterial succession during phyto-plankton blooms has been observed with culture-dependent techniques (Fukami et al., 1981a) and linked to the possi-ble origin of DOM sources (release, lysis, sloppy feeding, degradation of phytoplankton detritus), DOM size (low- or high-molecular weight molecules), or quality (Biddanda and Pomeroy, 1988; Murray et al., 2007; Nagata, 2000; Riemann et al., 2000).
The VAHINE experiment (Bonnet et al., 2016) provided a unique opportunity to study the fate of DDN in the ma-rine planktonic food web and the interactions between phy-toplankton and heterotrophic bacteria by simultaneously ad-dressing biogeochemical parameters, stocks, and fluxes, as well as biodiversity based on 16S rRNA gene sequencing and flow cytometry cell counts. Taking into account different 16S copy numbers, we used the absolute cytometry cell counts for
Synechococcus and Prochlorococcus to calculate a
sample-specific cells count to 16S ratio and infer cells mL−1for all operational taxonomic units (OTUs) obtained from MiSeq sequencing.
After fertilization with dissolved inorganic phosphorus (DIP: ∼ 0.8 µmol L−1) on the evening of day 4, to
allevi-ate potential limitation often observed in the region (Moutin et al., 2008), two periods of about 10 days each (P1 and P2, see description in Sect. 2.1) were identified in terms of diazotroph succession. During the first period, diatom-diazotroph associations were dominating (Turk-Kubo et al., 2015) the diazotrophic community with N2-fixation rates
de-creasing from 17.9 ± 2.5 to 10.1 ± 1.3 nmol N L−1d−1
(Bon-net et al., 2015b). Unicellular N2-fixing cyanobacteria of the
UCYN-C type (Cyanothece-like) dominated the diazotroph community in the mesocosms during the second period, but they did not appear in Nouméa lagoon waters (Turk-Kubo et al., 2015). N2-fixation rates increased during days 15–23 and
reached > 60 nmol N L−1d−1, which is among the highest rates measured in marine waters (Bonnet et al., 2015b; Luo et al., 2012). These two periods corresponded to character-istic successions in phytoplankton taxa, chlorophyll stocks, primary production and BP, discussed in detail in compan-ion studies in this issue (Berthelot et al., 2015; Leblanc et al., 2016; Van Wambeke et al., 2015).
In this research paper, we focus on prokaryotic commu-nity dynamics and possible parallels between or successions among different groups of phytoplankton, heterotrophic bac-teria, and N2-fixing organisms.
2 Material and methods
2.1 Mesocosm description, sampling strategy, and
stocks/fluxes analyses
Three large mesocosms (∼ 50 m3) were deployed in the nutrient-poor waters of the Nouméa lagoon close to the Boulari passage (22◦29.073 S–166◦26.205 E), 28 km off the coast from 13 January to 4 February 2013. Details of the lo-cation, deployment, and sampling strategy are described in Bonnet et al. (2016). The three triplicate mesocosms were fertilized with ∼ 0.8 µM KH2PO4between day 4 and day 5
of the experiment to promote a diazotroph bloom. Samples were collected every morning at 07:00 over a period of 23 days from three selected depths (1, 6, 12 m) in each meso-cosm (M1, M2, and M3) and in surrounding waters (hereafter referred to as Nouméa lagoon waters). For sequencing of the microbial community and metatranscriptomics, only one of the mesocosms, together with the Nouméa lagoon as a con-trol, was sampled. Further details regarding the sampling are given separately (Pfreundt et al., 2016; Van Wambeke et al., 2015).
Subsampling and analysis procedures for stocks and fluxes are not given in detail here as they were mainly used for statistical analyses (see Sect. 2.3), but they are described in full in companion papers from this issue: inorganic nutri-ents and chlorophyll a (Chl) concentrations, DIP turnover time, N2-fixation rates, and primary production (PP) were
analyzed according to procedures detailed in Berthelot et al. (2015). Synechococcus and Prochlorococcus cell num-bers were counted by flow cytometry (Leblanc et al., 2016). Heterotrophic bacterioplankton abundances were also deter-mined by flow cytometry and corresponded to the sum of cells with high and low nucleic acid content, discarding au-totrophic cell counts (Van Wambeke et al., 2015). BP was determined by the3H leucine technique, and alkaline phos-phatase activity (APA) was determined on the total
frac-tion (i.e., unfiltered samples) using MUF-P substrate (Van Wambeke et al., 2015). Three periods of the experiment were defined. P0 was defined as days 2–4, before DIP fertiliza-tion of the mesocosms. P1 (days 5–14) was characterized by DIP availability and correspondingly lower APA inside the mesocosms (Van Wambeke et al., 2015). P2 (days 15– 23) was characterized by increasing Chl a concentrations, N2-fixation rates, PP, and BP inside the mesocosms as well
as in the Nouméa lagoon, albeit to a lower extent. Further, APA increased steeply, corresponding to DIP becoming lim-iting in the mesocosms during P2 (Berthelot et al., 2015; Van Wambeke et al., 2015).
2.2 16S rRNA gene amplicon sequencing and OTU
clustering
DNA was extracted from seawater samples collected every 2 days at 1 and 12 m depth in M1 and in Nouméa lagoon waters. A volume of 10 L was pre-filtered through a 1 mm mesh to keep out large eukaryotes and filtered on 0.45 µm pore size, 47 mm diameter polyethersulfone filters (Pall Su-por), immersed in RNA resuspension buffer (10 mM NaAc pH 5.2, 200 mM D(+)-sucrose, 100 mM NaCl, 5 mM EDTA) and snap frozen in liquid N2. Tubes with filters were
vor-texed, then agitated in a Precellys bead beater (Peqlab, Er-langen, Germany) 2 × (2 × 15 s) at 6500 rpm after adding 0.25 mL glass beads (0.10–0.25 mm, Retsch, Frimley, UK) and 1 mL PGTX (39.6 g phenol, 6.9 mL glycerol, 0.1 g 8-hydroxyquinoline, 0.58 g EDTA, 0.8 g NaAc, 9.5 g guanidine thiocyanate, 4.6 g guanidine hydrochloride, H2O to 100 mL;
Pinto et al., 2009). RNA and DNA were extracted simulta-neously by adding 0.7 mL chloroform, shaking vigorously, incubating at 24◦C for 10 min, and subsequent phase
sepa-rating by centrifugation. RNA and DNA were retained in the aqueous phase, precipitated together, and stored at −80◦C for further use for metatranscriptomics analysis (Pfreundt et al., 2016) and 16S tag sequencing. For the latter, ∼ 100 ng of RNase-treated total DNA was sent to a commercial provider (LGC Genomics, Berlin, Germany) for amplicon sequenc-ing with primer pair S-D-Bact-0341-b-S-17/S-D-Bact-0785-a-A-21 (Klindworth et al., 2013), which targets bacteria and archaea. Briefly, 16S hypervariable regions 3–4 were ampli-fied and the amplicons sequenced on a MiSeq (Illumina) se-quencer, generating between 31 466 and 749 629 paired-end reads (2 × 300) per sample.
All bioinformatic steps were done using the USEARCH package and following the UPARSE pipeline (Edgar, 2013) unless mentioned otherwise. Briefly, lowest quality tails were truncated from all reads and the paired reads merged us-ing the -fastq_mergepairs command and yieldus-ing between 25 221 and 604 457 reads of average length > 400 nt per sam-ple. Merged reads were then quality filtered, reads shorter than 350 nt discarded, and converted to FASTA. All FASTA files were concatenated for OTU clustering, with the follow-ing steps: dereplication at 100 % identity and keepfollow-ing
infor-mation on the weight of each unique sequence, sorting of unique sequences by decreasing weight and discarding of singletons (weight = 1), and clustering into OTUs with the -cluster_otus command using a maximum dissimilarity of 2 %. The last steps includes chimera filtering (Edgar, 2013). Finally, the merged reads from the different samples were mapped back onto the generated OTUs using VSEARCH v1.1.3 (Rognes et al., 2015) with at least 98 % identity to cre-ate the final OTU table. For taxonomic classification of the OTUs, they were submitted to https://www.arb-silva.de/ngs/ and classified using the SILVA SSU taxonomy and database release SSU 119.1 (Quast et al., 2013). Cyanobacterial OTUs that SILVA had only classified to family level were manually curated by BLASTN searches of these OTUs against NCBI’s nucleotide collection. If a hit with > 95 % sequence identity was found, the genus of this classification was added to the OTU table. For all further use, relative OTU abundances in each sample were calculated.
2.2.1 Inference of absolute cell numbers from 16S data and flow cytometry
Absolute cell numbers were inferred from these relative OTU abundances in three steps. First, raw read counts per OTU were normalized to equal 16S copy numbers (“16S-norm reads”) using a manually curated table of 16S copies per genome for all OTUs (Supplement). For OTUs with no avail-able genome, an average copy number of all genomes from marine representatives of the next higher phylogenetic clade was used (for the detailed procedure see Supplement). Sec-ond, the cumulated raw reads for Synechococcus (Syn) and
Prochlorococcus (Pro) were divided by the respective sum of Synechococcus and Prochlorococcus cytometric cell counts
for each sample, producing a sample-specific ratio (16S-norm reads / cells mL−1). We used Syn and Pro, because flow cytometry is well established for them and we could ex-pect them to be reasonably precise. This ratio was then used to calculate cells mL−1 for all OTUs by dividing their 16S-norm reads in each sample by the sample-specific ratio. We are aware that missing genomic information may lead to er-rors in this calculation. OTUs for which no 16S copy number could be estimated were set to 1 copy/genome.
2.2.2 Calculation of diversity measures.
The Shannon and Simpson indices as measures of diversity were calculated separately for M1 and Nouméa lagoon wa-ters using the diversity function in the R package vegan (Ok-sanen et al., 2015).
2.3 Multivariate statistics of 16S-abundance
community data, samples, and environmental data
Statistical tools were all used with relative 16S abundance data. A canonical correspondence analysis (CCA; XLSTATS Excel software) was used to test for significant effects of
bio-geochemical parameters on variations in the bacterial 16S-derived community structure. These parameters were PP, BP, Chl, APA, DIP, N2-fixation rates, particulate organic
car-bon concentrations (POC), and temperature (T ). CCA gen-erates ordination axes which are linear combinations of the environmental variables that best explain microbial diversity composition data (Braak, 1986). The variables were the log-transformed biogeochemical stocks and fluxes, the objects were the 34 dominating OTUs in terms of abundance (ex-pressed in relative OTU abundance), and the sites were sam-pling time and origin of the samples.
Non-metric multidimensional scaling (NMDS) was used to find the best display of differences in 16S-derived commu-nity structures. The full OTU table containing relative abun-dances of each OTU per sample, with samples as rows and species as columns, was used for unconstrained ordination with the R package vegan (Oksanen et al., 2015). Addition-ally, the same procedure was run with the subset tables con-taining only “heterotroph” OTUs (i.e., all that are not classi-fied as Cyanobacteria or chloroplasts) or only “autotroph” OTUs (i.e., all classified as chloroplasts or Cyanobacteria without Melainabacteria). First, the abundances were stan-dardized using Wisconsin double standardization, which di-vides abundances by the species maximum and then stan-dardizes samples to equal totals. This converts abundances per species into relative values and therefore reduces the weight of dominant species and increases the weight of rare species. Then, Bray–Curtis distance matrices were com-puted and an NMDS ordination calculated using metaMDS. MetaMDS did not use any further transformations or stan-dardizations. Assuming that samples of days 2–8, days 10– 16, and days 18–21 cluster together, ellipses were drawn us-ing the standard error for each cluster in the ordination plot with a confidence limit of 0.95. Like this, we could consider clusters with non-overlapping ellipses as significantly differ-ent from each other at a significance level α = 0.05. Permuta-tional multivariate analysis of variance (PERMANOVA) was conducted using the adonis function in the R package vegan on the Bray–Curtis distance matrices described above. We tested the dependence of sample distances on the factors lo-cation (M1 or lagoon waters), depth (1 or 12 m), and time (separation of samples into three phases: days 2–8, 10–16, and 18–21).
To test significance of higher Cyanothece (UCYN-C) 16S abundances in M1 during P2, we defined two groups, days 2– 14 (P0/P1) and days 16–21 (P2), both in M1 and the lagoon, leading to four groups. We applied ANOVA and Tukey’s honestly significant difference (HSD) test to see whether the means of these groups were significantly different. We found that P2 in M1 was significantly different from the other three groups (Tukey’s HSD p values 0.00002, 0.00009, 0.00003) and that P2 in the lagoon was not significantly different from P0/P1.
Pearson and Spearman rank correlations were performed in R using the rcorr function, which also calculates the
sig-nificance of the derived correlation coefficients. A coefficient was defined as significant if p ≤ 0.05.
3 Results
3.1 Biogeochemical context
Here, we present data on the prokaryotic community in M1 and the Nouméa lagoon from depths of 1 and 12 m, which was close to the bottom of the mesocosm. As a foundation for understanding and discussing these data, selected biogeo-chemical parameters are shown in Fig. 1 for the correspond-ing samplcorrespond-ing locations. On the evencorrespond-ing of day 4, M1 was fertilized with ∼ 0.8 µM DIP, leading to lower APA than in the lagoon until day 19, when APA in M1 increased steeply (Fig. 1c, d) and DIP turnover times dropped below initial lev-els (Van Wambeke et al., 2015). Of the three mesocosms, the here investigated M1 was the one with the lowest increase of Chl a during P2, still reaching higher levels than in Nouméa lagoon waters, whereas PP in M1 did not exceed the values measured in the lagoon (Fig. 1a, b). BP exhibited two promi-nent peaks in M1 with a 4-fold and 2-fold increase, on day 4 and on day 21, and was otherwise close to values measured for Nouméa lagoon waters, only slightly exceeding them on most days after day 11 (Fig. 1e).
3.2 Bacterial community based on 16S tag MiSeq
sequencing
3.2.1 An overview
We identified a total of 3600 OTUs belonging to bacteria, archaea, and chloroplasts using 16S rRNA gene sequencing data from all samples combined (17 samples from M1, 20 samples from the Nouméa lagoon; see Supplement). On this basis, Shannon and Simpson indices as measures for over-all diversity were calculated. With values between 5.6 and 7 (Shannon) at both investigated depths over the 23-day ex-periment, diversity was relatively high. Values above 5 have been reported for the edge of the South Pacific gyre (Yin et al., 2013), but they are based on clone libraries, which might underestimate diversity. Over the course of the experiment we observed a slight decrease in diversity both in M1 and in the lagoon (Supplement Fig. S1).
Throughout results and discussion, we will use absolute abundances inferred from 16S sequencing data and flow cy-tometry counts for Synechococcus and Prochlorococcus (see methods Sect. 2.2 and Supplement). The temporal evolu-tion of relative (16S) and absolute (flow cytometry)
Syne-chococcus abundances in M1 diverged substantially after
day 4 (compare Figs. S4f and 2a). As Synechococcus and
Prochlorococcus together constituted up to 30 % of all 16S
reads, changes in absolute cell counts for these groups can highly influence the temporal evolution of relative 16S data. To elude possible ambiguous interpretation of these data,
Days after the deployment of the mesocosms
DIP fertilization
(a)
(d)
(b)
Days after the deployment of the mesocosms
0.0 0.5 1.0 1.5 2.0 2.5 PP (µmol C L -1 d -1) 5 10 15 20 25 0.0 0.1 0.2 0.3 0.4 0.5 0.6 0.7 0.8 Ch l a (µg L -1) 5 10 15 20 25 0 2 4 6 8 10 12 14 16 18 20 5 10 15 20 25 AP A (nmol L -1 h -1) 0 100 200 300 400 500 600 700 800 900 BP (ng C L -1 h -1) 5 10 15 20 25 DIP fertilization
(e)
DI P ( µM) 0.0 0.1 0.2 0.3 0.4 0.5 0.6 0.7 0.8 0.9 5 10 15 20 25 0 10 20 30 40 50 60 70 80 N2 fixation rates (nM d -1) 5 10 15 20 25(c)
(f)
M1 12 m M1 1 m Nouméa lagoon 1 m Nouméa lagoon 12 mFigure 1. Evolution of selected parameters in mesocosm M1 and the Nouméa lagoon at depths of 1 and 12 m. (a) Primary production (PP), (b) chlorophyll a (Chl a) concentration, (c) dissolved inorganic phosphorous (DIP), (d) alkaline phosphatase activity (APA), (e) heterotrophic
bacterial production (BP, measured by 3H-leucine assimilation), and (f) N2-fixation rates as measured by15N incorporation in M1 and the Nouméa lagoon.
we used the combined Synechococcus and
Prochlorococ-cus cytometric counts to calculate a “16S / cells mL−1”
ra-tio for each sample (see Sect. 2.2). This rara-tio was then used to calculate absolute cell numbers from relative 16S abun-dance in M1 for all other groups investigated here (Figs. 3, 4). Different 16S copy numbers per genome for different OTUs/phylogenetic groups were taken into account (Supple-ment). We hope that this combinatorial approach using 16S sequencing, flow cytometry, and 16S copies/genome may serve as a blueprint for future 16S-based studies. In the fol-lowing, the term “16S community” will be used for the total inferred cell count per sample.
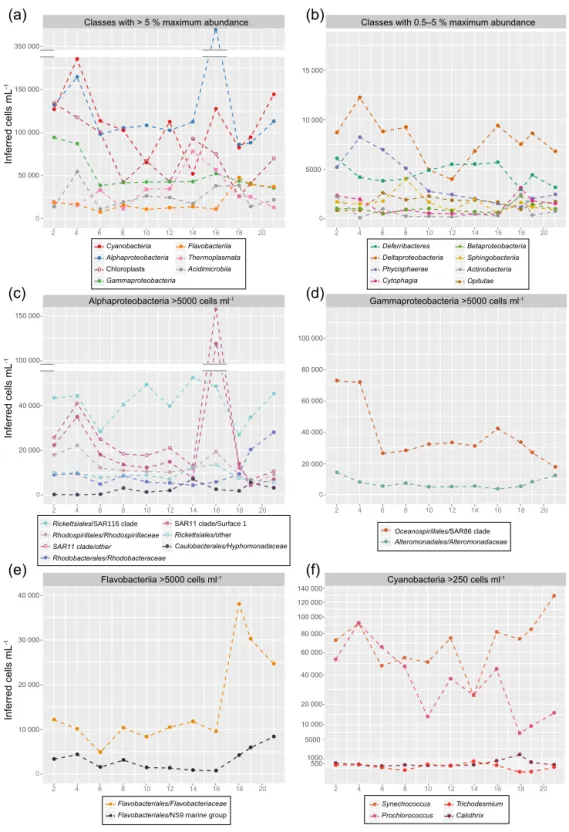
The dominating classes in M1 were Alpha- and Gammaproteobacteria, Cyanobacteria, chloroplasts, Marine Group II (MGII) Euryarchaeota (Thermoplasmata), Acidimi-crobia, and Flavobacteriia (Fig. 3a). Of these, Alpha- and Gammaproteobacteria exhibited clearly different dynam-ics between M1 and the lagoon with completely different peaking times, whereas cyanobacteria, chloroplasts, MGII
Euryarchaeota, and Flavobacteriia showed similar trends (Figs. 3, 4, correlations in Fig. S2a). Amongst the classes contributing less than 5 % to the total 16S community, dy-namics were generally different between M1 and the lagoon (Fig. S2b). Inside M1, Deferribacteres (almost entirely the SAR406 clade) and Deltaproteobacteria abundances halved after the DIP fertilization and increased again when DIP con-centrations fell below 0.1 nM on day 12 (Fig. 3c). All other groups increased at similar times, except for Actinobacte-ria, which responded later (Fig. 3b). Except for the increase in Flavobacteriia and Cyanobacteria (predominantly
Syne-chococcus), none of these late-phase increases were observed
in the lagoon (Fig. 4), although several of the less abun-dant classes (Cytophaga, Betaproteobacteria, Actinobacte-ria) more than doubled from day 16 to 18 in the lagoon but decreased just as quickly after that (Fig. 4b).
5 10 15 20 25
Days after the deployment of the mesocosms
5 10 15 20 25
(a)
(c)
(b)
0 20 000 40 000 60 000 80 000 100 000 120 000 140 000 5 10 15 20 25(d)
0 200 000 400 000 600 000 800 000 1 000 000 1 200 000 5 10 15 20 25Days after the deployment of the mesocosms
Cells mL -1 Cells mL -1 DIP fertilization 0 20 000 40 000 60 000 80 000 100 000 120 000 140 000 1 m total heterotrophs 12 m total heterotrophs 1 m Synechococcus 12 m Synechococcus 1 m Prochlorococcus 12 m Prochlorococcus 0 200 000 400 000 600 000 800 000 1 000 000 1 200 000
Mesocosm M1 Nouméa lagoon
Figure 2. Evolution of absolute abundances as counted by flow cytometry at depths of 1 and 12 m of Synechococcus and Prochlorococcus in
M1 (a) and the lagoon (c); evolution of non-photosynthetic bacteria (total heterotrophs) in M1 (b) and the lagoon (d).
3.2.2 Cyanobacteria
Synechococcus sp. (OTU-9) was the dominant OTU
through-out the experiment in M1 and the lagoon, being almost an order of magnitude more abundant than the second ranked OTU at some time points. The steep drop of Synechococcus abundance on day 4 in M1, 2 days after the mesocosm clo-sure, was equally seen in absolute counts by flow cytometry (from ∼ 78 000 to ∼ 44 000 cells mL−1; Fig. 2a) and in the
relative 16S data (Fig. S4f). Please note that the inferred ab-solute abundances shown in Figs. 3f and 4f are not the same as the flow cytometry counts for Syn and Pro. We used the sum of Syn and Pro to infer the sample-specific ratios for the calculation to reduce putative counting biases in one of the two groups (see discussion). Inferred cell counts for
Syne-chococcus were only 61 000 and 25 000 cells mL−1for these
2 days. At the same time in M1, Prochlorococcus inferred abundance reached a maximum of 37 000 cells mL−1on day 6, corresponding to ∼ 16 000 cells mL−1 counted with flow cytometry (Figs. 2a and 3f). Variations in Synechococcus abundance correlated with changes in Chl concentrations, ex-cept for days 2–5 with high Synechococcus cell counts but low Chl concentrations (Figs. 1b, 2a). N2-fixing
cyanobacte-ria were generally 1 to 2 orders of magnitude less abundant than Prochlorococcus and Synechococcus and were in M1 most prevalent on days 2–4, owing mainly to Trichodesmium with ∼ 5000 cells mL−1 (Fig. 3f). After the DIP fertiliza-tion, Trichodesmium 16S tags dropped quickly by a factor of 10, leaving Calothrix as the most abundant diazotroph un-til day 12. Important to mention, the SILVA database used for 16S classification lists all Richelia intracellularis 16S
se-quences as descendants of the Calothrix node. This is dis-cussed in Sect. 4. Candidatus Atelocyanobacterium thalassa (UCYN-A) constituted the third most abundant diazotroph until day 14. UCYN-A may be seen as a heterotrophic di-azotroph, as it misses photosystem II, cannot fix CO2 into
biomass (Tripp et al., 2010), and lives in symbiosis with uni-cellular algae (Thompson et al., 2012). Between days 14 and 16, Cyanothece (UCYN-C) 16S tags increased by an order of magnitude, exhibiting significantly higher levels in M1 dur-ing P2 than durdur-ing P0/P1 and in the lagoon (ANOVA fol-lowed by Tukey’s HSD test, all p values < 0.0001). UCYN-C was the most abundant diazotroph on day 16 in M1 with
∼400 cells mL−1 (Fig. 3f). Heterotrophic diazotrophs like
Bradyrhizobium and Mesorhizobium were, with a maximum
of 0.00013 % of the community for the former, not present in numbers anywhere close to N2-fixing cyanobacteria
(Sup-plement). In the lagoon samples, the two dominant dia-zotrophs (Trichodesmium and Calothrix/Richelia) were the same but with different dynamics (Fig. 4f). Notably,
Cyan-othece (UCYN-C) OTUs did not increase in abundance in
the lagoon.
3.2.3 Heterotrophic bacteria
As alpha- and gammaproteobacterial 16S abundances showed close to zero correlation between M1 and the la-goon (Fig. S2a), we examined the dynamics within these classes at family level. We observed clear successions within M1 that were not mirrored in the lagoon (Figs. 3c, d and 4c, d). On day 4 (2 days after the mesocosms had been closed around the water column), Rhodobacteraceae increased from < 10 000 to almost 35 000 cells mL−1in M1,
● ● ● ● ● ● ● ● ● ● ● ● ● ● ● ● ● ● ● ● ● ● ● ● ● ● ● ● ● ● ● ● ● ● ● ● ● ● ● ● 2 4 6 8 10 12 14 16 18 20 Inferred cells mL -1 2 4 6 8 10 12 14 16 18 20 ● ● ● Cyanobacteria Alphaproteobacteria Chloroplasts Gammaproteobacteria ● ● Flavobacteriia Thermoplasmata Acidimicrobiia ● ● ● ● Deferribacteres (SAR406) Deltaproteobacteria Phycisphaerae Cytophagia ● ● Sphingobacteriia Actinobacteria 0 2 4 6 8 10 12 14 16 18 20 0 2 4 6 8 10 12 14 16 18 20 0 2 4 6 8 10 12 14 16 18 20 2 4 6 8 10 12 14 16 18 20 ● ● Flavobacteriales/Flavobacteriaceae Flavobacteriales/NS9 marine group
● ● ● Synechococcus Prochlorococcus Calothrix ● ● Trichodesmium
Atelocyanobacterium thalassa (UCYN-A) Classes with > 5 % maximum abundance Classes with 0.5–5 % maximum abundance
Alphaproteobacteria >5000 cells ml-1
Flavobacteriia >5000 cells ml-1 Cyanobacteria >250 cells ml-1 ●SAR11 clade/Surface 1
Rickettsiales/other
● ●
●Rhodobacterales/ RhodobacteraceaeRhodospirillales/Rhodospirillaceae
Rickettsiales/SAR116 clade SAR11 clade/other
●
● Alteromonadales/Alteromonadaceae Oceanospirillales/SAR86 clade
Days after the deployment of the mesocosms
(a) (b) (c) (d) (e) (f) 50 000 100 000 150 000 0 200 000 5000 10 000 15 000 ● Opitutae Inferred cells mL -1 0 20 000 40 000 60 000 80 000 20 000 40 000 60 000 80 000 100 000 Inferred cells mL -1 10 000 20 000 30 000 40 000 500 1000 5000 10 000 20 000 40 000 60 000 80 000 100 000 120 000 140 000 ● ● ● ● ● ● ● ● ● ● ● ● ● ● ● ● ● ● ● ● ● ● ● ● ● ● ● ● ● ● ● ● ● ● ● ● ● ● ● ● ● ● ● ● ● ● ● ● ● ● ● ● ● ● ● ● ● ● ● ● ● ● ● ● ● ● ● ● ● ● ● ● ● ● ● ● ● ● ● ● ● ● ● ● ● ● ● ● ● ● ● ● ● ● ● ● ● ● ● ● ● ● ● ● ● ● ● ● ● ● ● ● ● ● ● ● ● ● ● ● ● ● ● ● ● ● ● ● ● ● ● ● ● ● ● ● ● ● ● ● Gammaproteobacteria >5000 cells ml-1 Oceanospirillales/other ● ● ● ● ● ● ● ● ● ● ● ● ● ● ● ● ● ● ● ● ● ● ● ● ● ● ● ● ● ● ● ● ● ● ● ● ● ● ● ● ● ● ● ● ● ● ● ● ● ● ● ● ● ● ● ● ● ● ● ● ● ● ● ● ● ● ● ● ● ● Cyanothece (UCYN-C) DIP DIP DIP DIP DIP DIP
Figure 3. Evolution of the 16S community with time for surface samples (1 m depth) inside mesocosm M1. Absolute abundances
in cells mL−1were inferred in three calculation steps. Initially, raw read counts per OTU were normalized to equal 16S copy numbers (“16S-norm reads”). These reads were summed for all Prochlorococcus (Pro) and Synechococcus (Syn) OTUs in each sample and divided by the sum of flow cytometry cell counts for Syn and Pro in that sample, creating a ratio. For each OTU, the 16S-norm read count was then divided by this ratio to produce the inferred absolute abundance of that OTU. This procedure accounts for library size in each sample. For better visualization, the classes with (a) a maximum abundance above 5 % and (b) a maximum abundance between 0.5 and 5 % were plotted separately. (c–e) Families with > 5000 cells mL−1(at their respective maximum) amongst the dominant non-photosynthetic classes Alphaproteobacteria, Gammaproteobacteria, and Flavobacteriia. (f) All genera with > 250 cells mL−1(at their respective maximum) within photosynthetic Cyanobacteria. Dashed lines were used to connect the data points for visualization purposes only. The DIP fertilization event in the evening of day 4 is indicated by a black vertical line.
2 4 6 8 10 12 14 16 18 20 Inferred cells mL -1 2 4 6 8 10 12 14 16 18 20 ● ● ● Cyanobacteria Alphaproteobacteria Chloroplasts Gammaproteobacteria ● ● Flavobacteriia Thermoplasmata Acidimicrobiia ● ● ● ● Deferribacteres Deltaproteobacteria Phycisphaerae Cytophagia ● ● ● Betaproteobacteria Sphingobacteriia Actinobacteria 0 2 4 6 8 10 12 14 16 18 20 0 2 4 6 8 10 12 14 16 18 20 0 2 4 6 8 10 12 14 16 18 20 2 4 6 8 10 12 14 16 18 20 ● ● ● Synechococcus Prochlorococcus Calothrix ●Trichodesmium Classes with > 5 % maximum abundance Classes with 0.5–5 % maximum abundance
● ●Caulobacterales/Hyphomonadaceae SAR11 clade/Surface 1 Rickettsiales/other ● ● ●Rhodobacterales/Rhodobacteraceae Rhodospirillales/Rhodospirillaceae Rickettsiales/SAR116 clade SAR11 clade/other ● ● Alteromonadales/Alteromonadaceae Oceanospirillales/SAR86 clade
Days after the deployment of the mesocosms
(a) (b) (c) (d) (e) (f) ● ● ● ● ● ● ● ● ● ● ● ● ● ● ● ● ● ● ● ● ● ● ● ● ● ● ● ● ● ● ● ● ● ● ● ● ● ● ● ● ● ● ● ● ● ● ● ● ● ● ● ● ● ● ● 50 000 100 000 150 000 0 350 000 ● ● ● ● ● ● ● ● ● ● ● ● ● ● ● ● ● ● ● ● ● ● ● ● ● ● ● ● ● ● ● ● ● ● ● ● ● ● ● ● ● ● ● ● ● ● ● ● ● ● ● ● ● ● ● ● ● ● ● ● ● ● ● ● ● ● ● ● ● ● ● ● ● ● ● ● ● ● ● ● ● ● ● ● ● ● ● ● 5000 10 000 15 000 ● Opitutae Inferred cells mL -1 0 ● ● ● ● ● ● ● ● ● ● ● ● ● ● ● ● ● ● ● ● ● ● ● ● ● ● ● ● ● ● ● ● ● ● ● ● ● ● ● ● ● ● ● ● ● ● ● ● ● ● ● ● ● ● ● 20 000 40 000 100 000 150 000 ● ● ● ● ● ● ● ● ● ● ● ● ● ● ● ● ● ● ● ● ● ● 20 000 40 000 60 000 80 000 100 000 Inferred cells mL -1 ● ● ● ● ● ● ● ● ● ● ● ● ● ● ● ● ● ● ● ● ● ● 10 000 20 000 30 000 40 000 ● ● ● ● ● ● ● ● ● ● ● ● ● ● ● ● ● ● ● ● ● ● ● ● ● ● ● ● ● ● ● ● ● ● ● ● ● ● ● ● ● ● ● ● 500 1000 5000 10 000 20 000 40 000 60 000 80 000 100 000 120 000 140 000 ● ● Flavobacteriales/Flavobacteriaceae Flavobacteriales/NS9 marine group Alphaproteobacteria >5000 cells ml-1
Flavobacteriia >5000 cells ml-1 Cyanobacteria >250 cells ml-1
Gammaproteobacteria >5000 cells ml-1
Figure 4. Evolution of the 16S community with time for surface samples in the Nouméa lagoon waters. All abundances are given as inferred
absolute abundances in cells mL−1as described for Fig. 3. Data were plotted in the same way as for Fig. 3.
and dropped (Fig. 3c). One particular OTU (297), classi-fied as Thalassobium sp., contributed 79 % of
Rhodobac-teraceae sequences on that day, but only 2–20 % in other
samples. This peak corresponded to increased transcript
ac-cumulation from Rhodobacteraceae seen in the metatran-scriptome analysis (Pfreundt et al., 2016) and a 4-fold in-crease in bacterial production on that day (Fig. 1e). This situation occurred the morning before the DIP fertilization
and was accompanied by a 30–50 % increase in SAR86, SAR11, and Rhodospirillaceae. Notably, a similar increase of SAR11 was observed in the lagoon (Fig. 4c), speaking against a M1-specific trigger for this group. In addition, a M1-specific severe drop of Synechococcus from > 60 000 to 25 000 cells mL−1was observed (Fig. 3f). While
Rhodobac-teraceae dropped to ∼ 5000 cells mL−1on day 6 – similar to
lagoon values – and stayed fairly stable until day 14, SAR11, dominated by the Surface 1 group, increased from 30000 to > 100 000 cells mL−1on day 8 and outcompeted all other het-erotrophic bacteria in M1 (Fig. 3c). SAR11 was replaced by SAR116 2 days later, the most numerous alphaproteobac-teria for most of the experiment, and surpassed in numbers only by SAR86 at the end of the experiment (Fig. 3d). After day 14, Rhodobacteraceae other than Thalassobium became more numerous again both in M1 and the lagoon (Figs. 3c, 4c).
Within Alphaproteobacteria, SAR11 abundance dynam-ics were completely uncorrelated between M1 and the la-goon, whereas other groups were slightly positively corre-lated (Fig. S2c). Within Gammaproteobacteria,
Alteromon-adaceae and SAR86 together constituted between 75 and
almost 90 % (Fig. 3d) and whereas the former showed very similar dynamics between M1 and the lagoon waters, SAR86 did not (Fig. S2d). A second abundance peak of SAR86 occurred only in M1 on days 16 and 18 and co-incided with similar peaks of less abundant heterotrophic classes (Fig. 3b, d). While in M1, SAR86 never de-creased below 30 000 cells mL−1 with peaks of 80 000 and 110 000 cells mL−1, these bacteria were mostly around or be-low 30 000 cells mL−1in the lagoon after day 4.
Within Flavobacteriia, the dominant families exhibited highly correlated temporal dynamics in M1 and the la-goon and also between the different families (Fig. S2e). The
Flavobacteriaceae family dominated, increasing from 4000
to 32 500 cells mL−1between days 10 and 18 in M1 (Fig. 3e), in the period of DIP consumption, coinciding with higher Chl concentrations from day 12 onward (Fig. 1b, c). A maximum abundance of 38 000 cells mL−1 was reached in the lagoon also on day 18 (Fig. 4e). The NS9 marine group, the sec-ond most abundant flavobacterial group, had very low abun-dances until day 16 and increased towards the end of the ex-periment in both locations.
Generally, a steep increase (> 2-fold) of total non-photosynthetic cells (abundant classes except Cyanobacteria and chloroplasts) from day 12 to day 16 was seen in M1 (Fig. 3a, b), which was not seen in flow cytometry counts of total heterotrophic bacteria (Fig. 2b) but was accompa-nied by a moderate increase (50 %) in BP (Fig. 1e), sup-porting the former. Spearman rank correlation between BP and inferred cell counts for non-photosynthetic bacteria was 0.56, p = 0.09 (0.72, p = 0.03 when omitting day 21 with its prominent BP peak). N2-fixation rates were also
substan-tially higher throughout this period (days 12 to 16) than be-fore and stayed high until the end of the experiment on day
23 (Fig. 1f). Preceding and overlapping this reaction of het-erotrophs was a constant increase in Synechococcus from its minimum of ∼ 20 000 cells mL−1on day 9 to maximally
104 000 cells mL−1on days 19–20 (Fig. 2a).
3.2.4 Temporal dynamics of the 16S community
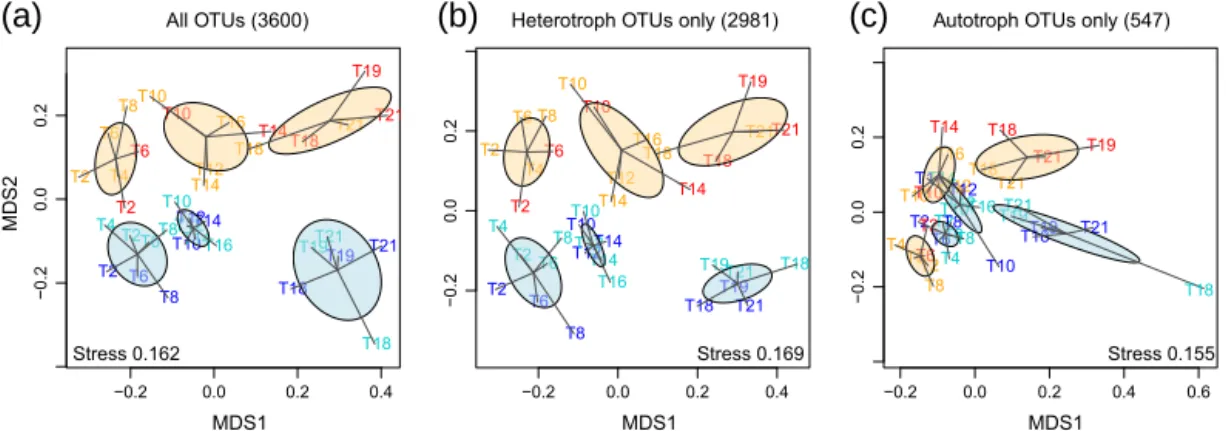
Using all OTUs as a basis, we did unconstrained ordination of all samples on Bray–Curtis dissimilarities calculated from standardized relative abundances. NMDS showed that inside M1 as well as in lagoon waters, the microbial communities defined three distinct clusters (Fig. 5a). Days 2–8, days 10– 16, and days 18–21 (the last day 16S rRNA gene sequencing was done for) were grouped together and the clusters sep-arated along the first MDS axis both in lagoon waters and in M1, whereas the locations lagoon waters and M1 (color-coded in blue and orange, respectively) were also clearly sep-arated along the second MDS axis. These clusters in time will be called early, mid-time, and late from here on and were time delayed from the periods P0, P1, and P2 defined by bio-geochemical parameters, production rates, and N2 fixation
(see Sect. 2.1). Thus, communities from M1 and the lagoon were clearly different from each other but followed a simi-lar trajectory with time. When we separated the autotrophic community (547 OTUs) from the heterotrophic community (2981 OTUs, all OTUs other than cyanobacteria and chloro-plasts) for ordination, it became evident that the heterotrophs showed a pattern very similar to the full community (Fig. 5b). The autotrophic community also clearly separated early, mid-time, and late phases from each other in M1 and the lagoon, but not as far, and separation by location (M1 vs. lagoon wa-ters) only really became evident in the late phase (Fig. 5c). PERMANOVA showed that indeed the community structures of the full OTU set, as well as both separate OTU sets, were significantly different between the three phases (predictor time) and were also different according to their origin, M1, or lagoon waters (predictor location; p values < 0.001, for au-totrophs p = 0.003). Using the interaction of the predictor location with time additionally showed that time still had a significant effect after taking out the location effect but not the other way around. This shows that the effect of time was stronger and included the effect of location. Depth had no significant effect.
3.2.5 Effect of hydrological and biogeochemical parameters on the community structure of dominant OTUs
The 34 dominant OTUs (in terms of summed relative abun-dances of all samples) were subjected to constrained ordina-tion within the frame of eight environmental variables (BP, PP, APA, Chl, POC, N2 fixation, DIP, and temperature T ),
taking all samples from M1 and the lagoon from 1 and 12 m depth into account (Fig. 6). The sum of all unconstrained eigenvalues was 0.304 and the sum of canonical eigenvalues
−0.2 0.0 0.2 0.4 −0.2 0.0 0.2 All OTUs (3600) MDS1 MDS2 T18 T19 T21 T21 T21 T10 T8 T19 T2 T18 T8 T6 T2 T6 T10 T21 T18 T19 T4 T14 T16 T4 T6 T2 T2 T6 T18 T10T16 T8 T14T12 T12 T10 T12T14 T14 −0.2 0.0 0.2 0.4 −0.2 0.0 0.2
Heterotroph OTUs only (2981)
MDS1 T19 T21 T18 T21 T21 T10 T8 T2 T6 T2 T19 T18 T21 T6 T8 T10 T4 T19 T18 T2 T6 T4 T2 T6 T16 T16 T18 T14 T8 T14 T12T12 T10 T12 T14 T10T14 −0.2 0.0 0.2 0.4 0.6 −0.2 0.0 0.2
Autotroph OTUs only (547)
MDS1 T19 T14 T18 T21 T8 T21 T2 T4T6 T16 T10 T6T4 T19 T18 T14 T10 T18 T14 T2 T21 T10 T6 T2 T21 T12 T8 T6 T14 T19 T12 T2T10T8T12T16 T18
(a)
(b)
(c)
Stress 0.162 Stress 0.169 Stress 0.155
Figure 5. NMDS ordination of all samples using Bray–Curtis distances based on the relative abundances of (a) all OTUs, (b) only
non-cyanobacterial OTUs (“heterotrophic bacteria”), or (c) only OTUs classified as photosynthetic cyanobacteria. The samples are color-coded as follows: orange for the M1 surface, red for M1 12 m, light blue for the Nouméa lagoon surface, and blue for Nouméa lagoon 12 m. Ellipses are color-coded in a similar way to distinguish M1 sample clusters and Nouméa lagoon sample clusters. Ellipses denote a confidence interval of 0.95 around the weighted average of each cluster. Thus, clusters can be considered significantly different with α = 0.05, if ellipses do not overlap.
was 0.130. Thus, the amount of total variation in the species data that could be explained by the employed environmen-tal variables was 43 % (permutation test; p < 0.001 after 999 permutations). The canonical axes F1 and F2 accounted for 50.5 and 22.3 % of this total explainable variance and 21.6 and 9.5 % of the total variance, respectively. Both axes were significant and displayed strong species–environment corre-lations (p < 0.001 for both axes). Samples (location and time; Fig. 6b) were mainly separated along F1 with days 6 to 14 towards negative values and days 16 to 21 towards posi-tive values. Interestingly, samples from M1 were separated further apart from each other than those from the lagoon. The main parameters separating samples and OTUs (Fig. 6a) along the F1 axis were DIP, which was clearly higher in M1 samples following the DIP fertilization (days 6–10), and BP, Chl, and PP in opposition to DIP. Highly associated with BP and Chl were the late-phase samples from M1 and lagoon, together with Rhodobacteraceae OTUs 1 and 37 and the flavobacterial NS4 marine group OTU 44, suggesting these directly profited from primary producers at the end of the experiment. Interestingly, another Rhodobacteraceae OTU (23) was tightly associated with N2 fixation and with the
OM60(NOR5) OTUs 2 and 18 from the Halieaceae family of Gammaproteobacteria. Other gammaproteobacterial OTUs,
Alteromonas OTU 13 and SAR86 OTUs 7 and 26, were
po-sitioned oppositely, closer to high DIP values, and together with all three SAR11 OTUs (43, 60, 2922), three of four SAR116 OTUs (16, 20, 34), the Rickettsiales group S25(593) OTU 27, and Candidatus Actinomarina OTU 6 (Actinobac-teria). Most tightly associated with high DIP concentrations was Defluviicoccus OTU 40 (Rhodospirillaceae). Also in the same quadrant, but forming a separate cluster, were MGII Euryarchaeota. Two more SAR86 OTUs (98, 1229) were separated from the rest and linked with Prochlorococcus and
with the very early samples from days 2 to 4 in M1 and days 2 to 8 in the lagoon. One MGII and one SAR116 OTU (47 and 19) were also separated from the rest, possibly profit-ing from higher temperatures. More tightly linked with in-creasing temperatures and APA was the dominant flavobac-terial OTU (Sufflavibacter OTU 67) in lagoon samples from days 16 to 21. Noteably, there was an opposition between the two dominant autotroph OTUs, Synechococcus (9) and
Prochlorococcus (4), where the former was closely linked to
the increase of PP and Chl at the end of the experiment.
Rho-dospirillaceae of the Aegean-169 group were positioned
op-posite to APA, T , and PP and close to Prochlorococcus and two chloroplast OTUs (3 and 1677), suggesting they might profit from these autotrophs specifically.
The quadrants resulting from this CCA nicely correspond to the clusters in time found through NMDS (Sect. 3.2.4), with few overlaps between quadrants: the bottom left corre-sponds to the early phase, the top left to the mid-time phase, and both right quadrants together to the late phase (compare Figs. 6 and 5).
4 Discussion
4.1 Inference of absolute abundances from relative 16S data
Our results rely on the calculation of absolute cell counts from relative 16S abundance data obtained by MiSeq se-quencing. This is possible by supplementing these data with flow cytometry data and 16S copy numbers per genome. Whereas major trends could likewise be observed in the rel-ative data (Figs. S4, S5), the inferred absolute data give a much more precise picture of the bacterial community and have the power to reveal absolute abundance changes of
spe-Synechococcus-9 Prochlorococcus-4 SAR86-1229 Aegean169-1177 Actinomarina-6 SAR86-7 SAR11-2922 SAR11-60 SAR116-16 SAR116-34 SAR116-20 OM60(NOR5)-2 Aegean169-35 Rhodob-1 SAR11-43 S25(593)-27 Aegean169-39 SAR86-26 MGII-123 SAR86-98 MGII-141 Rhodob-23 Alteromonas-13 SAR116-19 Sufflavibacter-67 MGII-53 MGII-47 Chloroplast-3 Marinimicrobia-17 OM60(NOR5)-18 Rhodob-37 Defluvicoccus-40 Chloroplast-1677 PP BP APA Chl DIP POC N2 fixation - 0.5 - 0.4 - 0.3 - 0.2 - 0.1 0 0.1 0.2 0.3 0.4 0.5 0.6 F2 (22. 28 %) T°C NS4margroup-44 2 M1 s 4 M1 s 6 M1 s 8 M1 s 10 M1 s 14 M1 s 18 M1 s 21 M1 s 2 M1 d 6 M1 d 10 M1 d 14 M1 d 18 M1 d 19 M1 d 21 M1 d 2 NL s 4 NL s 6 NL s 8 NL s 10 NL s 12 NL s 14 NL s 16 NL s 18 NL s 19 NL s 21 NL s 2 NL d 6 NL d 8 NL d 10 NL d 12 NL d 14 NL d 18 NL d 19 NL d 21 NLd PP BP APA Chl DIP POC - 0.5 - 0.4 - 0.3 - 0.2 - 0.1 0.1 0.2 0.3 0.4 0.5 0.6 0.8 - 0.7 - 0.6 - 0.5 - 0.4 - 0.3 - 0.2 - 0.1 0 0.1 0.2 0.3 0.4 0.5 0.6 0.7 0.8 0.9 1 F1 (50,49 %) F2 (22. 28 %) T°C 0 12 M1 s 16 M1 s N2 fixation Objects Alphaproteobacteria Gammproteobacteria Flavobacteriia Euryarchaea photoautotrophs Environmental variables Nouméa lagoon - NL Mesocosm 1 - M1 Sites
(a)
(b)
Figure 6. Canonical correspondence analysis (CCA) biplot of bacterial 16S-community structure. Correlations between environmental
vari-ables and the first two CCA axes are represented by the lengths and angles of the arrows. The position of OTUs or samples relative to arrows indicates the extent to which the distribution of that OTU or the community composition of that sample is influenced by the environmental parameter represented by that arrow. (a) Ordination of OTUs constrained by the given environmental variables (black lines). Color-coded pen squares mark the 34 most abundant OTUs in the two-dimensional space of the plot. These were one Synechococcus, one Prochlorococcus, and two chloroplast OTUs (photoautotrophs, red); three SAR11, four SAR116, three Aegean169 marine group, three not further classified Rhodobacteraceae (Rhodob), one Rickettsiales S25(593), and one Rhodospirillaceae (Defluviicoccus) OTU (Alphaproteobacteria, blue); four SAR86, two OM60(NOR5) clade (Alteromonadaceae), and one Alteromonas OTU (Gammaproteobacteria, green); one Sufflavibacter and one NS4 marine group OTU (Flavobacteriia, orange); four Marine Group II archaea (MGII, Euryarchaeota, pink); one Candidatus Actinomarina OTU (Acidimicrobiales, black) and one unclassified Marinimicrobia OTU (black). (b) Ordination of sampling sites in the same two-dimensional space. Sites are coded “M1” and “NL” for their origin from mesocosm M1 and the Nouméa lagoon, then “s” or “d” according to the depth sampled (surface 1 m and deep 12 m, respectively). These codes are prefixed by a number giving day of sampling (from days 2 to 21).
cific groups within. However, there are major potential error sources that need to be mentioned. First of all, the curated table of 16S copy numbers per genome is a conscientious es-timate and some eses-timates might well be corrected as more genomes of marine bacteria are being sequenced. Second,
flow cytometry might miss some Syn or Pro, if cells are part of aggregates. This would matter if the fraction of Syn or Pro in aggregates changed between samples. To test for biases, we calculated the ratio of Syn to Pro for 16S-copy-number-normalized 16S read counts (16S-norm reads) and for flow
cytometry counts. In an error-free scenario, both should give the same ratios. With a systematic error source, e.g., constant percentage of Syn in aggregates, the ratios would differ by a similar value in all samples. However, we observed varying ratio differences (Supplement Table S1). In M1, Pro was ei-ther underestimated in flow cytometry or Syn underestimated in the 16S data, leading to higher Syn/Pro ratios in flow cy-tometry data than in 16S data for most samples. In the la-goon, this was the case until day 16, the samples after that showed the opposite. Apart from differential aggregation be-tween samples, a reason for this might be that the assumed 16S copy number of two for Syn and one for Pro did not re-flect the real populations, but that the initial Syn population had only one copy (or the Pro population two copies), leading to Syn underestimation in 16S data. These errors are reduced by using the sum of Syn and Pro for the calculation of the 16S-norm / cells mL−1ratio. However, the reader should be
aware that the inferred absolute counts are mere estimates.
4.2 Synechococcus as the most numerous primary
producer
In the world’s oceans, the unicellular cyanobacteria
Prochlorococcus and Synechococcus constitute the most
abundant marine picophytoplankton, amounting together up to 106cells mL−1, and are responsible for up to 50 % of the total CO2 fixation in some regions (Liu et al., 1997; Li,
1994; Veldhuis et al., 1997). Previous studies (Zwirglmaier et al., 2008) showed that Synechococcus abundance is low in the oceanic oligotrophic gyres, reaching only 4 × 10³, but is up to 105cells mL−1in nutrient-rich upwelling regions (see
also the data compilation in Flombaum et al. (2013). There-fore, the cell counts reported here for Synechococcus in the New Caledonian lagoon were, with up to 105cells mL−1, among the highest reported thus far for marine waters. In contrast, the maximum values for Prochlorococcus were rel-atively low. Several studies indicated that Prochlorococcus is adapted to ultra-oligotrophic conditions and is outcompeted by Synechococcus in waters of higher nutrient content, such as upwelling and coastal regions (Partensky et al., 1999a, b), which is consistent with the findings in this study (Leblanc et al., 2016). The Synechococcus group can be further delin-eated into several major clades with different ecophysiolo-gies (Scanlan et al., 2009). Due to the insufficient phyloge-netic resolution, this was not possible based on 16S rRNA gene sequencing. However, in the accompanying metatran-scriptome analysis (Pfreundt et al., 2016), we found that the
Synechococcus population was dominated by representatives
of clade II and to a lower extent, clade IX, within the pi-cophytoplankton subcluster 5.1A. Recent analyses have sug-gested that the different frequencies of co-occurring
Syne-chococcus ecotypes partition the ocean into four distinct
regimes that can be distinguished by temperature, macronu-trients, and iron availability, suggesting clade II ecotypes are competitive in warmer, oligotrophic conditions (Sohm et al.,
2015), which is consistent with the results of our metatran-scriptomic analysis (Pfreundt et al., 2016). Measurements of BP and PP revealed that the organic matter produced by non-diazotrophic phytoplankton was the major carbon source fu-eling heterotrophic prokaryotes (Van Wambeke et al., 2015). Our community analysis identified among these primary pro-ducers Synechococcus as most numerous contributor.
4.3 Effects of enclosure and DIP fertilization on the microbial community
Apart from investigating the effect of changing diazotroph communities on general community structure, we judged to which extent the enclosure and the DIP fertilization in the deployed large mesocosms changed community composition and development compared to the surrounding lagoon wa-ters. Roughly, the 16S community partitioned the M1 sam-ples into three periods, an early period of DIP availability (in-cluding samples before the spike) until day 8, a mid-time pe-riod of DIP consumption, and a late pepe-riod of Chl accumula-tion/P depletion starting with day 18. Remarkably, although we enriched the mesocosms with ∼ 0.8 µM DIP and noticed a significant difference between the communities in M1 and in lagoon waters (Fig. 5a, separation along the second ordina-tion axis, p < 0.001), the evoluordina-tion of both communities with time was mostly parallel, shown by their parallel separation along the first ordination axis. This indicates an overarching influence of abiotic factors acting on both locations equally, like temperature, which increased during the course of the study. Individual OTUs, like Sufflavibacter, were shown to be positively linked with increasing temperatures. These re-lations may be linked to significantly enhanced chemotactic abilities at higher temperatures, as was recently shown for a coral pathogen (Garren et al., 2015). Despite the parallel evolution of the full community (rare and abundant OTUs had similar weights in NMDS), community composition and dynamics of single abundant groups in M1 were different to those in the lagoon from the beginning. These differences first became evident with the drop in Synechococcus on days 2 to 4 (Figs. 2a, 3a). In this process, cyanophages might have played a role as suggested by the high gene expression from
Myoviridae detected in M1 compared to the lagoon (Pfreundt
et al., 2016). Based on the known host association of these T4-like phages (Frank et al., 2013; Ma et al., 2014; Sabehi et al., 2012), these were likely targeting Synechococcus. This event and its putative consequences on the availability of or-ganic material coincided with diatoms sinking out of the wa-ter column in the mesocosms, roughly halving in numbers (Leblanc et al., 2016), and overlapped with DIP fertilization on day 4. Thus, it cannot be conclusively determined which had a higher influence on the community differences we ob-served in the early phase of the experiment, decaying phy-toplankton or increased DIP concentrations. Van Wambeke et al. (Van Wambeke et al., 2015) showed that BP was not P limited on day 4, suggesting that phytoplankton decay had
the greater effect. Indeed, POC concentrations in M1, but not in the lagoon, increased from ∼ 10 on day 2 to 15 µmol L−1
on day 4 (Berthelot et al., 2015).
We correlated the relative abundances in M1 and the Nouméa lagoon for all investigated phylogenetic groups (Fig. S2). This approach revealed Alpha- and Gammapro-teobacteria as the least correlated classes between M1 and the lagoon. Investigating this aspect at higher taxonomic res-olution showed that SAR11 and SAR86 temporal dynam-ics differed the most, suggesting that these groups were the most sensitive to changing nutrient sources. SAR11 was present at comparatively low numbers compared to other reports (Morris et al., 2002). We used filters with 0.45 µm pore size, so it cannot be excluded that SAR11 (average size 0.2 µm × 0.4 µm) and the even smaller Candidatus Actino-marina were lost at the beginning of filtering and retained when more other cells were already on the filter. Thus, we have possibly missed a substantial fraction of these groups in this study. Nevertheless, we can expect the loss rate to be very similar across all samples, due to the following rea-sons: 16S and metatranscriptomics analyses were done from DNA and RNA isolated together from the same filter. Tran-script abundances were tightly correlated (Pearson correla-tion 0.88 in M1, and 0.96 in the lagoon) between SAR86 and SAR11 (Pfreundt et al., 2016) across all samples. With different loss rates of SAR11 in different samples this cor-relation should not be possible. SAR86, like SAR11, shows metabolic streamlining, but while SAR11 genomes contain putative genes for synthesis of most amino acids (Grote et al., 2012), a substantial fraction of SAR86 is probably aux-otroph for Met, His, and Arg (Dupont et al., 2012). Op-positely, SAR86 genomes encode a disproportionally high number of TonB-dependent outer membrane receptors (TB-DRs) that allow transport of > 600 Da molecules, including carbohydrates and lipids, combined with lipase genes and an expanded sugar utilization metabolism, whereas SAR11 genomes are not known to contain any TBDR genes and have strongly reduced sugar utilization capabilities (Dupont et al., 2012). In our accompanying metatranscriptome study, transcripts for TBDRs and phospholipase (days 14–16) from SAR86 were highly abundant, suggesting that membrane lipids were used as an energy source (Pfreundt et al., 2016). Cultivation experiments of SAR11 representatives have shown their ability to utilize a wide variety of small organic molecules, including peptides, to generate energy (Tripp, 2013). The SAR11 subgroup Ia (surface 1) represen-tative Pelagibacter ubique was able to substitute one of its glycine by glycolate (Carini et al., 2013), which is one of the main excretion byproducts of phytoplankton and is as-sumed to be abundant in phytoplankton release. Finally, both SAR11 and SAR86 genomes contain proteorhodopsin genes, potentially providing an additional energy source, but the corresponding transcript levels were much higher in SAR11 than in SAR86 during the VAHINE experiment (Pfreundt et al., 2016).
Strikingly, for both SAR11 and SAR86, 16S abundance was decoupled from the respective total transcript accumula-tion presented in the companion paper, whereas the transcript abundances of both clades were highly correlated (Pfreundt et al., 2016), and specific abundant SAR11 and SAR86 OTUs shared a similar environmental niche (Fig. 6). Dupont et al. (Dupont et al., 2012) hypothesized that, due to their differ-ent resource specializations, SAR11 and SAR86 compete only slightly for dissolved organic carbon (DOC), which would allow for their co-existence, albeit without explain-ing their tight transcriptional correlation. Dominant SAR86 OTUs exhibited niche partitioning in the constrained ordina-tion (Fig. 6). The temporal variaordina-tion of two OTUs was close to SAR11 and Alteromonas and of another two OTUs close to
Prochlorococcus, suggesting different sources of DOC were
utilized by these SAR86 subtypes. On 16S sequence level, pairwise alignments of these four SAR86 OTUs showed se-quence identities between 86.3 % (OTUs 26 and 1229) and 94.9 % (OTUs 7 and 98). Thus, those SAR86 OTUs sharing a niche were not more similar on 16S level than in between niches.
An aspect of special interest was to recognize community changes which could be attributed to the DIP fertilization in M1. CCA suggested that the taxon profiting most from DIP fertilization was Defluviicoccus (Rhodospirillaceae). Apart from the maximum on day 6 in M1, this genus had sim-ilar abundances also in the Nouméa lagoon (Supplement).
Defluviicoccus-related bacteria were initially described from
enhanced biological phosphorus removal systems (Maszenan et al., 2005; McIlroy and Seviour, 2009; Mielczarek et al., 2013). In such systems, used to treat wastewater,
Defluviic-occus are known as glycogen-accumulating bacteria,
com-peting with polyphosphate-accumulating organisms (Burow et al., 2007; McIlroy and Seviour, 2009; Wong et al., 2004; Wong and Liu, 2007). There are only few studies reporting
Defluviicoccus-related bacteria in marine samples, and, if so,
these were associated with marine invertebrates (Enomoto et al., 2012; Fan et al., 2013). Our data show a minor population of Defluviicoccus-related bacteria in the Nouméa lagoon that could benefit from the addition of fresh phosphorus in M1. Note, however, that the dominant OTU in this genus was only 83 % identical to Defluviicoccus vanus 16S but 99 % identi-cal to environmental sequences that, according to SILVA tax-onomy for SSU release 119 and 123, are leaves of the same node as D. vanus and were thus classified as Defluviicoccus (name of the node). Phylogenetic placement of the here de-scribed Defluviicoccus OTUs showed their association with marine environmental Defluviicoccus 16S (Fig. S3).
4.4 Effects of DIP depletion at the end of the experiment
Some aspects of the taxonomic succession after day 13, when DIP was mainly depleted, can be related to the strategies used for adaptation to P limitation. Among autotrophs, the
main trend observed in M1 and the lagoon waters was the op-position of Prochlorococcus and Synechococcus with
Syne-chococcus reaching higher abundances in M1 at the end of
the experiment compared to the beginning, when DIP was comparatively low. Both expressed AP mainly 2 days after their respective 16S abundance peak (Pfreundt et al., 2016), suggesting that the increase in cell numbers led to a higher phosphorous demand that was subsequently adapted to. In-corporation of sulfolipids instead of phospholipids into mem-brane lipids is an ecological strategy developed by cyanobac-teria for an advantage in P deficient environments (Van Mooy et al., 2006, 2009). The ability to synthesize Sulfoquinovosyl diacylglycerols in place of phosphatidylglycerol in P-limited cultures can save 5 to 43 % of total cellular phosphorus de-mand and is highly variable according to the strain tested (Van Mooy et al., 2009). SqdB, a gene encoding a sulfolipid synthesis protein, was mainly transcribed by Synechococcus and less by Prochlorococcus (Pfreundt et al., 2016) and tran-script abundance changes corresponded to changes in 16S abundance. In the North Atlantic Ocean, Synechococcus are also good competitors with Prochlorococcus for DIP and ATP uptake (Michelou et al., 2011). A variety of heterotrophs expressed AP mainly after day 10, possibly to the benefit of other populations. Indeed, metagenomic analyses showed that 59 % of marine bacterial APs are extracellular, periplas-mic, or located at the outer membrane (Luo et al., 2009). Possibly, DIP release through extracellular APA may have provided P to neighboring cells that cannot synthesize this enzyme, and such effects could possibly be emphasized in macro-aggregate gels seen during P2 in the VAHINE experi-ment (Berman-Frank et al., 2016).
4.5 Possible functional roles of bacterial
subcommunities in the degradation of organic matter
The concerted increase of Cytophaga and Flavobacteriia to-wards the end of the experiment is a recurrent feature seen in older studies based on plateable strains (Fukami et al., 1981b; Painting et al., 1989) and in molecular studies allowing ac-cess to the uncultivable community (Teeling et al., 2012). Both Cytophaga and Flavobacteriia profit from phytoplank-ton blooms and have often been found in marine snow (De-Long et al., 1993; Fontanez et al., 2015; Teeling et al., 2012). Members of the Flavobacteriia are known to degrade organic matter, some even specializing on algal-derived organic mat-ter (Bauer et al., 2006; Bowman, 2006). In the lagoon, mem-bers of the Flavobacteriaceae reached even higher abun-dances than in M1, arguing against M1-specific effects be-ing the reason for their increase. The occurrence of different
Flavobacteriaceae phylotypes seems to depend on the
na-ture of the dominant phytoplankton species (Pinhassi et al., 2004). Information retrieved from analysis of cultured repre-sentatives showed a high capacity to degrade high molecular weight molecules, which is in line with the high
ectoenzy-matic activities generally associated with the end of blooms (Chróst, 1992; Riemann et al., 2000). The quality of organic matter issued from specific phytoplankton detritus influences bacterial community succession, and while the potential for polymer degradation appears to be widespread among differ-ent phyla it is restricted to some specialized species (Landa et al., 2014; Murray et al., 2007). Our data indicate that both in M1 and the lagoon, available organic components favored growth of diverse flavobacteria, probably enhanced by in-creasing temperatures during P2.
Our data further indicate that Rhodobacteraceae, when abundant, assimilate much more organic matter than other heterotrophs seen in this study, as dynamics in BP were closely linked to this group. This was not only shown by CCA (Fig. 6) but is also evident from directly comparing BP (Fig. 1e) to Rhodobacteraceae abundance. Both striking BP peaks on day 4 and day 21 in M1 correspond to con-comitant Rhodobacteraceae abundance peaks, while no other heterotrophic groups showed these peaks. Rhodobacteraceae are considered ecological generalists, with large gene inven-tories, but they cannot be easily condensed in an ecologi-cally differentiated cluster (Newton et al., 2010).
Roseobac-ter, a common marine member of the Rhodobacteraceae,
have a variety of metabolic pathways that confer advantages among other bacteria and facilitate interaction with, and at-tachment to, phytoplankton detritus. They can produce quo-rum sensing molecules, vitamins, and antimicrobial com-pounds (Buchan et al., 2014). CCA showed two dominat-ing Rhodobacteraceae OTUs linked with Chl concentrations (Fig. 5), which argues for their ability to access phytoplank-ton detritus, while one OTU was closely linked with N2
fixa-tion. Notably, none of these three OTUs represented the
Tha-lassobius sp. OTU that was responsible for the Rhodobacter-aceae peak on day 4.
4.6 The diazotroph community and its impact on the
heterotroph-community structure
Diazotroph-community structure (Figs. 3f, 4f) probably changed in M1 due to DIP fertilization and reduced turbu-lence, with Cyanothece-like cells profiting and forming large aggregates during P2 (Bonnet et al., 2015b). Our 16S-based diazotroph abundances compare reasonably well with those found by quantitative PCR of the nifH gene (Turk-Kubo et al., 2015), if we assume that those 16S reads classified as
Calothrix are indeed mostly Richelia (Het-1). The SILVA
database positions Richelia below the Calothrix node, and the metatranscriptome data published in this issue show a substantial Richelia read fraction and only little Calothrix (Pfreundt et al., 2016), supporting this assumption. Further, UCYN-C (Cyanothece) nifH gene abundance was at max-imum 100 copies mL−1 in M1 (Turk-Kubo et al., 2015), which matches well the maximal 400 cells mL−1that we in-ferred from relative 16S values for Cyanothece (Fig. 3f). Note that there are also non-diazotrophic Cyanothece