HAL Id: hal-01495041
https://hal.archives-ouvertes.fr/hal-01495041
Submitted on 27 Apr 2017HAL is a multi-disciplinary open access archive for the deposit and dissemination of sci-entific research documents, whether they are pub-lished or not. The documents may come from teaching and research institutions in France or abroad, or from public or private research centers.
L’archive ouverte pluridisciplinaire HAL, est destinée au dépôt et à la diffusion de documents scientifiques de niveau recherche, publiés ou non, émanant des établissements d’enseignement et de recherche français ou étrangers, des laboratoires publics ou privés.
Estimating Parallel Processing in a Language Task
Using Single-Trial Intracerebral Electroencephalography
Anne-Sophie Dubarry, Anaïs Llorens, Agnès Trébuchon, Romain Carron,
Catherine Liégeois-Chauvel, Christian G. Bénar, F.-X. Alario
To cite this version:
Anne-Sophie Dubarry, Anaïs Llorens, Agnès Trébuchon, Romain Carron, Catherine Liégeois-Chauvel, et al.. Estimating Parallel Processing in a Language Task Using Single-Trial Intracerebral Electroen-cephalography. Psychological Science, Association for Psychological Science, 2017, 28 (4), pp.414-426. �10.1177/0956797616681296�. �hal-01495041�
Author Query Form
Journal Title: Psychological Science
Article Number: 681296
Dear Author/Editor,
Greetings, and thank you for publishing with SAGE Publications. Your article has been copyedited, and we have a few queries for you. Please respond to these queries when you submit your changes to the Production Editor.
Thank you for your time and effort.
Please assist us by clarifying the following queries:
Sl. No. Query
1 (A) Please check that all authors are listed in the proper order, (B) clarify which part of each author’s name is his or her
surname; and (C) verify that all author names are correctly spelled/punctuated and are presented in a manner consistent with any prior publications.
2 Please review the entire document for typographical errors, mathematical errors, and any other necessary corrections;
check headings, tables, and figures.
3 Please confirm that you have sufficiently reviewed your proof and queries, and that you understand this is your FINAL
opportunity to review your article before publication.
https://doi.org/10.1177/0956797616681296 Psychological Science
1 –13
© The Author(s) 2017 Reprints and permissions:
sagepub.com/journalsPermissions.nav DOI: 10.1177/0956797616681296 pss.sagepub.com
Research Article
The stages involved in mental information processing (Taylor, 1976) can be distinguished on the basis of the types of knowledge they involve (e.g., semantic, lexical, phonological) or by the timing with which they operate. Regarding timing, a primary distinction has been made between sequential and parallel architectures. Donders’s (1868/1969) influential hypothesis and its variants postu-late that, in certain tasks, cognitive stages operate serially, that is, without temporal overlap. An alternative view postulates parallel—that is, concurrent—processing across cognitive stages (McClelland, 1979). As a case in point, word production is thought to involve multiple types of representations and levels of processing. Their processing architecture has been extensively debated on the basis of various types of evidence (Hickok, 2012; Levelt, 2001; Munding, Dubarry, & Alario, 2015; Rapp & Goldrick, 2000). Most recently, intracranial brain activity
has been marshaled to address this issue, and this work has led to contrasting conclusions (Edwards et al., 2010; Flinker et al., 2015; Leuthardt et al., 2012; Llorens, Trébuchon, Liégeois-Chauvel, & Alario, 2011; Sahin, Pinker, Cash, Schomer, & Halgren, 2009).
The coordination of mental operations has been framed differently in neurophysiological models than in cognitive models. Neurophysiological models often frame this coordination in terms of communication between brain regions through neuronal oscillations (Fries, 2015). The timing and spectral characteristics of
XXX10.1177/0956797616681296Dubarry et al.Parallel Processing in a Language Task
research-article2017
Corresponding Author:
F.-Xavier Alario, Laboratoire de Psychologie Cognitive, CNRS, Aix-Marseille Univ, Centre St Charles, 3 place Victor Hugo, Bâtiment 9, Case D, 13331 Marseille, CEDEX 3, France E-mail: [email protected]
Estimating Parallel Processing in a
Language Task Using Single-Trial
Intracerebral Electroencephalography
A.-Sophie Dubarry
1,2, Anais Llorens
1,2, Agnes Trébuchon
2,3,
Romain Carron
2,4, Catherine Liégeois-Chauvel
2,
Christian-G. Bénar
2, and F.-Xavier Alario
1[AQ: 1][AQ: 2][AQ: 3]1Aix-Marseille Université, CNRS, LPC, Marseille, France; 2Aix-Marseille Université, INSERM, INS, Marseille,
France; 3Aix-Marseille Université, APHM, Hôpital de la Timone, Service de Neurophysiologie Clinique,
Marseille, France; and 4Aix-Marseille Université, APHM, Hôpital de la Timone, Service de Neurochirurgie
Fonctionnelle, Marseille, France
Abstract
We provide a quantitative assessment of the parallel-processing hypothesis included in various language-processing models. First, we highlight the importance of reasoning about cognitive processing at the level of single trials rather than using averages. Then, we report the results of an experiment in which the hypothesis was tested at an unprecedented level of granularity with intracerebral data recorded during a picture-naming task. We extracted patterns of significant high-gamma activity from multiple patients and combined them into a single analysis framework that identified consistent patterns. Average signals from different brain regions, presumably indexing distinct cognitive processes, revealed a large degree of concurrent activity. In comparison, at the level of single trials, the temporal overlap of detected significant activity was unexpectedly low, with the exception of activity in sensory cortices. Our novel methodology reveals some limits on the degree to which word production involves parallel processing.
Keywords
mental chronometry, cascaded processing, word production, intracranial EEG, single trial Received 7/20/16; Revision accepted 11/7/16
these oscillations provide the grounds for proposing and contrasting functional-connectivity metrics (Wang et al., 2014) that are claimed to characterize various cognitive processes. A wide gap remains between the cognitive and neurophysiological formulations (cf. Fries, 2015, and Sigman & Dehaene, 2008), and many reports on high-level cognitive processing, such as language processing, continue to make explicit reference to the original cogni-tive distinction between parallel and serial processing (e.g., Edwards et al., 2010; Sahin et al., 2009; see also Lachaux, Axmacher, Mormann, Halgren, & Crone, 2012, p. 287; for integrative views, see Friederici & Singer, 2015; Strijkers & Costa, 2016).
Empirically discriminating between serial and parallel cognitive architectures is notoriously difficult. Contrasting models with different underlying architectures often yield indistinguishable predictions, which is referred to as model mimicry, the ability of a model to account for data generated by a competing model (e.g., Logan, 2002; Meyer, Osman, Irwin, & Yantis, 1988; Miller, 1988). Mea-sures of behavioral performance (e.g., response times, or RTs) record the final product of cognitive processing. Therefore, one must rely on indirect reasoning and com-plementary qualitative or quantitative assumptions to infer the underlying temporal architecture on the basis of behavioral performance. Also, in both behavioral and neurophysiological studies, data are usually aggregated (averaged) before comparisons are made, which contrib-utes to model mimicry (Burle, Roger, Vidal, & Hasbroucq, 2008). Electroencephalography (EEG) and magnetoen-cephalography (MEG) can record human cortical dynam-ics at millisecond resolution. To compensate for relatively low signal-to-noise ratio (SNR), though, the vast majority of studies have focused on trial averages (e.g., typical event-related potential, or ERP, studies). Such averaging is critically based on the assumption that the response is identical (both cognitively and time-wise) across trials. When there is variability across trials (e.g., in cognitive potentials; Jung et al., 1999), the average response pro-vides only a blurred view of the underlying processes (Holm, Ranta-aho, Sallinen, Karjalainen, & Müller, 2006). In short, the gain in SNR obtained by averaging is at the expense of spatiotemporal resolution, and therefore compromises what could be termed cognitive resolution (Miller, 1988, Section 2.4.4).
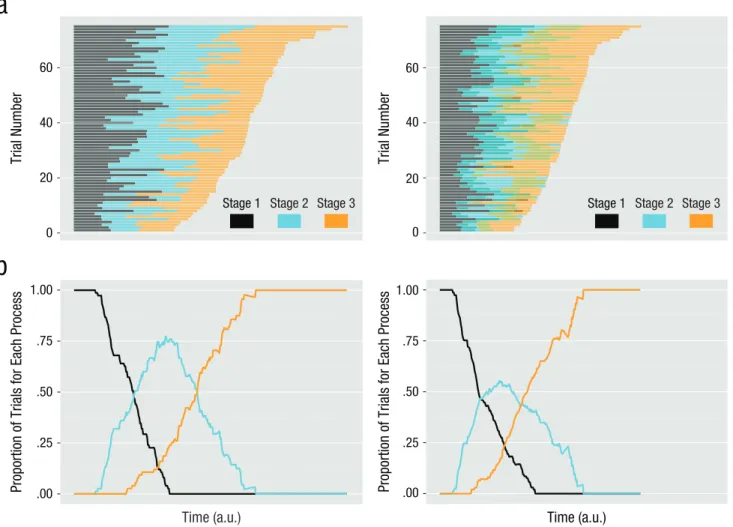
The main distinction between serial and parallel pro-cessing in language models is formulated at the level of a single prototypical trial, but averaged data have typically been used to test these models. To illustrate why this is problematic, we simulated an imaginary cognitive task with three processing stages (e.g., Donders, 1868/1969) that var-ied stochastically across trials; the duration of each process-ing stage was conceived as a random variable drawn from a uniform distribution. To form each trial, we combined durations of the three processing stages. To illustrate serial architecture, we combined the durations without temporal
overlap, and to illustrate parallel architecture, we combined them with a fixed 30% temporal overlap. For each architec-ture, multiple trials were formed in this way. The resulting trial durations, depicted in Figure 1a, were quite different for the two architectures. Figure 1b shows the proportion of trials in which each stage took place as a function of time elapsed since trial onset. As this figure illustrates, the amount of parallel processing cannot be evaluated prop-erly on the basis of averages; rather, cognitive activity would be better assessed at the level of single trials (for similar considerations, see Rey, Ahmadi, & Quian Quiroga, 2015).
The Current Study
In the current study, we measured the degree to which picture naming involves parallel processing. To do so, we used intracerebral activity in patients with epilepsy while they performed a picture-naming task. Intracerebral activity is recorded directly from cortex with a high SNR and can thus be fruitfully analyzed at the level of single trials. Within the complex recorded intracerebral signals, we focused on significant increases in activity detected in the high-gamma frequency band (80–150 Hz), as this is one of the indices thought to reliably reflect cognitive processing (Fries, 2015; Lachaux et al., 2012). Recording sites, located with spatial accuracy within a few millime-ters, were grouped across patients in standardized ana-tomical regions of interest (Mai, Paxinos, & Voss, 2008) on the basis of statistical consistency of the functional responses. This novel procedure was used to map all patients’ signals onto a common parcellated brain tem-plate, thereby compensating for the partial coverage of each patient’s brain and allowing a more integrated view (for a different approach, see Kadipasaoglu et al., 2014). The resulting regions were tentatively linked to their respective cognitive functions on the basis of previous functional-imaging evidence (mostly from Price’s, 2012, meta-analysis; see Table 1 for details). Finally, to quantify parallel processing (i.e., temporal overlap), we systemati-cally computed the proportion of trials in which the activity of two regions coincided in time and assessed the statistical significance of these proportions. This ratio can be thought of as a variant of measures of discrete mutual information; our goal was not to add yet another metric of functional connectivity to the available list of methods (Wang et al., 2014), but to formulate and implement a metric that was as directly related as possible to the origi-nal parallel-processing cognitive hypothesis.
Method
Patients
The experimental protocol was approved by the relevant institutional review board (i.e., the Comité de Protection
Parallel Processing in a Language Task 3
des Personnes). The patients (or their legal representa-tives in the case of minors) provided written informed consent. All patients were undergoing presurgical evalu-ation for pharmacologically intractable epilepsy at Hôpital de La Timone (a hospital in Marseille, France). Functional stereotactic exploration was performed using 5 to 11 depth electrodes (0.8 mm; Alcis, Besançon, France) each containing 10 to 15 recording sites (also referred to as contacts). Contacts were 2 mm long and separated from each other by 1.5 mm. The locations of the electrode implantations were strictly guided by clinical indications. Anticonvulsant therapy was reduced or withdrawn for the clinical exploration; however, the experiment was conducted only when a patient had been seizure-free for at least the preceding 12 hr.
A total of 23 epileptic patients for whom we had access to all anatomical and functional data volunteered to participate in the experimental protocol. Patients were
excluded if they were younger than 10 years old (n = 2), had previously undergone brain surgery (n = 2), or had a pathology that could alter their language abilities (e.g., dyslexia; n = 2).
Procedure
The task consisted of naming 108 objects depicted as black-on-white line drawings, an activity completed independently of the procedures for diagnosing the patients’ medical condition. The patients were seated in an electrically shielded room facing a display monitor at a distance such that the pictures, at the center of the screen, subtended an angle of 6° by 6°. An experimenter was present in the room in order to monitor the patients’ performance and take written note of any response that was erroneous. For each patient, the pictures were pseudorandomly ordered with the constraints that
a
b
Time (a.u.)
Proportion of Trials for Each Process
Time (a.u.)
Proportion of Trials for Each Process
1.00 .75 .50 .25 .00 1.00 .75 .50 .25 .00 0 20 40 60 0 20 40 60 Trial Number Trial Number
Stage 1 Stage 2 Stage 3
Stage 1 Stage 2 Stage 3
Fig. 1. Schematic representation of the consequences of averaging for distinguishing between serial processing (left) and parallel processing (right). The graphs in (a) present a raster view of the trials in our simulation ordered by response time. Each line shows the time course of the three theoretical processing stages during one trial. The graphs in (b) show the proportion of trials in which each of the three stages is taking place as a function of time. Note that for any given point in time, the proportions for a given stage are similar for the serial model and the parallel model. Thus, if a dependent variable based on averages were used, strong qualitative differences in the temporal organization within single trials (a) might be evident only as quantitative, perhaps subtle, differences in the overlap of stages across trials (b). a.u. = arbitrary units.
consecutive trials did not involve items from the same semantic category or words beginning with the same phoneme. On each trial, a single picture target was pre-sented for 1,000 ms; a fixation cross was prepre-sented for 1,750 ms ± 350 ms (random jitter) between trials. The patients were instructed to name each pictured object aloud as fast as possible while avoiding errors; they were asked to remain silent if they did not recognize an object or could not come up with an answer.
Responses were recorded with a microphone (Audio-Technica ATR20, Tokyo, Japan) placed 13 cm in front of the patients. The experiment was controlled by E-Prime Version 2.0.1 (Psychology Software Tools, Pittsburgh, PA); the software automatically computed and logged the naming latencies relative to picture onset. We rejected trials on which the response was presumably anticipated
(RT < 300 ms), delayed (RT > 1,600 ms), missing, or incorrect. Two patients who had less than 50% of the total number of trials remaining after these exclusions (19% and 46%, respectively) were dropped from analyses (see Table S1 in the Supplemental Material available online for details on the patients included in analyses).
Anatomical data
For all patients, both a structural preoperative MRI scan and an intraoperative computed tomography (CT) scan were acquired as part of the clinical routine. For each patient, we used the coregistration between MRI and CT obtained within the Leksell SurgiPlan software (Elekta, Stockholm, Sweden). Visual inspection of the fused images allowed us to precisely locate every contact
Table 1. The 23 Regions With Consistently Significant Activity
Subset and
abbreviation Region Associated cognitive processa
Subset 1
L.OcG Left occipital gyrus Visual association (Price, 2012)
L.17 Left striate area Primary visual processes (Price, 2012)
R.OcG Right occipital gyrus Visual association (Price, 2012)
R.SMG Right supramarginal gyrus Articulatory loop (Price, 2012)
(typically reported for the left hemisphere)
R.pFuG Right posterior fusiform gyrus No straightforward correspondence
L.LgG Left lingual gyrus Visual association (Price, 2012)
R.LgG Right lingual gyrus Visual association (Price, 2012)
R.mPHG Right medial parahippocampal gyrus Object recognition (Malach, Levy, & Hasson, 2002)
R.mFuG Right medial fusiform gyrus No straightforward correspondence
R.pITG Right posterior inferior temporal gyrus No straightforward correspondence
L.pFuG Left posterior fusiform gyrus Transition from visual form to semantic processing
Subset 2
L.POTZ Left parieto-occipital transition zone No straightforward correspondence
L.IFG Left inferior frontal gyrus Semantic decision and articulation (Price, 2012)
L.mFuG Left medial fusiform gyrus Transition from visual form to semantic processing (Price, 2012)
L.PCL Left paracentral lobule Sequencing of motor movements (Price, 2012)
L.Hi Left hippocampus Associative links (Llorens et al., 2016)
Subset 3
L.PrG Left precentral gyrus Orofacial motor activity (Price, 2012)
L.TTG1 Left anterior transverse temporal gyrus Primary auditory processes (Price, 2012)
R.SFGL Right superior frontal gyrus Semantic word selection (Price, 2012)
(typically reported for the left hemisphere)
L.mSTG Left medial superior temporal gyrus Auditory processing of complex sounds (Price, 2012)
R.pSTG Right posterior superior temporal gyrus Auditory association (Schuhmann, Schiller, Goebel, & Sack, 2012)
(linked to self-monitoring in the left hemisphere)
R.TTG1 Right anterior transverse temporal gyrus Primary auditory processes (Price, 2012)
L.aMTG Left anterior middle temporal gyrus Semantic association (Price, 2012)
Note: The theoretical framework used was a standard cognitive model of word production in picture naming involving multiple processing stages: visual, semantic, lexical, phonological, and articulatory (e.g., Indefrey, 2011; Levelt, 2001; Rapp & Goldrick, 2000).
aThe regions with consistently significant activity were linked to specific cognitive processes on the basis of a broad review of
functional-imaging studies (Price, 2012); when a region was not included or not discussed in detail in Price (2012), other studies were used. See the General Discussion for comments on this approach.
Parallel Processing in a Language Task 5 within each patient’s anatomy. These locations were then
visually classified by the neurologist on the basis of the human brain atlas (Mai et al., 2008), with only minor modifications to its parcellation. Left pars opercularis and left pars triangularis were merged into a single region, left inferior frontal gyrus. In addition, lateral basal and temporal regions, as well as mesial cingular areas, were divided into anterior, middle and posterior subregions. The latter subdivisions were intended to capture relevant functional distinctions made in Price’s (2012) review of functional-imaging studies of language. Finally, all patients’ contacts were mapped onto a common parcel-lated brain template.
All subsequent analysis was performed on activity in bipolar channels, calculated by subtracting activity recorded at one site from activity recorded at a neighbor-ing site within the same electrode. When two regions were involved in a bipolar channel (i.e., the two contacts of the channel were classified as located in two different regions), we adopted a conservative approach of classify-ing the channel as belongclassify-ing to both regions. All bipolar channels classified as outside the brain (by at least one of their contacts) were rejected from the analysis.
Functional data
Intracerebral EEG signals were recorded at a sampling rate of 1000 Hz using a 256-channel BrainAmp amplifier system (Brain Products GmbH, Munich, Germany). An acquisition band-pass filter was used to limit the bandwidth of the output signal to between 0.16 and 200 Hz. A scalp elec-trode placed in Fz was used as the recording reference.
Off-line preprocessing was performed with BrainVision Analyzer software (Brain Products GmbH, Munich, Ger-many). Data were then imported into MATLAB 2012a (The MathWorks, Natick, MA) for signal processing and statistical analysis. Cortex representations were created in Brainstorm (Tadel, Baillet, Mosher, Pantazis, & Leahy, 2011), which is freely available for download under the GNU general pub-lic pub-license (http://neuroimage.usc.edu/brainstorm).
Signal processing and group analysis
Signals were first processed for individual patients. Epochs were extracted from 1 s before to 2 s after the onset of each picture in the trials that were to be included in the analysis. Epochs containing epileptic spikes were removed by visual inspection (mean number of trials left for analy-sis = 87, range = 68–108), as were contacts with flat and noisy recorded activity. Bipolar channels were then com-puted as described earlier. Our analysis targeted activity in the high-gamma range, which has been repeatedly linked to cognitive processing (Lachaux et al., 2012). Time- frequency power was computed on consecutive 10-Hzbands between 80 and 150 Hz using a 7-cycle Morlet wavelet transform corresponding to a wavelet duration of approximately 50 ms at 80 Hz (a width that corresponds to 95% of the area under the Gaussian envelope). A base-line correction was applied on each trial at each 10-Hz band by computing a z score relative to activity during the baseline from 600 ms to 50 ms before picture onset (so as to exclude edge effects). Low frequencies have much higher power than high frequencies, and this correction procedure was adopted in order to compensate for this distribution of power across frequencies (Buzsáki, Anastassiou, & Koch, 2012). A series of power estimates were then obtained for each trial by summing the z-scored power across these bands.
The statistical significance of broadband power was assessed by computing one-sample Student’s t tests (α = .05) across trials at each time stamp. To account for the multiple-comparison problem in the time domain, we estimated a minimum duration threshold for each patient using a bootstrap procedure. This procedure consisted of randomly selecting the same number of trials as in the original data set but with repetitions allowed and identi-fying periods with significant activity within the baseline window from −600 ms to −50 ms. The procedure was repeated 1,000 times, and the maximum numbers of con-tiguous points passing the significance threshold (corre-sponding to uncorrected p = .05) were pooled into a bootstrap distribution. A significance threshold corre-sponding to 95% of the histogram of maximum values was then obtained.
To compensate for the inevitable variability of elec-trode implantation sites across patients and the potential idiosyncrasies of the patients, we then combined signals from individual participants in a group analysis. The goal was to identify functional consistency within each region across patients, so as to take “a more global approach” (i.e., more global than using multiple single-case studies or focusing on a small set of brain structures) to examin-ing “global brain dynamics” (Lachaux et al., 2012, pp. 291−292; Lachaux discusses strengths and weaknesses of this approach on these pages). Only regions that were sampled in at least 2 patients (see Fig. S1a in the Supple-mental Material) and showed significant signal (see Fig. S1b in the Supplemental Material) were considered further. This procedure allowed us to integrate multiple patients’ data (see also Kadipasaoglu et al., 2014). To assess functional similarity across patients, we computed an average for each patient within each region within a time window spanning 400 ms before to 1,600 ms after picture onset. Similarity between the different patients’ time courses of z-scored power within each region was measured by mean pairwise Pearson correlation coeffi-cients. A heuristically determined criterion of r > .3 was used as a threshold for functional similarity.
For all regions that survived both the significance and the correlation criteria (Fig. S1c in the Supplemental Material, Table 1), the average z scores across patients were computed. For visualization purposes, we color-coded the regions according to the temporal order in which the averaged z score first exceeded a threshold of 3 (colormap jet in MATLAB). The brain template used for this visualization (and for Fig. S1 in the Supplemental Material) was the ICBM152 as implemented in Brainstorm, and the regions were either adapted from the predefined Destrieux and Desikan-Killiany atlases in Brainstorm or created from Brainstorm’s user interface (“scouts” manipulation).
Overlap analysis
The extent of overlapping activity between pairs of regions at the level of single trials was estimated on the basis of thresholded single-trial signals. We transformed the single-trial signals (z scores) into binary significance masks (on/off) by keeping only points that were above a threshold obtained using the local false-discovery rate (corresponding to q < .2; Efron, 2005); we note that the reported pattern of results was not strongly modified when more liberal thresholds (e.g., q < .6 were used). When several contacts sampled the same region within a patient, they were grouped together by taking the union of their significance masks in order to form one mask per region.
Then, for each pair of regions at each time sample, the overlap was defined as the ratio between the number of trials that were significantly “on” in both regions (Index 1) and the number of trials that were significantly “on” in at least one of the regions (Index 2). Index 1 effectively captured the simultaneous significant activity present in both regions. Including Index 2 ensured that trials in which both regions were not active were not considered, and that a sufficient number of trials were taken into account in the overlap measure (a minimum of 20 trials was adopted by examining the data histogram).
In order to smooth possibly excessive variability while preserving the temporal resolution of interest, we aver-aged both indices within 50-ms sliding windows in the poststimulus period (0–1,600 ms). For each 50-ms win-dow, the result was summarized in a matrix showing the maximal overlap strength of all the pairs of regions for which data were available and the 20-trial threshold was met. To assess the significance of overlap, we performed a nonparametric permutation analysis. For each pair of regions, we created a surrogate data set for one of the regions by shuffling the “on” and ”off” segments across time and across trials. Overlap in the surrogate data was measured, and the maximum value was kept. This proce-dure was repeated 1,000 times, and a significance
threshold corresponding to 95% of the histogram of max-imum values was obtained.
Results
For the 15 patients who remained after the exclusion cri-teria were applied (see Table S1 in the Supplemental Material), we analyzed intracerebral data from a total of 146 electrodes (mean per patient = 9.8, minimum = 6, maximum = 13) that recorded activity in 1,347 cortical sites, 720 located in the left hemisphere and 627 located in the right hemisphere.
Of the 99 regions that emerged from the classification of recording sites, 49 were sampled in at least 2 patients (Fig. S1a in the Supplemental Material). Significance thresholding revealed 38 regions showing significant high-gamma activity in at least 2 patients (Fig. S1b). A total of 23 regions (13 in the left hemisphere) showed significantly consistent activity across patients, r > .3 (Fig. S1c). The activity in each of these regions was ten-tatively associated with a particular cognitive process on the basis of previous evidence (mostly from Price, 2012; see Table 1 for full details). This procedure pointed to 13 different cognitive processes.
Average patterns
On average, high-gamma neural activity elicited by the stimuli started around 80 ms after picture onset in poste-rior regions associated with visual perceptual processing (Figs. 2a and 2c). The activity then spread to basal tem-poral regions bilaterally, up to mid fusiform areas and the left hippocampus. Regions in the dorsal pathway, such as the left inferior frontal gyrus, left precentral gyrus, and right supramarginal gyrus, were then engaged. The activ-ity finally reached the mid part of the superior temporal gyrus, which presumably is involved in auditory percep-tion of the spoken word.
We sorted the time series by increasing order of onset time, which allowed us to identify three subsets of regions that roughly followed different temporal patterns (see also Edwards et al., 2010): Subset 1 contained 11 bilateral basal-posterior regions (from left occipital gyrus to left posterior fusiform gyrus; see Fig. 2a) in which activity reached a z-score amplitude of 4 to 6 between 50 and 200 ms and slowly decreased back to zero at around 800 ms. The activity present around 1,100 ms in Figure 2a corresponds to the brain response to the disappearance of the visual stimulus (which was presented for 1,000 ms). Subset 2 involved five left-hemisphere regions (from left parieto-occipital transition zone to left hippocampus; see Fig. 2a) in which activity reached a z-score amplitude of 2 to 4 between 200 and 800 ms after picture onset. Subset 3 contained seven frontal and temporal regions
7 L.OcG L.17 R.OcG R.SMG R.pFuG L.LgG R.LgG
R.mPHG R.mFuG R.pITG L.pFuG L.POTZ L.IFG L.mFuG L.PCL L.Hi L.PrG L.TTG1 R.SFGL L.mSTG R.pSTG R.TTG1 L.aMTG –400 –200 0 200 400 60 08 00 1,000 1,200 1,400 1,600
c
Hippocampus RL Ventral Dorsal Right Left R L R L R L Early Latea
0 8 z Score 40 20 0 Number of Trials 20/ 3 7/2 6/2 5/2 9/3 12/ 5 11/ 4 9/3 11/ 5 5/3 7/4 6/3 3/2 4/2 7/2 4/4 7/2 6/2 3/2 5/2 5/2 5/3 4/2b
Time (ms) Onset Fig. 2. Average brain activity during picture naming. The raster plot in (a) shows the time course of activity in the high-gamma band, averagedacross patients, for
all regions
with at
least 2 patients with similar time courses (
r > .3); each line shows the temporal course for a single region. A threshold
z score of1.96 was used to identify regions with significant activ
-ity. The regions are ordered according to the first time bin in which the
z score exceeded 3; this order is color coded at the left and illustrated in the brain maps in (c). The number of
contacts and patients that were used to compute each averaged signal is provided at the right (contacts/patients).
The histogram in (b) shows the distribution of response times across
from both hemispheres (left precentral gyrus to left ante-rior middle temporal gyrus; see Fig. 2a) where z-score amplitude started to increase at around 800 ms and remained significant until the end of the time window. Activity in Subsets 1 and 2 largely overlapped in time, whereas activity in Subset 3 overlapped much less with activity in the two other subsets. Within each subset, the regions follow very similar temporal patterns, and there-fore activity largely overlapped in time. However, this overlap may have stemmed in part from combining data from different patients and different trials with variable durations (see Fig. 2b for the distribution of response times), so we next analyzed overlap within single trials.
Overlap within single trials
To assess the temporal overlap between cognitive func-tions more specifically, we computed activity overlap within pairs of regions at the level of single trials. This required that activity for each pair of regions was mea-sured within patients. We included all pairs of regions that were sampled in at least 1 patient (not 2, as in the preceding analyses), bearing in mind that the activity in each region was known to be consistent in at least 2 patients. Of the 107 pairs of regions for which we had data, 81 had enough trials to be further analyzed.
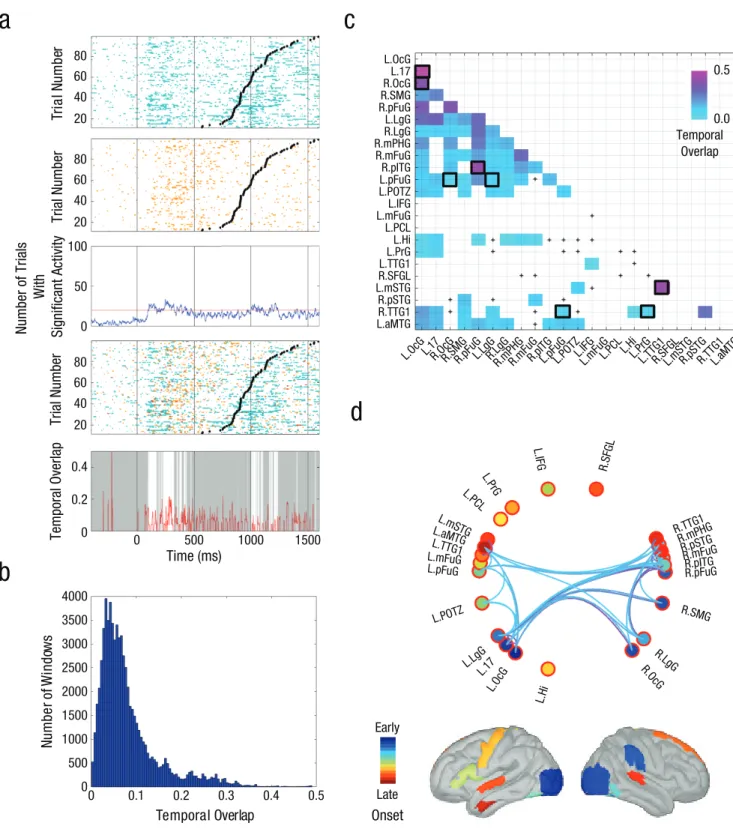
We tested the parallel-processing hypothesis with a metric that quantified, over time, the proportion of trials with overlapping activity for each pair of regions (see Method). This metric showed the strongest overlap in occipital and temporal regions, mainly between 80 ms and 400 ms after stimulus onset. There was also overlap-ping activity around 1,200 ms, which was maximal for superior temporal regions bilaterally (see Fig. S2 in the Supplemental Material). A histogram of the distribution of overlap across regions and the entire poststimu-lus period revealed a maximum overlap value of .46 (median = .075; Fig. 3b). The highest overlap values were observed in posterior regions (right posterior fusiform gyrus–right occipital gyrus; left striate area–left occipital gyrus) and in superior temporal regions (left median superior temporal gyrus–left anterior transverse temporal gyrus; right anterior transverse temporal gyrus postri– right posterior superior temporal gyrus; Fig. 3c). Eight pairs of regions survived a strict permutation test of the temporal overlap, exceeding the 95% threshold in the permutation distribution of the maximum overlap statistic (black squares in Fig. 3c).
Substantially less overlap was detected in many other pairs of regions (Fig. 3b). This was the case for some pairs of regions located within the ventral stream. For example, there was very limited overlap between the left lingual and posterior fusiform gyri, on the order of .10 (Fig. 3c). Limited, subthreshold, concurrent activation in
the ventral stream was also found for the following pairs of regions: left occipital gyrus and left hippocampus, left striate area and left hippocampus, and left occipital gyrus and posterior fusiform gyrus (Fig. S2); in all three cases, the overlap was less than .10. The dorsal stream has been hypothesized to be strongly left-hemisphere dominant. However, our sampling revealed right supramarginal gyrus activity that was moderately (subthreshold) con-current with activity in both the left (overlap = .17) and right (overlap = .5) lingual gyri, as well as with activity in the right posterior superior temporal gyrus (overlap = ~.12) and right anterior transverse temporal gyrus (over-lap = ~.08). In short, our analysis revealed moderate tem-poral overlap in two groups of regions roughly belonging to the dorsal and ventral pathways, and the strongest overlap in sensory cortices (see Fig. 3d for a circular dia-gram showing which pairs of regions had overlap values greater than .10 and brain images showing the anatomi-cal location of each region, along with color coding indi-cating the onset of activity in each region).
Discussion
To quantify parallel processing in word production, we investigated the temporal overlap between cognitive pro-cesses indexed by neurophysiological activity in different brain regions. Given the importance of addressing this issue at the level of single trials, we decided to measure activity using intracerebral EEG signal (which has high spatiotemporal resolution and very high SNR) recorded during a picture-naming task known to involve multiple processing levels. We jointly analyzed the data from 15 patients with epilepsy, targeting signal fluctuations in the high-gamma band that were significant and consistent across at least 2 patients.
Averaged and single-trial data offer
different views of temporal overlap
Signal averages revealed 23 brain regions with significant activity. The spatiotemporal patterns (Fig. 2) and our cog-nitive interpretation of the data (Table 1) are in agree-ment with many previous findings (Edwards et al., 2010; Indefrey, 2011; Leuthardt et al., 2012; Llorens et al., 2011; see also Munding et al., 2015; Price, 2012). Our examina-tion of the onset time of detected activity led us to distin-guish three groups of concurrently activated regions: early, middle, and late, roughly corresponding to, respec-tively, stimulus processing, semantic association and selection processes, and motor and auditory processes (see Table 1). Within each subset, there was substantial temporal overlap among regions and, therefore, among the (presumed) corresponding cognitive processes. These findings might prompt interpretations in favor of
Parallel Processing in a Language Task 9
a
b
c
d
Tr ia l Nu mb er 80 L.OcG L.17 R.OcG R.SMG R.pFuG L.LgG R.LgG R.mPHG R.mFuG R.pITG L.pFuG L.POTZ L.IFG L.mFuG L.PCL L.Hi L.PrG L.TTG1 R.SFGL L.mSTG R.pSTG R.TTG1 L.aMTG L.OcG L.17 R.Oc G L.LgG R.SMG R.pFuG R.LgG R.mPHG R.pITG L.pFuG L.mFuG L.POTZ L.IFG R.mFuG L.PCL L.Hi L.Pr G R.SFG L R.pSTG R.TTG1 L.TTG1 L.aMTGL.mSTGL.OcGL.17R.OcR.SMGR.pFuGL.LgGR.LgGG R.mPHGR.mFuGR.pITGL.pFuGL.POT
Z L.IFG
L.mFuGL.PCLL.HiL.PrGL.TTG1R.SFGLL.mSTGR.pSTGR.TTG1L.aMTG
60 40 20 80 60 40 20 80 60 40 20 0.4 0.2 0 500 1000 1500 4000 3500 3000 2500 2000 1500 1000 500 00 0.1 0.2 0.3 0.4 0.5 0 100 50 0 Trial Number Trial Number Temporal Overlap Number of Trials With Significant Activity Temporal Overlap Nu mb er of Wi nd ow s Time (ms) Temporal Overlap 0.0 0.5 Early Late Onset
Fig. 3. Temporal overlap between consistently active regions. The graphs in (a) illustrate an example of overlap between a pair of regions within a single patient. The two raster plots at the top show the temporal course of significant neural activity (color) in single trials for contacts located in the left occipital gyrus (L.OcG; first row) and the left fusiform gyrus (L.pFuG; second row). The trials are ordered by responses time (indicated by the black dots), from longest at the top to shortest at the bottom. Overlap was considered to be computable when the total number of trials show-ing significant activity (third row) was above 20 (red horizontal line). Superimposshow-ing the data from the two regions (fourth row) reveals visually the times at which the two regions had overlapping activity (in red). Such temporal overlap between regions was measured by dividing the number of trials with concurrent significant activity by the total number of trials with significant activity. The plot in the fifth row shows the temporal overlap (red) between the left occipital gyrus and the left fusiform gyrus as a function of time in this patient. White indicates periods for which there were
parallel processing within each subset, and perhaps serial processing across the subsets (especially Subset 3 relative to Subsets 1 and 2; Edwards et al., 2010; Leuthardt et al., 2012; Sahin et al., 2009).
At the level of single trials, the temporal overlap mea-sured was rather low. There was no obvious indication of serial processing (i.e., activity in one region system-atically preceding activity in another region). Instead, activity was distributed over the periods of interest (for an example, see Fig. 3a and Fig. S2 in the Supplemental Material). Temporal overlap in activity between a single pair of regions was never found on more than 50% of the trials. Furthermore, in most cases (i.e., in most 50-ms time windows), overlap occurred on about 5% of trials with significant activity (i.e., temporal overlap of .05; Fig. 3b). The highest temporal overlap was observed within sensory cortices: first in the regions presumably capturing progressive visual decoding of the pictures and then in the regions likely capturing the decoding of external auditory feedback from the patients’ own voices (Gourévitch, Le Bouquin Jeannès, Faucon, & Liégeois-Chauvel, 2008). Substantially less overlap was detected in pairs of regions located within the ventral stream (Fig. 3c), which is known to be involved in visual stimulus processing, object recognition (Malach, Levy, & Hasson, 2002), and lexico-semantic access (Trébuchon-Da Fonseca et al., 2009). The dorsal stream, which is mainly involved in mapping phonological onto articula-tory representations (Hickok, 2012), has been hypothe-sized to be strongly left-hemisphere dominant; however, our sampling revealed that right-hemisphere regions were moderately coactivated (subthreshold level).
The observed values of within-trial coactivation (all under .50 and generally under .10) might be taken at face value to reflect the actual levels of simultaneous process-ing occurrprocess-ing within the pairs of regions. Alternatively, these observed values might reflect the maximum degree of processing overlap that our analysis could detect.1 In
particular, the distribution of single-trial activity might have been influenced by the noise present in the data. It is important to note that the brain activities we report sur-vived a strict nonparametric permutation threshold, such that each region and its level of SNR provided its own control. Furthermore, the estimated levels of overlap were largely unaffected by lowering the statistical threshold, which suggests that moderate overlap was not due only to
excess false negatives (i.e., undetected activity that pre-vented the detection of overlap). With these considerations in mind, we conclude that the single-trial results match the predictions of the parallel-processing model in sensory cortices but not elsewhere, despite the “coactivations” that were clearly present in the (more blurred) averaged data.
Comparison with other
connectivity metrics
Our goal to quantify concurrent activity in parallel cognitive architectures led us to define a single-trial, temporal-overlap metric. This metric captured simultaneous (i.e., zero-lag) activation of two regions (for which enough trials were available) at a given point in time. Although the metric was defined on the basis of single time samples of single trials, it still integrated signal over time (and frequency). Our esti-mates smeared the signal over a temporal window of about 50 ms. Therefore, the window of concurrent activation that was tested was in the range of a few 10s of milliseconds. This is in the range posited by most recent hypotheses about communication through phase or amplitude correla-tion; interareal communication has been described as occur-ring in the range of the gamma band (Fries, 2015). Using a cognitive task very similar to ours (word reading and repeti-tion), Flinker et al. (2015) recently observed interareal com-munication at longer delays. In that study, Granger causality estimates indicated the direction of the respective influences of Broca’s area, superior temporal gyrus, and motor regions. Note that these temporal estimates characterize how infor-mation flowed between pairs of regions (with causal influ-ence present within 200-ms delays), rather than the degree of concurrent activation. Indeed, the main findings of Flinker et al. are compatible with both serial and parallel architectures. On the other hand, the estimates of concur-rent activation reported here do not address whether there is any causal relationship between concurrent processes (“contingent stages”; Miller, 1988)).
Limitations and perspectives
Our study has many of the well-known limitations that are inherent to studies of intracerebral activity in epilep-tic patients (Lachaux et al., 2012). Our group analysis compensated, to some extent, for strong interindividual variability. It yielded a fair spatial sampling (see Figs. S1a more than 20 trials, and gray indicates periods for which there were fewer than 20 trials. The histogram in (b) shows the distribution of 50-ms slid-ing windows (step = 1 ms) across regions accordslid-ing to the amount of temporal overlap they exhibited in the poststimulus period (0–1,600 ms). The color coding in (c) indicates the maximum temporal overlap observed between all pairs of regions in the poststimulus period. The black squares highlight pairs for which the overlap value exceeded the 95% threshold in the permutation distribution of the maximum overlap statistic. Plus signs indicate that there were not enough trials to compute the temporal overlap. The circular diagram of the 23 regions in (d) shows which pairs had overlap values greater than .10. The color coding in the brain images corresponds to the colors used in the diagram and indicates each region’s onset of activity (see also Fig. 2). For an explanation of the region labels, see Table 1.
Parallel Processing in a Language Task 11 and S1b in the Supplemental Material), but at the expense
of anatomical details provided by specific stereotactic implantations. In addition, potentially important variabil-ity in the signal was excluded from analyses as a result of the cross-patient consistency constraint. Single-trial concurrent coactivation could be assessed for 81 pairs of regions, but often only within 1 patient (48 pairs of regions).
Our focus on high-gamma activity was strongly moti-vated by current thinking that it is involved in cognitive processing and interregional communication, and we did not explore other potentially meaningful signal compo-nents (Canolty et al., 2007; Gaona et al., 2011); future research is needed to broaden the search space (e.g., to other frequency components). Data from single trials were reduced to a binary significance mask using a local false-discovery rate threshold, with the consequent risk of losing information. The motivations behind our approach were both statistical and theoretical: to estab-lish periods of significant activity within every trial and to provide the most literal test of the parallel-processing hypothesis.
Finally, to test a hypothesis about cognitive processing with neurophysiological data, we used an essentially ana-tomical approach to associate cognitive processes with brain regions (Poldrack, 2006; Price, 2012). This common practice has been identified as a case of reverse inference (Poldrack, 2006), and is particularly detrimental when inferences are made across cognitively different tasks. However, the cognition-brain associations we used were quite specific, came from a meta-analysis (Price, 2012), and involved the same task we used (picture naming) or very similar tasks (e.g., word reading). Additional links between cognitive processes and brain regions might be established through cognitive contrasts and analysis of activity patterns, as it is possible that cognitive processes have implementations distributed across regions, such that advanced multivariate methods (King & Dehaene, 2014) would have to be considered as means to detect these links.
Conclusion
Our study assessed the parallel-processing hypothesis at an unprecedented level of granularity in a language task. The group analysis of averaged data provided a detailed functional map of word production. At the level of single trials, significant activity was significantly concurrent in visual and auditory regions, but rarely concurrent among many other task-relevant pairs of regions. Within the boundaries of our exploration, our novel methodology reveals some limits to the degree to which word produc-tion involves the parallel-processing architecture postu-lated in major models of language processing.
Action Editor
Matthew A. Goldrick served as action editor for this article.
Author Contributions
C.-G. Bénar, and F.-X. Alario contributed equally to this article. C. A.-S. Dubarry, A. Llorens, A. Trébuchon, C. Liégeois-Chauvel, C.-G. Bénar, and F.-X. Alario conceived the research question and the experimental protocol. A.-S. Dubarry, A. Llorens, A. Trébuchon, and R. Carron collected the data. A.-S. Dubarry, A. Llorens, C.-G. Bénar, and F.-X. Alario analyzed the data. A.-S. Dubarry, C.-G. Bénar, and F.-X. Alario interpreted the data and drafted the manuscript. C. Liégeois-Chauvel provided critical comments, and all the authors edited the manuscript. All the authors approved the final version of the manuscript for submission.
Declaration of Conflicting Interests
The authors declared that they had no conflicts of interest with respect to their authorship or the publication of this article.
Funding
We acknowledge the support of European Research Council FP7/2007-2013 Grant 263575, as well as Agence Nationale de la Recherche Grant Multimodel 2010 BLAN 0309 01.
Supplemental Material
Additional supporting information can be found at http:// journals.sagepub.com/doi/suppl/10.1177/0956797616681296
Note
1. External evidence could be useful in assessing this alterna-tive. For example, sensory cortices could be expected to have a very high degree of concurrent activation given intrinsic connectivity patterns reported during resting-state recordings (Mantini, Perrucci, Del Gratta, Romani, & Corbetta, 2007).
References
Buzsáki, G., Anastassiou, C. A., & Koch, C. (2012). The ori-gin of extracellular fields and currents — EEG, ECoG, LFP and spikes. Nature Reviews Neuroscience, 13, 407–420. doi:10.1038/nrn3241
Burle, B., Roger, C., Vidal, F., & Hasbroucq, T. (2008). Spatio-temporal dynamics of information processing in the Brain: Recent advances, current limitations and future challenges.
International Journal of Bioelectromagnetism, 10, 17–21.
Canolty, R. T., Soltani, M., Dalal, S. S., Edwards, E., Dronkers, N. F., Nagarajan, S. S., . . . Knight, R. T. (2007). Spatiotemporal dynamics of word processing in the human brain. Frontiers in
Neuroscience, 1(1), 185–196. doi:10.3389/neuro.01.1.1.014.2007
Donders, F. C. (1969). On the speed of mental processes (W. G. Koster, Trans.). Acta Psychologica, 30, 412–431. doi:10.1016/0001-6918(69)90065-1 (Original work pub-lished 1868)
Edwards, E., Nagarajan, S. S., Dalal, S. S., Canolty, R. T., Kirsch, H. E., Barbaro, N. M., & Knight, R. T. (2010). Spatiotemporal imaging of cortical activation during verb generation and
picture naming. NeuroImage, 50, 291–301. doi:10.1016/j .neuroimage.2009.12.035
Efron, B. (2005). Local false discovery rates. Retrieved from https://statistics.stanford.edu/sites/default/files/BIO%20 234.pdf
Flinker, A., Korzeniewska, A., Shestyuk, A. Y., Franaszczuk, P. J., Dronkers, N. F., Knight, R. T., & Crone, N. E. (2015). Redefining the role of Broca’s area in speech. Proceedings
of the National Academy of Sciences, USA, 112, 2871–2875.
doi:10.1073/pnas.1414491112
Friederici, A. D., & Singer, W. (2015). Grounding language processing on basic neurophysiological principles.
Trends in Cognitive Sciences, 19, 329–338. doi:10.1016/j
.tics.2015.03.012
Fries, P. (2015). Rhythms for cognition: Communication through coherence. Neuron, 88, 220–235. doi:10.1016/j .neuron.2015.09.034
Gaona, C. M., Sharma, M., Freudenburg, Z. V., Breshears, J. D., Bundy, D. T., Roland, J., . . . Leuthardt, E. C. (2011). Nonuniform high-gamma (60-500 Hz) power changes dissociate cognitive task and anatomy in human cortex.
The Journal of Neuroscience, 31, 2091–2100. doi:10.1523/
JNEUROSCI.4722-10.2011
Gourévitch, B., Le Bouquin Jeannès, R., Faucon, G., & Liégeois-Chauvel, C. (2008). Temporal envelope processing in the human auditory cortex: Response and interconnections of auditory cortical areas. Hearing Research, 237, 1–18. doi:10.1016/j.heares.2007.12.003
Hickok, G. (2012). Computational neuroanatomy of speech production. Nature Reviews Neuroscience, 13, 135–145. doi:10.1038/nrn3158
Holm, A., Ranta-aho, P. O., Sallinen, M., Karjalainen, P. A., & Müller, K. (2006). Relationship of P300 single-trial responses with reaction time and preceding stimulus sequence.
International Journal of Psychophysiology, 61, 244–252.
doi:10.1016/j.ijpsycho.2005.10.015
Indefrey, P. (2011). The spatial and temporal signatures of word production components: A critical update. Frontiers
in Psychology, 2, Article 255. doi:10.3389/fpsyg.2011.00255
Jung, T.-P., Makeig, S., Westerfield, M., Townsend, J., Courchesne, E., & Sejnowski, T. J. (1999). Analyzing and visualizing sin-gle-trial event-related potentials. In M. J. Kearns, S. A. Solla, & D. A. Cohn, Advances in Neural Information Processing
Systems 11 (pp. 118–124). Cambridge, MA: MIT Press.
Kadipasaoglu, C. M., Baboyan, V. G., Conner, C. R., Chen, G., Saad, Z. S., & Tandon, N. (2014). Surface-based mixed effects multilevel analysis of grouped human electrocorticog-raphy. NeuroImage, 101, 215–224. doi:10.1016/j.neuroimage .2014.07.006
King, J. R., & Dehaene, S. (2014). Characterizing the dynam-ics of mental representations: The temporal generaliza-tion method. Trends in Cognitive Sciences, 18, 203–210. doi:10.1016/j.tics.2014.01.002
Lachaux, J.-P., Axmacher, N., Mormann, F., Halgren, E., & Crone, N. E. (2012). High-frequency neural activity and human cognition: Past, present and possible future of intra-cranial EEG research. Progress in Neurobiology, 98, 279– 301. doi:10.1016/j.pneurobio.2012.06.008
Leuthardt, E. C., Pei, X.-M., Breshears, J., Gaona, C., Sharma, M., Freudenberg, Z., . . . Schalk, G. (2012). Temporal evolution of gamma activity in human cortex during an overt and covert word repetition task. Frontiers in
Human Neuroscience, 6, Article 99. doi:10.3389/fnhum.2012
.00099
Levelt, W. J. (2001). Spoken word production: A theory of lexi-cal access. Proceedings of the National Academy of Sciences,
USA, 98, 13464–13471. doi:10.1073/pnas.231459498
Llorens, A., Dubarry, A.-S., Trébuchon, A., Chauvel, P., Alario, F.-X., & Liégeois-Chauvel, C. (2016). Contextual modu-lation of hippocampal activity during picture naming.
Brain & Language, 159, 92–101. doi:10.1016/j.bandl.2016
.05.011
Llorens, A., Trébuchon, A., Liégeois-Chauvel, C., & Alario, F.-X. (2011). Intra-cranial recordings of brain activity during lan-guage production. Frontiers in Psychology, 2, Article 375. doi:10.3389/fpsyg.2011.00375
Logan, G. D. (2002). Parallel and serial processing. In J. Wixted (Ed.), Stevens’ handbook of experimental psychology:
Methodology in experimental psychology (3rd ed., Vol. 4,
pp. 271–300). New York, NY: Wiley
Mai, J. K., Paxinos, G., & Voss, T. (2008). Atlas of the human
brain. Amsterdam, The Netherlands: Elsevier/Academic
Press.
Malach, R., Levy, I., & Hasson, U. (2002). The topography of high-order human object areas. Trends in Cognitive
Sciences, 6, 176–184. doi:10.1016/S1364-6613(02)01870-3
Mantini, D., Perrucci, M. G., Del Gratta, C., Romani, G. L., & Corbetta, M. (2007). Electrophysiological signatures of rest-ing state networks in the human brain. Proceedrest-ings of the
National Academy of Sciences, USA, 104, 13170–13175.
doi:10.1073/pnas.0700668104
McClelland, J. L. (1979). On the time relations of mental pro-cesses: An examination of systems of processes in cascade.
Psychological Review, 86, 287–330. doi:10.1037/0033-295X
.86.4.287
Meyer, D. E., Osman, A. M., Irwin, D. E., & Yantis, S. (1988). Modern mental chronometry. Biological Psychology, 26, 3–67. doi:10.1016/0301-0511(88)90013-0
Miller, J. (1988). Discrete and continuous models of human infor-mation processing: Theoretical distinctions and empirical results. Acta Psychologica, 67, 191–257. doi:10.1016/0001-6918(88)90013-3
Munding, D., Dubarry, A.-S., & Alario, F.-X. (2015). On the cor-tical dynamics of word production: A review of the MEG evidence. Language, Cognition and Neuroscience, 31, 441– 462. doi:10.1080/23273798.2015.1071857
Poldrack, R. A. (2006). Can cognitive processes be inferred from neuroimaging data? Trends in Cognitive Sciences, 10, 59–63. doi:10.1016/j.tics.2005.12.004
Price, C. J. (2012). A review and synthesis of the first 20 years of PET and fMRI studies of heard speech, spoken language and reading. NeuroImage, 62, 816–847. doi:10.1016/j .neuroimage.2012.04.062
Rapp, B., & Goldrick, M. (2000). Discreteness and interactiv-ity in spoken word production. Psychological Review, 107, 460–499. doi:10.1037/0033-295X.107.3.460
Parallel Processing in a Language Task 13 Rey, H. G., Ahmadi, M., & Quian Quiroga, R. (2015). Single
trial analysis of field potentials in perception, learning and memory. Current Opinion in Neurobiology, 31, 148–155. doi:10.1016/j.conb.2014.10.009
Sahin, N. T., Pinker, S., Cash, S. S., Schomer, D., & Halgren, E. (2009). Sequential processing of lexical, grammatical, and phonological information within Broca’s area. Science, 326, 445–449. doi:10.1126/science.1174481
Schuhmann, T., Schiller, N. O., Goebel, R., & Sack, A. T. (2012). Speaking of which: Dissecting the neurocognitive network of language production in picture naming. Cerebral Cortex,
22, 701–709. doi:10.1093/cercor/bhr155
Sigman, M., & Dehaene, S. (2008). Brain mechanisms of serial and parallel processing during dual-task performance.
The Journal of Neuroscience, 28, 7585–7598. doi:10.1523/
JNEUROSCI.0948-08.2008
Strijkers, K., & Costa, A. (2016). The cortical dynamics of speak-ing: Present shortcomings and future avenues. Language,
Cognition and Neuroscience, 31, 484–503. doi:10.1080/232
73798.2015.1120878
Tadel, F., Baillet, S., Mosher, J. C., Pantazis, D., & Leahy, R. M. (2011). Brainstorm: A user-friendly application for MEG/ EEG analysis. Computational Intelligence and Neuroscience,
2011, Article 879716. doi:10.1155/2011/879716
Taylor, D. A. (1976). Stage analysis of reaction time. Psychological
Bulletin, 83, 161–191.
Trébuchon-Da Fonseca, A., Bénar, C.-G., Bartoloméi, F., Régis, J., Démonet, J.-F., Chauvel, P., & Liégeois-Chauvel, C. (2009). Electrophysiological study of the basal temporal language area: A convergence zone between language perception and production networks. Clinical Neurophysiology, 120, 539–550. doi:10.1016/j.clinph.2008.12.042
Wang, H. E., Bénar, C. G., Quilichini, P. P., Friston, K. J., Jirsa, V. K., & Bernard, C. (2014). A systematic framework for functional connectivity measures. Frontiers in Neuroscience,