HAL Id: hal-00831819
https://hal.inria.fr/hal-00831819
Submitted on 7 Jun 2013
HAL is a multi-disciplinary open access
archive for the deposit and dissemination of sci-entific research documents, whether they are pub-lished or not. The documents may come from teaching and research institutions in France or abroad, or from public or private research centers.
L’archive ouverte pluridisciplinaire HAL, est destinée au dépôt et à la diffusion de documents scientifiques de niveau recherche, publiés ou non, émanant des établissements d’enseignement et de recherche français ou étrangers, des laboratoires publics ou privés.
Identifying and characterizing the ontogenetic
component in tree development
Yann Guédon, Yves Caraglio, Patrick Heuret, Emilie Lebarbier, Céline
Meredieu
To cite this version:
Yann Guédon, Yves Caraglio, Patrick Heuret, Emilie Lebarbier, Céline Meredieu. Identifying and char-acterizing the ontogenetic component in tree development. 5th International Workshop on Functional-Structural Plant Models, 2007, Napier, New Zealand. pp.38,1-5. �hal-00831819�
Identifying and characterizing the ontogenetic component in tree
development
Yann Guédon(1), Yves Caraglio(2), Patrick Heuret(2), Emilie Lebarbier(3) and Céline Meredieu(4)
(1) CIRAD, UMR DAP and INRIA, Virtual Plants TA A-96/02, 34398 Montpellier Cedex 5, France
E-mail: [email protected]
(2) UMR CIRAD/CNRS/INRA/IRD/Université Montpellier 2 Botanique et Bioinformatique de l’Architecture des Plantes
TA A-51/PS2, 34398 Montpellier Cedex 5, France E-mail: [email protected], [email protected]
(3) UMR INA P-G/ENGREF/INRA MIA, 16 rue Claude Bernard 75231 Paris Cedex 05, France
E-mail: [email protected]
(4) INRA, Unité EPHYSE - “Ecologie Fonctionnelle et Physique de l’Environnement” Site forêt-bois, 69 route d’Arcachon, 33 612 Cestas Cedex, France
E-mail: [email protected]
Key words: hidden semi-Markov chain; morphogenetic gradient; multiple change-point detec-tion; ontogeny; phase change.
Introduction
Observed growth, as given, for instance, by the length of successive annual shoots along the main axis of a plant, is mainly the result of two components: an ontogenetic component and an environmental component. We made the assumption of a decomposition model where the ontogenetic growth component and the environmental component (mainly of climatic origin) were combined in an additive manner. This relies on the fact that ontogeny generally has a longer term effect than time-varying environmental factors; see Barthélémy and Caraglio (2007).
A key question is whether the ontogenetic growth component along an axis (i.e. successive entities built by the same meristem) at the growth unit or annual shoot scale takes the form of a trend (i.e. a “long-term change in the mean level”) or of a succession of roughly stationary phases. The main variable of interest is the length of the entity but additional variables may be useful such as the number of growth units for polycyclic annual shoots or the number of branches when the branches can be considered as morphologically similar.
Materials
Two types of retrospective observation protocol should be distinguished: (i) A single or a few mature trees are measured. The data thus provide an overall picture of tree life but sufficient information is only available in the case of long and well-defined stationary phases. (ii) Only the most recent entities are measured in a sample of tree trunks. Sufficient information is available whatever be the length of the phases but only a few (possibly censored) phases can be studied in this way. In order to extract the ontogenetic growth component on the basis of a sample of short sequences corresponding to the most recent entities, it is thus necessary to mix climatic years within a given ontogenetic phase. Hence, sub-samples of trees corresponding to different age classes and growing under similar conditions should be observed.
Example 1 - Apical growth and branching in 70-year-old Corsican pines described at the annual shoot scale
Six trunks of approximately 70-year-old Corsican pines (Pinus nigra Arn. ssp. laricio Poir., Pinaceae) planted in two forest stands in the “Centre” region (France) were described by annual shoot (approximately the first 2 years not measured). These 6 trees were taken from two stands
with contrasting densities and correspond for each stand to three different diameter classes. Two quantitative variables were recorded for each annual shoot, namely length (in cm) and number of branches per tier. Hence, information from both the parent entity (length of the annual shoot) and the offspring entities (number of branches per tier) were combined in the measurements. Example 2 - Apical growth and branching in young Corsican pines described at the annual shoot scale
The data sample comprised four sub-samples of Corsican pine: 31 6-year-old trees, 29 12-year-old trees (first year not measured), 30 18-12-year-old trees (first year not measured) and 13 23-year-old trees (first 2 years not measured). Plantation density was 1800 stems/ha for the first sub-sample (6 year old) and 2200 stems/ha for the three other sub-samples. The observation protocol already described for the 70-year-old Corsican pines was applied to these young Corsican pines planted in the same forest.
Example 3 - Apical growth in Dicorynia guianensis described at the internode scale
A tree was described at the Paracou field station in a lowland tropical rain forest, near Sinnamary in French Guyana. This individual was selected according to its total main axis height and its apparent proper development (i.e. absence of damage) but no information was available concerning chronological age. The data consist of a sequence of 152 internode lengths taken from the base to the top of the main axis.
Methods for analyzing sequences
Various methods of analysis ranging from exploratory analysis (symmetric smoothing filters, sample autocorrelation functions) to statistical modeling (multiple change-point models and hidden semi-Markov chains) were applied to extract and characterize the ontogenetic growth component. Multiple change-point models (Guédon et al., 2007) are used to delimit segments within sequences for which the data characteristics are homogeneous within each segment while differing markedly from one segment to another. Hidden semi-Markov chains (HSMCs) (Gué-don, 2003) are particularly useful for analyzing homogeneous zones within sequences. Hidden semi-Markov chains generalize hidden Markov chains with the distinctive property of explicitly modeling the length of each zone. The structure of a hidden semi-Markov chain can be de-scribed as follows. The underlying semi-Markov chain represents both the succession of zones and the length of each zone while observation distributions attached to each state of the semi-Markov chain represent the values observed within a zone for each variable. It should be noted that both hidden semi-Markov chains and multiple change-point models with appropriate pa-rameterizations can be applied to multivariate sequences build from variables of heterogeneous types.
Multiple change-point models and hidden semi-Markov chains share the same segmentation objective. However, the main difference between these two families of models is that, while in the case of change-point models, the change points are model parameters to be estimated, in the case of hidden semi-Markov chains, the change points are recovered from the most probable state sequence computed on the basis of the observed sequence using the estimated model. Another difference is that a multiple change-point model applies to a single sequence while a “left-right” hidden semi-Markov chain (i.e. composed of a succession of transient states and a final absorbing state) requires a sample of sequences to be estimated accurately. Contrarily to multiple change-point models for which methods have been proposed for the selection of the number of change points, there is no model selection method with a firm mathematical basis for the selection of the number of states of a non-ergodic hidden Markovian model and empirical methods should be used.
Results
Multiple change-point models and hidden semi-Markov chains were applied to identify growth phases on different samples of Corsican pine tree trunks described at the annual shoot scale and
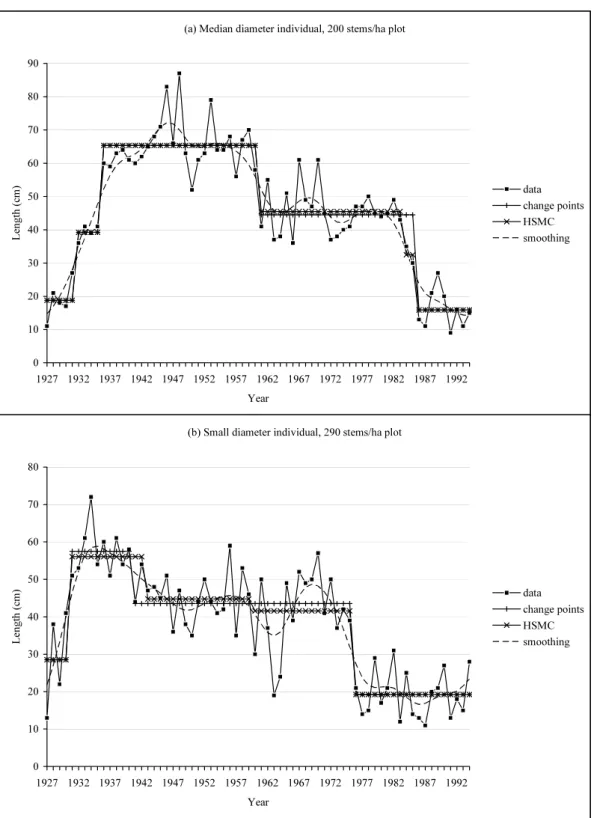
on the main axis of a Dicorynia guianensis described at the internode scale (and on supplemen-tary examples in Guédon et al. (2007)). A good agreement was noted between the segmentations obtained with multiple change-point models and hidden semi-Markov chain for the 70-year-old Corsican pines; see two individuals in Figure 1. Symmetric smoothing filters were also applied to extract trends in the 70-year-old Corsican pines. The results support the assumption of abrupt changes between roughly stationary phases rather than gradual changes; see Figures 1 and 2. It is important to note that phase identification accuracy is strongly related to phase length and to the magnitude of the change points that delimit the phase, the ideal situation being a long stationary phase delimited by two change points of high magnitude.
(a) Median diameter individual, 200 stems/ha plot
0 10 20 30 40 50 60 70 80 90 1927 1932 1937 1942 1947 1952 1957 1962 1967 1972 1977 1982 1987 1992 Year L ength ( cm ) data change points HSMC smoothing
(b) Small diameter individual, 290 stems/ha plot
0 10 20 30 40 50 60 70 80 1927 1932 1937 1942 1947 1952 1957 1962 1967 1972 1977 1982 1987 1992 Year Le ngt h ( cm) data change points HSMC smoothing (a) Median diameter individual, 200 stems/ha plot
0 10 20 30 40 50 60 70 80 90 1927 1932 1937 1942 1947 1952 1957 1962 1967 1972 1977 1982 1987 1992 Year L ength ( cm ) data change points HSMC smoothing
(b) Small diameter individual, 290 stems/ha plot
0 10 20 30 40 50 60 70 80 1927 1932 1937 1942 1947 1952 1957 1962 1967 1972 1977 1982 1987 1992 Year Le ngt h ( cm) data change points HSMC smoothing
According to the field observations, the first change point identified in the Dicorynia guia-nensis (Figure 2) corresponded approximately to the occurrence of the first offspring shoot while the second change point corresponded approximately to the beginning of a more intensive branching zone and these two change points corresponded most likely to an increase (by step of 2) in the number of leaflets. This latter point should be checked.
0 20 40 60 80 100 120 140 160 180 0 10 20 30 40 50 60 70 80 90 100 110 120 130 140 150 Internode rank Le ngth ( mm) data change points
Figure 2. Dicorynia guianensis: segmentation of the internode length sequence.
While it is often admitted that root installation or stratum change (this latter factor is par-ticularly relevant for the Dicorynia guianensis example) can induce an abrupt increase in the length of the entities, the ageing process is often viewed as a gradual decrease (called “drift”) in the length of the entities. Hence, identifying phase changes of high magnitude in 70-year-old Cor-sican pines when growth globally decreases is an unexpected result. We checked that the residual sequences, obtained by subtracting from each original sequence the step function deduced from the estimated multiple change-point model (Lavielle, 1998), were stationary and close to white noise sequences. We also checked that the change points corresponding to the decrease in shoot length of highest magnitude were not synchronized (see Figure 1), thus eliminating a purely cli-matic origin for these abrupt changes. We thus suspect that these phase changes are expressions of endogenous equilibriums. These results support the general botanical notion of “morpho-genetic gradient” but also highlight thresholds in plant architecture development (threshold of differentiation, see Barthélémy and Caraglio, 2007).
Perspectives
In the proposed approach, the climatic component was globally characterized as a roughly random stationary component but it may be interesting to study in detail the plant’s response to changing climatic conditions. Markov switching linear mixed models, i.e. models that combine linear mixed models in a Markovian manner, were introduced in Véra et al. (2004). These models belong to the family of hidden Markovian models. The underlying Markov chain represents the succession of growth phases while the linear mixed models attached to each state of the Markov
chain represent both the influence of explanatory variables (mainly climatic variables which are time-varying explanatory variables) and inter-individual heterogeneity due to unobserved factors such as plant pathogen infestation within a given growth phase. New developments and results of Markov switching linear mixed models are presented in Chaubert et al. (2007).
In the case where climatic data are not available, the climatic component could be modeled as synchronous fluctuations between individuals incorporating a random time effect in multiple change-point models or Markov switching models.
References
Chaubert, F., Caraglio, Y., Lavergne, C., Trottier, C. and Guédon, Y. (2007). A statis-tical model for analyzing jointly growth phases, the influence of environmental factors and inter-individual heterogeneity: Application to forest trees. In: 5th International Workshop on Functional-Structural Plant Models (FSPM07).
Barthélémy, D. and Caraglio, Y. (2007). Plant morphology and architecture: a dynamic, multi-level and comprehensive approach of plant form and ontogeny. Annals of Botany 99(3), 375-407. Guédon, Y. (2003). Estimating hidden semi-Markov chains from discrete sequences. Journal of Computational and Graphical Statistics, 12(3), 604-639.
Guédon, Y., Caraglio, Y., Heuret, P., Lebarbier, E. and Meredieu, C. (2007). Analyzing growth components in trees. To be published in Journal of Theoretical Biology.
Lavielle, M. (1998). Optimal segmentation of random processes. IEEE Transactions on Signal Processing, 46(5), 1365-1373.
Véra, C., Guédon, Y., Lavergne, C. and Caraglio, Y. (2004). Analysis of longitudinal data applied to plant architecture study In: 4th International Workshop on Functional-Structural Plant Models, Montpellier, 65-69.