HAL Id: hal-02407435
https://hal.sorbonne-universite.fr/hal-02407435
Submitted on 12 Dec 2019HAL is a multi-disciplinary open access
archive for the deposit and dissemination of sci-entific research documents, whether they are pub-lished or not. The documents may come from teaching and research institutions in France or abroad, or from public or private research centers.
L’archive ouverte pluridisciplinaire HAL, est destinée au dépôt et à la diffusion de documents scientifiques de niveau recherche, publiés ou non, émanant des établissements d’enseignement et de recherche français ou étrangers, des laboratoires publics ou privés.
The social Simon effect in the tactile sensory modality:
a negative finding
Alix Pérusseau-Lambert, Margarita Anastassova, Mehdi Boukallel, Mohamed
Chetouani, Ouriel Grynszpan
To cite this version:
Alix Pérusseau-Lambert, Margarita Anastassova, Mehdi Boukallel, Mohamed Chetouani, Ouriel Gryn-szpan. The social Simon effect in the tactile sensory modality: a negative finding. Cognitive Process-ing, Springer Verlag, 2019, 20 (3), pp.299-307. �10.1007/s10339-019-00911-4�. �hal-02407435�
1
T
HE SOCIAL
S
IMON EFFECT IN THE TACTILE SENSORY MODALITY
:
A
NEGATIVE
1
FINDING
2
Alix Pérusseau-Lambert1, 2, Margarita Anastassova2, Mehdi Boukallel2, Mohamed Chetouani1, Ouriel 3
Grynszpan1*
4
1
Sorbonne Université, CNRS, Institut des Systèmes Intelligents et de Robotique, ISIR, 4 place Jussieu, 75252
5
PARIS cedex 05, France
6
2
CEA, LIST, Sensorial and Ambient Interfaces Laboratory, 91191 – Gif-sur-Yvette CEDEX, France
7
*Corresponding author: Ouriel Grynszpan, [email protected], Tel: +33 (0) 1 44 27 63 69
8
Abstract:
9Objective: This study seeks to investigate whether users activate cognitive representations of their
10
partner’s action when they are involved in tactile collaborative tasks. 11
Background: The social Simon effect is a spatial stimulus-response interference induced by the mere
12
presence of a partner in a go/nogo task. It has been extensively studied in the visual and auditory 13
sensory modalities, but never before in the tactile modality. 14
Method: We compared the performances of 28 participants in three tasks: (i) a standard Simon task
15
where participants responded to two different tactile stimuli applied to their fingertips with either 16
their left or right foot, (ii) an individual go/nogo task where participants responded to only one 17
stimulus and (iii) a social go/nogo task where they again responded to only one stimulus, but were 18
partnered with another person who responded to the complementary stimulus. 19
Results: The interference effect due to spatial incongruence between the side where participants
20
received the stimulus and the foot used to answer increased significantly in the standard Simon task 21
compared to the social go/nogo task. Such a difference was not observed between the social and 22
individual go/nogo tasks. Performances were nevertheless enhanced in the social go/nogo task, but 23
irrespectively of the stimulus-response congruency. 24
Conclusion: This study is the first to report a negative result for the social Simon effect in the tactile
25
modality. Results suggest that cognitive representation of the co-actor is weaker in this modality. 26
2
Keywords: Tactile, Joint action, Interpersonal coordination, stimulus-response compatibility
27
I. I
NTRODUCTION28
Action performed jointly between two or more human partners has spurred much debate in the field 29
of cognitive sciences. Gallotti and Frith (2013) advocate for the existence of a specific mode of 30
functioning, which they called the “we-mode” (p. 160), that appears when individuals are involved in 31
collective actions. One of the core mechanisms that give rise to the “we-mode” is our spontaneous 32
tendency to be influenced by actions performed by co-actors. Sebanz, Knoblich and Prinz (2003) 33
reported an experiment that illustrated how one’s motor planning ability was affected by a co-actor’s 34
actions. It has become a prominent paradigm, referred to as the social or joint Simon effect, which 35
has been extensively used to study joint actions between two co-actors (Dittrich, Rothe, & Klauer, 36
2012; Iani, Anelli, Nicoletti, Arcuri, & Rubichi, 2011; Klempova & Liepelt, 2016; Kuhbandner, Pekrun, 37
& Maier, 2010; Liepelt, Wenke, & Fischer, 2013; Liepelt, Wenke, Fischer, & Prinz, 2011; Stenzel et al., 38
2012, 2014; Tsai & Brass, 2007; Vlainic, Liepelt, Colzato, Prinz, & Hommel, 2010; Welsh, 2009; Welsh 39
et al., 2013). It derives from the standard Simon task (Simon, 1969) that induces a spatial stimulus-40
response interference effect whereby participants respond faster to stimuli that are presented on 41
the same side as the limb they use to answer, even though the location of the stimuli is task-42
irrelevant. For instance, either a blue or green circle appears to the left or right of the participant 43
who is to press a key on her/his left for the green circle and a key on her/his right for the blue circle 44
(Hommel, Colzato, & van den Wildenberg, 2009). Participants’ response times will decrease when the 45
location of the stimulus is congruent with the location of the response key. This effect disappears if 46
participants are instructed to perform a simple go/nogo task where they respond to only one of the 47
two stimuli with a single key. The interference effect however reappears de novo when the 48
participant is partnered with another individual who responds to the alternative stimulus. The 49
partner’s action in this social go/nogo condition thus influences the participant’s motor planning. The 50
goal of the study reported here was to test whether this effect can still be observed when the stimuli 51
3 are delivered on the tactile sensory modality. This issue is expected to be highly relevant for the 52
design of collaborative tactile interfaces. 53
The social Simon effect has been shown to depend on the degree of perceived interdependence 54
between the co-actors (Colzato, de Bruijn, & Hommel, 2012; Iani et al., 2011; Ruys & Aarts, 2010). It 55
is enhanced when the co-actor is seen as friendly and cooperative compared to intimidating and 56
competitive (Hommel et al., 2009; Iani et al., 2011). The social Simon effect has been classically 57
explained by our spontaneous tendency to represent actions performed by others within our own 58
sensory-motor system (Sebanz et al., 2003; Sebanz, Knoblich, Prinz, & Wascher, 2006), although 59
alternative accounts emphasize the importance of the spatial arrangement of the two co-acting 60
partners with respect to the stimuli (Dittrich, Dolk, Rothe-Wulf, Klauer, & Prinz, 2013; Dittrich et al., 61
2012; Guagnano, Rusconi, & Umiltà, 2010) and the attention-grabbing events caused by the co-62
actor’s actions (Dolk, Hommel, Prinz, & Liepelt, 2013; Klempova & Liepelt, 2016). Despite the 63
different theoretical frameworks that are used to account for the effect, the social Simon effect has 64
been robustly reproduced across various settings and has been used in numerous imaging studies to 65
examine neural networks associated with joint action (Costantini et al., 2013; de la Asuncion, Docx, 66
Morrens, Sabbe, & de Bruijn, 2015; Dolk, Liepelt, Villringer, Prinz, & Ragert, 2012; Sebanz et al., 2006; 67
Sebanz, Rebbechi, Knoblich, Prinz, & Frith, 2007; Tsai, Kuo, Hung, & Tzeng, 2008). Yet, to our 68
knowledge, until now, experiments on the social Simon effect have always used either visual or 69
auditory stimuli, but have never been conducted in the tactile modality. 70
The small number of studies that implemented the standard Simon task in the tactile modality have 71
been consistent in reporting the expected interference effect. Hasbroucq and Guiard (1992) applied 72
mechanical taps on the index fingers and thumbs of the two hands and found shorter response times 73
when the stimulation was congruent with the hand with which participants had to answer. In the 74
study by Medina, McCloskey, Coslett and Rapp (2014), participants received vibrotactile stimuli on 75
their middle fingers and had to respond using foot pedals. They responded faster on trials where the 76
4 finger receiving the stimulus and the foot releasing the pedal were somatotopically congruent. 77
Salzer, Aisenberg, Oron-Gilad and Henik (2014) exerted vibrotactile stimulations on the left and right 78
part of the back of the torso. Once again, they observed an interference effect when participants had 79
to answer with the hand opposite to the side where they perceived the tactile stimulus. 80
In the present experiment, we applied vibrotactile stimulations on the index fingertips of 81
participants, who had to respond by pressing foot pedals. Following a classical experimental design 82
for studying the social Simon effect, we compared three tasks: (i) a standard Simon task where 83
participants received two different types of tactile vibration and had to respond with their two feet; 84
(ii) an individual go/nogo task where participants still received the two types of tactile vibration, but 85
responded to only one of them; (iii) a social go/nogo task where participants responded in the same 86
way as in the individual go/nogo task, while another person sitting next to them responded to the 87
complementary stimulus. We hypothesized that the congruency between the side where the 88
vibrotactile stimulation was applied and the foot with which participants had to respond would have 89
an effect on response times in the standard Simon task and in the social go/nogo task, but not in the 90
individual go/nogo task. Additionally, participants were administered the Autism-Spectrum Quotient 91
(AQ) questionnaire (Baron-Cohen, Wheelwright, Skinner, Martin, & Clubley, 2001), which assesses 92
Autism-Spectrum traits in the general population. This questionnaire provided a metric that we 93
intended to correlate with the amplitude of the hypothesized interference effect in the social Simon 94
go/nogo task. A previous study (Sebanz, Knoblich, Stumpf, & Prinz, 2005) reported that the social 95
Simon effect was unaltered in individuals with Autism Spectrum Disorder (ASD). However, given the 96
profound impairments in the ability to spontaneously represent others’ intentions in action that are 97
associated with ASD (Senju, Southgate, White, & Frith, 2009) and the theory linking the social Simon 98
effect to a spontaneous representation of others’ action (Sebanz et al., 2003, 2006), we tentatively 99
hypothesized a negative correlation between the social Simon effect and Autism-Spectrum traits 100
given the social nature of the experimental manipulation. 101
5
II. M
ETHODS102
II.1 Participants 103
Twenty-eight adults (14 males, 14 females) participated in the experiment. Their age range was 104
21 – 39 years with a mean of 27.4 years (SD = 5.1). A power analysis was performed prior to the 105
experiment to estimate the required minimum sample size based on data reported by former studies 106
(Hommel, Colzato, & van den Wildenberg, 2009; Liepelt, Wenke, Fischer, & Prinz, 2011). The 107
computation was carried out with the G*Power application (Faul, Erdfelder, Lang, & Buchner, 2007) 108
setting the significance threshold to 0.05 and the power to 0.9. It yielded a minimum sample size of 109
16. Participants were free of any known psychiatric or neurologic symptoms, non-corrected visual or 110
auditory deficits and recent use of any substance that could impede concentration. This research 111
complied with the tenets of the Declaration of Helsinki and was approved by the Institutional Review 112
Board at Université Paris-Descartes. Informed consent was obtained from each participant. 113
II.2 Material 114
The tactile stimulations were produced by two Linear Resonant Actuators (LRA) from Precision 115
MicroDrive™ that produced vibrations. The actuators were monitored with the National Instrument 116
Emission/ Acquisition cards (NI 9265 and NI 9205). The input signals were amplified and powered by 117
home-made electronic cards. The entire experimental systems was controlled with a home-made 118
program coded in the Python language. The LRAs were fixed on a table and positioned on an axis that 119
was parallel to the edge of the table. Participants would sit on a comfortable chair in front of the 120
table, in-between the two LRAs, and would place their right and left index fingertips on the LRA that 121
was on the same side as their hand. The vibrotactile stimuli were provided by a 205 Hz vibration of 122
either (a) 1.5μm displacement amplitude or (b) 3.7μm displacement amplitude. The vibration was 123
continuous and lasted 250ms. The 1.5μm amplitude vibration was referred to as the “low” stimulus 124
signal and the 3.7μm amplitude vibration was the “high” stimulus signal. Participants responded to 125
the tactile stimuli by pushing pedals that were located under the table. One pedal was on the left 126
6 side of the participant and the other one was on the right. Each pedal was associated with a given 127
vibration amplitude (either high or low) that was indicated on the pedal. The vibration noise was 128
totally eliminated by having participants wear a noise-cancelling headphones playing pink noise. 129
Hence, the sense of touch was the only sensory modality that participants could rely on to 130
discriminate between the two vibration amplitudes. 131
II.3 Procedure 132
Participants sat next to the experimenter who was on their left. A computer screen was placed on 133
the table in-between the participant and the experimenter. Instructions were provided verbally and 134
by writing. The written version was accessible throughout the experiment. Participants were 135
instructed to respond as fast as they could to the tactile stimuli. They had to place their feet 136
symmetrically with respect to their body. Their feet were separated by a distance equivalent to the 137
size of their hips or distance from shoulder to shoulder, according to what was the most natural 138
posture for them. The pedals were placed besides each one of their foot, either under it or next to it, 139
in the most comfortable and easy to reach positions for every individual participant. Participants 140
were then introduced the low and high stimuli on each LRA. For half of the participants, the “high” 141
pedal, which was to be pressed when perceiving a high stimulus, was on their right side, and the 142
“low” pedal on their left side. The reverse configuration was used for the other half of participants. 143
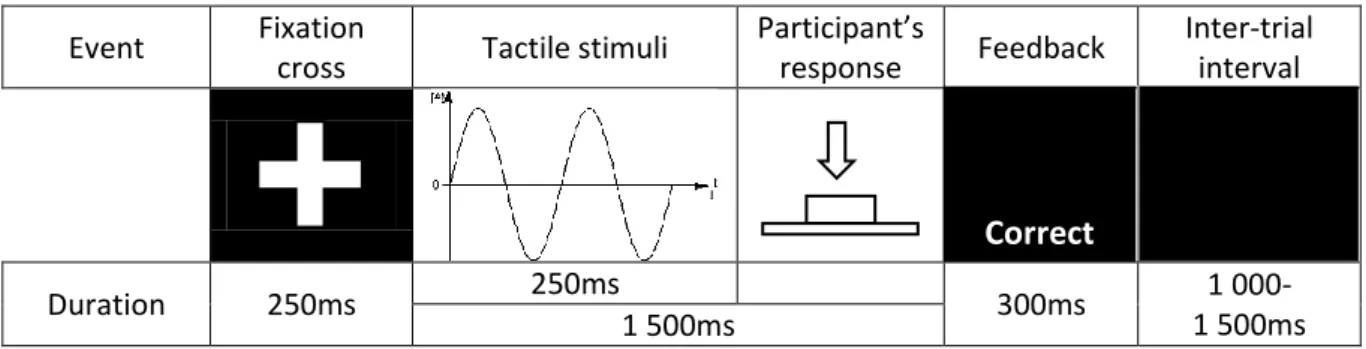
As in Salzer et al. (2014), each trial began with a fixation cross that was displayed at the center of 144
the screen for 250ms. When the fixation cross disappeared, one of the LRA delivered a vibrotactile 145
stimulus for 250ms. Once the vibrotactile stimulus began, participants had 1500ms to respond by 146
pressing one of the two pedals. After the participants’ response, a “Right” or “Wrong” feedback 147
message was displayed during 300ms. No feedback was provided if participants had not responded 148
fast enough. The feedback message was followed by a black screen that lasted until the next trial 149
began. The inter-trial interval duration varied randomly between 1000 and 1500ms. Figure 1 150
summarizes the event flow during a trial. 151
7
Correct
Event Fixation
cross Tactile stimuli
Participant’s response Feedback Inter-trial interval Duration 250ms 250ms 300ms 1 000-1 500ms 1 500ms
Figure 1: Flow of sequential events that occur during a trial
152
The experiment was composed of 5 blocks that were separated by short breaks. The first block was 153
used to train participants in perceiving the two different vibrotactile stimulations. It contained 60 154
trials that were not included in the analyses. The four following blocks comprised 120 trials each and 155
were used to collect experimental data, that is, reaction time and accuracy (number of errors). The 156
Reaction Time was measured from the stimulus onset until the participant’s response. During each 157
block, the LRAs produced an equal number of low and high amplitude stimuli that were equally 158
distributed on the left and on the right. The left/right positions and low/high amplitudes of the 159
stimuli were randomly allocated. As explained above, participants were to respond to the low or high 160
stimuli with either their left foot or right foot depending on where the low and high pedals had been 161
placed. When the stimulus appeared on the same side as the pedal to be pressed, the trial was said 162
to be congruent. It was incongruent when the stimulus appeared on the opposite side. 163
The four experimental blocks presented three different tasks: One block was dedicated to the 164
standard Simon task, one block to the individual go/nogo task and two blocks for the social go/nogo 165
task. To neutralize the effect of the tasks’ order, their sequential order was counterbalanced across 166
participants using the Latin Square method. As there were three tasks, there were six possible 167
counterbalancing sequences and similar numbers of participants were allotted to each possible 168
sequence (4 to 6 participants per sequence). 169
In the standard Simon task, participants had to respond to the two amplitudes of vibration stimuli 170
(high and low) by pressing the matching pedal. In the individual and social go/nogo tasks, participants 171
would either respond exclusively to the low amplitude stimuli for the first 60 trials of each block and 172
8 to the high amplitude stimuli for the next 60 trials, or they would respond first to the high amplitude 173
stimuli and then to the low amplitude stimuli. The order in which participants were to respond to 174
vibration amplitudes was counterbalanced across participants. The position of the pedal which they 175
had to press was also counterbalanced across participants. 176
The only difference between the individual go/nogo condition and the social go/nogo condition 177
was that the experimenter took part in the task during the social go/nogo condition. In the latter 178
condition, the experimenter responded to the amplitude of the vibration stimuli that the participant 179
was asked not to respond to. For instance, if the participant had to respond to the low amplitude 180
stimuli, the experimenter responded to the high amplitude stimuli and vice versa. The instructions 181
explicitly specified that the participant and the experimenter were to cooperate in performing the 182
task. The experimenter placed her fingertips on a second set of LRAs that reproduced the vibrotactile 183
stimuli sent to the participant. The experimenter used the same foot as the participant to press the 184
response pedal. The experimenter was the same for all participants. As she was a female, the 185
participant’s gender was taken into account in the statistical analysis. The experimenter was required 186
to respond evenly with every participants and not adjust to the participants’ performances. 187
9 Standard Simon 189 190 191 192 193 194 Individual Go/nogo 195 196 197 198 199 Social Go/nogo 200 201 202 203 204 205
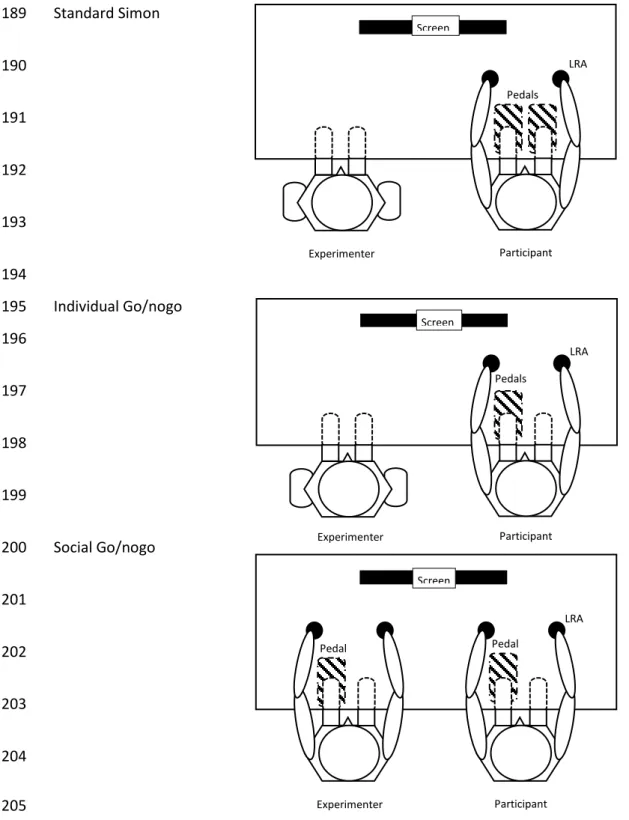
Figure 2: Upper view of the experimental setups for the three tasks. In each task, the participant received two tactile stimuli
206
from two LRA. Top: standard Simon task: The participant responded to two stimuli with two pedals; Middle: Individual
207
go/nogo task: The participant responded to only one stimulus with one pedal; Bottom: Social go/nogo task: The
208
experimenter and the participant each responded to a different stimuli with one pedal. The position of the response pedal in
209
the individual and social go/nogo tasks was counterbalanced across participants.
210
LRA : Linear Resonant Actuator
211 LRA Screen Pedals Experimenter Participant LRA Screen Pedals Participant Experimenter LRA Screen Pedal Experimenter Participant Pedal
10 At the end of the experiment, participants were asked to fill in the Autism-Spectrum Quotient (AQ) 212
questionnaire (Baron-Cohen et al., 2001). The AQ is a psychometric instrument used screen autistic-213
like traits in the general population. The AQ focuses on questions related to social and 214
communicative skills, imagination and flexibility. 215
III. R
ESULTS216
Response times and error were analyzed using repeated measures analyses of variance (ANOVA) 217
with participants’ gender as an adjustment factor to account for possible effects due to the fact that 218
the experimenter was always a female. Three ANOVA were conducted for each measure. Every 219
ANOVA had two within factors: the experimental task and the congruency of the trial. Congruent 220
trials were those where the stimulus appeared on the same side as the response pedal. Incongruent 221
trials were those where the stimulus appeared on the opposite side. 222
The experimental design included three tasks: the standard Simon task, the individual go/nogo task 223
and the social go/nogo task. To test whether there was a social Simon effect, we performed one 224
ANOVA that compared the social go/nogo task with the individual go/nogo task and another ANOVA 225
comparing the social go/nogo task with the standard Simon task. The social Simon effect entailed 226
that congruency would affect response times and errors in the standard Simon task and the social 227
go/nogo task, while it would not in the individual go/nogo task. We therefore hypothesized that the 228
ANOVA comparing the social go/nogo task with the individual go/nogo task would yield an 229
interaction between the task and congruency factors, but that no such interaction would be 230
observed in the ANOVA comparing the social go/nogo task with the standard Simon task. Poshoc t-231
test were performed using the Tukey procedure. The analyses were carried out with Statistica 232
software (www.statsoft.com). 233
Although the sequential order of the tasks had been counterbalanced across participants, we tested 234
for a possible order effect by adding an additional adjustment factor representing the order in which 235
tasks had been administered. Yet, the tasks’ order did not yield any significant differences except for 236
11 the percentage of errors in the ANOVA comparing the social go/nogo task with the standard Simon 237
task and, even in this case, this additional adjustment factor did not change the pattern of results. 238
Hence, to facilitate readability, we did not include this additional factor in the analyses presented 239
below. 240
III.1 Number of errors 241
We computed the percentage of erroneous trials in each task. A trial was considered erroneous 242
when the participant pressed the wrong pedal. There were generally few errors and thus the 243
distribution of the percentage of errors was skewed towards zero. To normalize the distribution, we 244
used a Box Cox transformation (Sakia, 1992) before applying the ANOVA. The ANOVA comparing the 245
individual go/nogo task with the social go/nogo task did not yield any significant main effect, nor 246
interaction between task and congruency, F(1,26) = 0.52, p = 0.48, p² = 0.02 . The ANOVA comparing
247
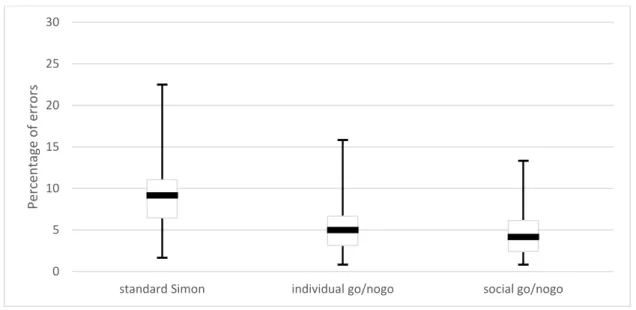
the standard Simon task with the social go/nogo task revealed a significant main effect of task, 248
F(1,26) = 16.08, p < 0.001, p² = 0.38. There were more errors in the standard Simon task
249
(median = 9.17%, interquartile range = 4.58%) than in the social go/nogo task (median = 4.17%, 250
interquartile range = 3.75%). There was no main effect of congruency, nor interaction between 251
congruency and task. The number of errors in each block is plotted in Figure 3. 252
253 254
12 255
Figure 3: The percentage of erroneous trials in each experimental tasks. As the distribution of data was not normal, boxplots
256
were used to represent the median (horizontal bold lines), the 25th and 75th percentiles (boxes) and the minimum and
257
maximum values (error bars)
258
III.2 Response Time 259
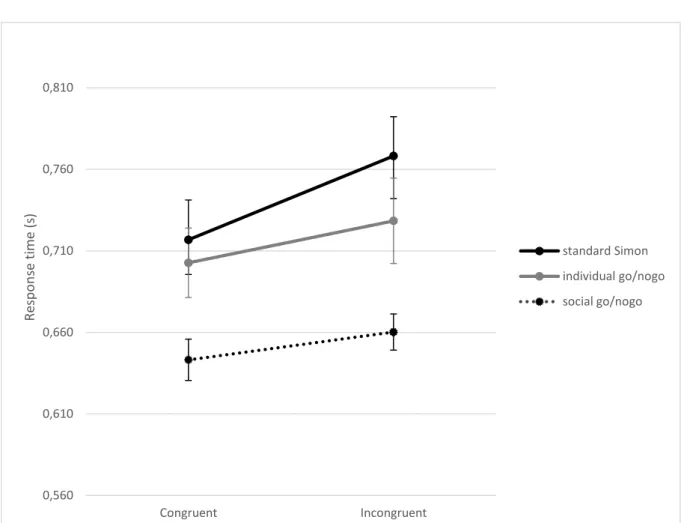
The ANOVA comparing the individual go/nogo task with the social go/nogo task yielded main effects 260
for the task factor, F(1,26) = 14.61 p < 0.001 ² = 0.36, and the congruency factor, F(1,26) = 6.15 261
p = 0.02 ² = 0.19. Response times were longer in the individual go/nogo task (mean = 716ms,
262
SE = 23ms) than in the social go/nogo task (mean = 652ms, SE = 11ms). Responses were shorted in 263
the congruent trials (mean = 673ms, SE = 16ms) compared to the incongruent trials (mean = 694ms, 264
SE = 17ms). The interaction between task and congruency was not significant, F(1,26) = 0.258 265
p = 0.62 ² < 0.01. The ANOVA comparing the standard Simon task with the social go/nogo task
266
showed main effects for task, F(1,26) = 19.71 p < 0.001 ² = 0.43, and congruency, F(1,26) = 14.62 267
p < 0.001 ² = 0.36. There was also an interaction between task and congruency, F(1,26) = 15.92
268
p < 0.001 ² = 0.38. The increase of response times due to congruency was larger in the standard
269
Simon task (congruent: mean = 717ms, SE = 24ms; incongruent: mean = 768ms, SE = 24ms) than in 270
the social go/nogo task (congruent: mean = 643ms, SE = 13ms; incongruent: mean = 660ms, 271
SE = 11ms). Post-hoc t-test showed that the difference between congruent and incongruent trials 272
was significant in each task (all p < 0.05). Response time data are shown in Figure 4. 273 0 5 10 15 20 25 30
standard Simon individual go/nogo social go/nogo
Perc en ta ge o f erro rs
13 274
275 276
277
Figure 4: Response times for congruent and incongruent trials in the three experimental tasks. Error bars represent standard
278
errors
279 280
III.3 Correlations with Autism-Spectrum Quotient (AQ) scores 281
As explained earlier, we additionally sought to test whether the amplitude of the social Simon effect 282
would correlate with AQ scores. The AQ scores of the participants ranged from 7 to 35 (the maximum 283
possible score is 50) with a mean of 18.2 (SD = 6.9). The amplitude of the social Simon effect was 284
computed as the difference between response times in the incongruent and congruent trials. 285
Pearsons’ correlation coefficients were not significant: r = -0.03 p = 0.89. 286 0,560 0,610 0,660 0,710 0,760 0,810 Congruent Incongruent Re sp o n se time (s ) standard Simon individual go/nogo social go/nogo
14 III.4 Correlations with the experimenter’s response times
287
Given the unexpected shorter response times in the social go/nogo task, we conducted further 288
analyses to qualify the effect of the partnership. We correlated the response times of the 289
experimenter with those of the participants during this task. Pearson’s correlation was significant, 290
r = 0.87 p < 0.001. We also verified whether there were significant differences in response times 291
between the experimenter and the participants during the social go/nogo task with a Student t-test. 292
The difference was not significant, t(27) = 1.74 p = 0.09. 293
IV. D
ISCUSSION294
The results of the present study confirmed the existence of a Simon effect for tactile stimulations, 295
but they did not support our hypothesis of a reappearance of this effect when the action was 296
distributed between two partners. Participants responded faster to congruent trials than to 297
incongruent trials in the standard Simon task where they had to react to the two different 298
vibrotactile amplitudes. When comparing the individual and social versions of the go/nogo task 299
where participants responded to only one vibrotactile amplitude, we did not find the expected 300
difference in the effect of congruency. By contrast, the effect of congruency was superior in the 301
standard Simon condition compared to the social go/nogo condition. In other words, the influence of 302
congruency was reduced in the social go/nogo task to a degree that was not dissimilar to the 303
individual go/nogo task. Response times thus showed patterns that were opposite to what the social 304
Simon effect predicted. Given that our study was dimensioned according to previous studies carried 305
out with visual stimuli, this outcome tentatively suggests that the social Simon effect may depend on 306
the sensory modality of the stimuli. If so, a reduced social Simon effect in the tactile modality is not 307
well accounted for by the current theories explaining this effect. It may be that representing another 308
person’s action within one’s own sensory-motor system (Sebanz et al., 2003) or response coding 309
scheme (Dittrich, Bossert, Rothe-Wulf, & Klauer, 2017; Dolk et al., 2013) does not spontaneously 310
occur when stimulations are in the tactile sensory modality. The sense of touch is contingent on 311
one’s local skin contact with an object. It is therefore more personal and does not yield a sensory 312
15 environment that can be straightforwardly shared. In the social go/nogo task of our experiment, the 313
two partners received the same vibrotacile stimulations, but they originated from different (although 314
identical) sources. The lack of shared sensory space may have hindered the natural tendency of 315
participants to activate sensory-motor representations of their partner’s actions. This interpretation 316
is consistent with neural imaging evidence that emphasize the important role of shared attention 317
mechanisms in the social Simon effect (Costantini et al., 2013). 318
The Autism-Spectrum Quotient (AQ) did not correlate with the response time difference between the 319
incongruent and congruent trials in the social go/nogo condition. This result is not surprising given 320
the absence of a social Simon effect. 321
Despite the absence of the expected social Simon interference, the social go/nogo condition did have 322
an effect: Performances increased independently of the congruency of the stimuli, as shown by the 323
reduced response times in the social go/nogo task compared to the standard Simon and individual 324
go/nogo tasks. This decrease in response times did not come at the expense of accuracy. The 325
percentage of erroneous trials was actually lower in the social go/nogo task compared to the 326
standard Simon task. 327
One could argue that participants could have used a strategy whereby they relied on the 328
experimenter’s responses, that is, responding only when the experimenter did not respond and 329
inhibiting their response when the experimenter responded. Such a strategy entails that participants 330
would have been waiting for the experimenter’ response, or lack of response, before they would 331
initiate a response. If this was the case, then their response times would be superior to the upper 332
range of the experimenter’s response times. However, response times of the participants were not 333
significantly different from those of the experimenter. Additionally, waiting for the experimenter’s 334
response should have increased the cognitive load of the social go/nogo task compared to the 335
individual go/nogo task, which seems at odds with the fact that processing time was actually reduced 336
in the social go/nogo task. 337
16 Altogether, the data showed that performing the task with a partner boosted performances. A 338
similar result was reported in the study on the social Simon effect by Liepelt et al. (2011). The 339
performance boost observed in our experiment cannot be merely attributed by the attendance of 340
another person alongside the participant. Indeed, the experimenter sat next to the participants in 341
every experimental conditions. The only variation introduced by the social go/nogo condition was 342
that the experimenter took part in the task. The enhancing effect on performances in this condition 343
may be explained by the classical effect of social facilitation induced by engaging in the same activity 344
as a partner (Zajonc, 1965). Additionally, the response times of the participants correlated with those 345
of the experimenter. The participants and the experimenter thus appeared to have adjusted their 346
processing time when performing the task as partners. This observation tends to support the view of 347
social facilitation induced by the partnership. 348
In the present experiment, as participants were partnered with the experimenter in the social 349
go/nogo task, they may have considered her as a reference that they should try to match. This could 350
explain why their performances were boosted in the social go/nogo condition. Further research 351
would be warranted to verify whether or not the observed enhancement of performances in the 352
social go/nogo task would have also occurred if the partner had been another randomly selected 353
participant. Despite this limitation, the present study contributes to the current knowledge on joint 354
action by indicating that the social Simon effect may be hindered when the stimulations are in the 355
tactile modality. This outcome suggests that coordination between co-actors might be challenging in 356
this modality as their natural tendency to activate sensory-motor representations of their partner’s 357
actions could to be less spontaneous than in other modalities. We tentatively attributed this failure 358
to a lack of shared sensory space. This hypothesis could be tested by future experiments in which the 359
tactile stimulations would be provided to the two partners via the same vibrotactile devices. 360
Conflict of Interest: The authors declare that they have no conflict of interest.
17
Ethical approval: All procedures performed in studies involving human participants were in
362
accordance with the ethical standards of the institutional and/or national research committee and 363
with the 1964 Helsinki declaration and its later amendments or comparable ethical standards. 364
Informed consent was obtained from all individual participants included in the study. 365
REFERENCES
366
Baron-Cohen, S., Wheelwright, S., Skinner, R., Martin, J., & Clubley, E. (2001). The Autism-Spectrum 367
Quotient (AQ): Evidence from Asperger Syndrome/High-Functioning Autism, Malesand 368
Females, Scientists and Mathematicians. Journal of Autism and Developmental Disorders, 369
31(1), 5–17. https://doi.org/10.1023/A:1005653411471 370
Colzato, L. S., de Bruijn, E. R. A., & Hommel, B. (2012). Up to “Me” or Up to “Us”? The Impact of Self-371
Construal Priming on Cognitive Self-Other Integration. Frontiers in Psychology, 3. 372
https://doi.org/10.3389/fpsyg.2012.00341 373
Costantini, M., Vacri, A. D., Chiarelli, A. M., Ferri, F., Romani, G. L., & Merla, A. (2013). Studying social 374
cognition using near-infrared spectroscopy: the case of social Simon effect. Journal of 375
Biomedical Optics, 18(2), 025005. https://doi.org/10.1117/1.JBO.18.2.025005 376
de la Asuncion, J., Docx, L., Morrens, M., Sabbe, B., & de Bruijn, E. R. A. (2015). Neurophysiological 377
evidence for diminished monitoring of own, but intact monitoring of other’s errors in 378
schizophrenia. Psychiatry Research, 230(2), 220–226. 379
https://doi.org/10.1016/j.psychres.2015.08.043 380
Dittrich, K., Bossert, M.-L., Rothe-Wulf, A., & Klauer, K. C. (2017). The joint flanker effect and the joint 381
Simon effect: On the comparability of processes underlying joint compatibility effects. The 382
Quarterly Journal of Experimental Psychology, 70(9), 1808–1823. 383
https://doi.org/10.1080/17470218.2016.1207690 384
18 Dittrich, K., Dolk, T., Rothe-Wulf, A., Klauer, K. C., & Prinz, W. (2013). Keys and seats: Spatial response 385
coding underlying the joint spatial compatibility effect. Attention, Perception, & 386
Psychophysics, 75(8), 1725–1736. https://doi.org/10.3758/s13414-013-0524-z 387
Dittrich, K., Rothe, A., & Klauer, K. C. (2012). Increased spatial salience in the social Simon task: A 388
response-coding account of spatial compatibility effects. Attention, Perception, & 389
Psychophysics, 74(5), 911–929. https://doi.org/10.3758/s13414-012-0304-1 390
Dolk, T., Hommel, B., Prinz, W., & Liepelt, R. (2013). The (not so) social Simon effect: a referential 391
coding account. Journal of Experimental Psychology: Human Perception and Performance, 392
39(5), 1248. 393
Dolk, T., Liepelt, R., Villringer, A., Prinz, W., & Ragert, P. (2012). Morphometric gray matter 394
differences of the medial frontal cortex influence the social Simon effect. NeuroImage, 61(4), 395
1249–1254. https://doi.org/10.1016/j.neuroimage.2012.03.061 396
Faul, F., Erdfelder, E., Lang, A.-G., & Buchner, A. (2007). G*Power 3: A flexible statistical power 397
analysis program for the social, behavioral, and biomedical sciences. Behavior Research 398
Methods, 39(2), 175–191. https://doi.org/10.3758/BF03193146 399
Gallotti, M., & Frith, C. D. (2013). Social cognition in the we-mode. Trends in Cognitive Sciences, 17(4), 400
160–165. https://doi.org/10.1016/j.tics.2013.02.002 401
Guagnano, D., Rusconi, E., & Umiltà, C. A. (2010). Sharing a task or sharing space? On the effect of 402
the confederate in action coding in a detection task. Cognition, 114(3), 348–355. 403
https://doi.org/10.1016/j.cognition.2009.10.008 404
Hasbroucq, T., & Guiard, Y. (1992). The effects of intensity and irrelevant location of a tactile 405
stimulation in a choice reaction time task. Neuropsychologia, 30(1), 91–94. 406
https://doi.org/10.1016/0028-3932(92)90017-G 407
Hommel, B., Colzato, L. S., & van den Wildenberg, W. P. M. (2009). How Social Are Task 408
Representations? Psychological Science, 20(7), 794–798. https://doi.org/10.1111/j.1467-409
9280.2009.02367.x 410
19 Iani, C., Anelli, F., Nicoletti, R., Arcuri, L., & Rubichi, S. (2011). The role of group membership on the 411
modulation of joint action. Experimental Brain Research, 211(3–4), 439. 412
https://doi.org/10.1007/s00221-011-2651-x 413
Klempova, B., & Liepelt, R. (2016). Do you really represent my task? Sequential adaptation effects to 414
unexpected events support referential coding for the joint Simon effect. Psychological 415
Research, 80(4), 449–463. https://doi.org/10.1007/s00426-015-0664-y 416
Kuhbandner, C., Pekrun, R., & Maier, M. A. (2010). The role of positive and negative affect in the 417
“mirroring” of other persons’ actions. Cognition and Emotion, 24(7), 1182–1190. 418
https://doi.org/10.1080/02699930903119196 419
Liepelt, R., Wenke, D., & Fischer, R. (2013). Effects of feature integration in a hands-crossed version 420
of the Social Simon paradigm. Psychological Research, 77(2), 240–248. 421
https://doi.org/10.1007/s00426-012-0425-0 422
Liepelt, R., Wenke, D., Fischer, R., & Prinz, W. (2011). Trial-to-trial sequential dependencies in a social 423
and non-social Simon task. Psychological Research, 75(5), 366–375. 424
https://doi.org/10.1007/s00426-010-0314-3 425
Medina, J., McCloskey, M., Branch, H., & Rapp, B. (2014). Somatotopic representation of location: 426
Evidence from the Simon effect. Journal of Experimental Psychology: Human Perception and 427
Performance, 40(6), 2131–2142. https://doi.org/10.1037/a0037975 428
Ruys, K. I., & Aarts, H. (2010). When competition merges people’s behavior: Interdependency 429
activates shared action representations. Journal of Experimental Social Psychology, 46(6), 430
1130–1133. https://doi.org/10.1016/j.jesp.2010.05.016 431
Salzer, Y., Aisenberg, D., Oron-Gilad, T., & Henik, A. (2014). In Touch With the Simon Effect *The first 432
two authors contributed equally. Experimental Psychology, 61(3), 165–179. 433
https://doi.org/10.1027/1618-3169/a000236 434
Sebanz, N., Knoblich, G., & Prinz, W. (2003). Representing others’ actions: just like one’s own? 435
Cognition, 88(3), B11–B21. https://doi.org/10.1016/S0010-0277(03)00043-X 436
20 Sebanz, N., Knoblich, G., Prinz, W., & Wascher, E. (2006). Twin Peaks: An ERP Study of Action
437
Planning and Control in Coacting Individuals. Journal of Cognitive Neuroscience, 18(5), 859– 438
870. https://doi.org/10.1162/jocn.2006.18.5.859 439
Sebanz, N., Knoblich, G., Stumpf, L., & Prinz, W. (2005). Far from action-blind: Representation of 440
others’ actions in individuals with Autism. Cognitive Neuropsychology, 22(3–4), 433–454. 441
https://doi.org/10.1080/02643290442000121 442
Sebanz, N., Rebbechi, D., Knoblich, G., Prinz, W., & Frith, C. D. (2007). Is it really my turn? An event-443
related fMRI study of task sharing. Social Neuroscience, 2(2), 81–95. 444
https://doi.org/10.1080/17470910701237989 445
Senju, A., Southgate, V., White, S., & Frith, U. (2009). Mindblind eyes: an absence of spontaneous 446
theory of mind in Asperger syndrome. Science (New York, N.Y.), 325(5942), 883–885. 447
https://doi.org/10.1126/science.1176170 448
Simon, J. R. (1969). Reactions toward the source of stimulation. Journal of Experimental Psychology, 449
81(1), 174. 450
Stenzel, A., Chinellato, E., Tirado, A., del Pobil, Á. P., Lappe, M., & Liepelt, R. (2012). When humanoid 451
robots become human-like interaction partners: Corepresentation of robotic actions. Journal 452
of Experimental Psychology: Human Perception and Performance, 38(5), 1073–1077. 453
https://doi.org/10.1037/a0029493 454
Stenzel, A., Dolk, T., Colzato, L. S., Sellaro, R., Hommel, B., & Liepelt, R. (2014). The joint Simon effect 455
depends on perceived agency, but not intentionality, of the alternative action. Frontiers in 456
Human Neuroscience, 8. https://doi.org/10.3389/fnhum.2014.00595 457
Tsai, C.-C., & Brass, M. (2007). Does the Human Motor System Simulate Pinocchio’s Actions?: 458
Coacting With a Human Hand Versus a Wooden Hand in a Dyadic Interaction. Psychological 459
Science, 18(12), 1058–1062. https://doi.org/10.1111/j.1467-9280.2007.02025.x 460
21 Tsai, C.-C., Kuo, W.-J., Hung, D. L., & Tzeng, O. J. L. (2008). Action Co-representation is Tuned to Other 461
Humans. Journal of Cognitive Neuroscience, 20(11), 2015–2024. 462
https://doi.org/10.1162/jocn.2008.20144 463
Vlainic, E., Liepelt, R., Colzato, L. S., Prinz, W., & Hommel, B. (2010). The Virtual Co-Actor: The Social 464
Simon Effect does not Rely on Online Feedback from the Other. Frontiers in Psychology, 1. 465
https://doi.org/10.3389/fpsyg.2010.00208 466
Welsh, T. N. (2009). When 1+1=1: The unification of independent actors revealed through joint 467
Simon effects in crossed and uncrossed effector conditions. Human Movement Science, 468
28(6), 726–737. https://doi.org/10.1016/j.humov.2009.07.006 469
Welsh, T. N., Kiernan, D., Neyedli, H. F., Ray, M., Pratt, J., Potruff, A., & Weeks, D. J. (2013). Joint 470
Simon Effects in Extrapersonal Space. Journal of Motor Behavior, 45(1), 1–5. 471
https://doi.org/10.1080/00222895.2012.746635 472
Zajonc, R. B. (1965). Social Facilitation. Science, 149(3681), 269–274. 473
474 475