ORIGINAL PAPER
Melanin-based colorations signal strategies to cope with poor
and rich environments
A. Roulin&J. Gasparini&P. Bize&M. Ritschard&
H. Richner
Received: 12 June 2007 / Revised: 17 August 2007 / Accepted: 23 August 2007 / Published online: 21 September 2007
# Springer-Verlag 2007
Abstract One hypothesis for the maintenance of genetic variation states that alternative genotypes are adapted to different environmental conditions (i.e., genotype-by-environment interaction G×E) that vary in space and time. Although G×E has been demonstrated for morphological traits, little evidence has been given whether these G×E are associated with traits used as signal in mate choice. In three wild bird species, we investigated whether the degree of melanin-based coloration, a heritable trait, covaries with nestling growth rate in rich and poor environments. Variation in the degree of reddish-brown phaeomelanism is pronounced in the barn owl (Tyto alba) and tawny owl (Strix aluco), and variation in black eumelanism in the barn owl and Alpine swift (Apus melba). Melanin-based
color-ation has been shown to be a criterion in mate choice in the barn owl. We cross-fostered hatchlings to test whether nestlings sired by parents displaying melanin-based color-ations to different extent exhibit alternative growth trajec-tories when raised by foster parents in poor (experimentally enlarged broods) and rich (experimentally reduced broods) environments. With respect to phaeomelanism, barn owl and tawny owl offspring sired by redder parents grew more rapidly in body mass only in experimentally reduced broods. With respect to eumelanism, Alpine swift offspring of darker fathers grew their wings more rapidly only in experimentally enlarged broods, a difference that was not detected in reduced broods. These interactions between parental melanism and offspring growth rate indicate that individuals display substantial plasticity in response to the rearing environment which is associated with the degree of melanism: at least with respect to nestling growth, phaeomelanic and eumelanic individuals are best adapted to rich and poor environments, respectively. It now remains to be investigated why eumelanism and phaeomelanism have a different signaling function and what the lifelong consequences of these melanism-dependent allocation strategies are. This is important to fully appraise the role played by environmental heterogeneity in maintaining variation in the degree of melanin-based coloration. Keywords Genetic variation .
Genotype-by-environment interaction . Growth . Melanin-based coloration .
Phenotypic plasticity . Strategy . Stress
Introduction
Theoretical models for polygenic traits have confirmed that environmental heterogeneity can maintain genetic variation
Communicated by K. McGraw A. Roulin (*)
:
J. GaspariniDepartment of Ecology and Evolution, University of Lausanne, Biophore, 1015 Lausanne, Switzerland e-mail: [email protected] J. Gasparini
e-mail: [email protected] P. Bize
Division of Environmental and Evolutionary Biology, Graham Kerr Building, Glasgow University, Glasgow G12 8QQ, UK
e-mail: [email protected] M. Ritschard
:
H. RichnerDivision of Evolutionary Ecology, Baltzerstrasse 6, University of Bern, Zoology Institute,
3012 Bern, Switzerland M. Ritschard
e-mail: [email protected] H. Richner
if the relative rank ordering of fitness of different individuals changes across environments (Levene 1953; Gillespie and Turelli 1989; Kassen 2002; Kawecki and Ebert2004; Spichtig and Kawecki 2004; Byers 2005; but see Prout and Savolainen1996). These models showed that genetic variation can be maintained if morphs are adapted to different environmental conditions with each genotype showing a different phenotypic response to an environ-mental gradient (i.e., genotype-by-environment interaction; hereafter denoted G×E). This hints that alternative geno-types are either adapted to specific environmental con-ditions inducing them to occupy different habitats where these specific environmental conditions prevail (Ravigné et al. 2004), or genotypes occupy the same habitat but perform differently over time if these specific conditions vary temporarily (review in Kassen 2002). G×E can thus promote adaptation to heterogeneous environments (Via and Lande 1985). It follows from these models that a paramount step to understanding the maintenance of non-neutral genetic variation is to investigate reaction norms of different genotypes, i.e., G×E. Although G×E has been empirically demonstrated for morphological traits (e.g. Merilä and Fry 1998; Sgrò and Hoffmann 2004), little evidence has been given on the possibility that these G×E are associated with sexually selected traits. This is an important question because if differently ornamented individuals perform the best in different environments, sexual selection exerted on ornamentation may be context-dependent. Sexual selection may thus not always be directional where all individuals mating preferentially with members of the other sex displaying an ornament to a similar extravagant value.
Variation in coloration is frequent in vertebrates and often is naturally or sexually selected (e.g. Majerus 1998; Andersson1994). Of particular interest are traits for which variation is due to the deposition of melanin pigments because variation in the degree of melanism is usually heritable and correlated with morphological, physiological, reproductive, and behavioral parameters (e.g., Jawor and Breitwisch2003; Roulin2004a). Given that individuals are often nonrandomly distributed among habitats with respect to melanism (e.g., Majerus 1998; Nachman et al. 2003; Roulin 2004a), it is yet unclear whether individuals displaying alternative colorations perform differently be-cause they live in different environments, bebe-cause they have a different genotypic background, or because these two factors interact (G×E). Correlative evidence consistent with G×E has been provided in a few species by examining whether the sign and magnitude of covariation between coloration and other phenotypic attributes depends on other factors such as year, wind, season, vegetation type, temperature, or social context (Ahnesjö and Forsman 2003; Roulin 2004a; Svensson et al. 2001). Although
spatial and temporal variation in environmental conditions can alter the sign and magnitude of covariation between coloration and life history, behavioral or physiological traits, an experimental approach is necessary to test this hypothesis. A key experiment is where an environmental factor is modified, for example, by artificially generating rich and poor environments, and where the performance of the differently colored individuals is measured in both environments to test whether they are adapted to distinct environmental conditions. If this is the case, the degree of melanism may signal different phenotypic qualities adap-ted to alternative environments, and thus be sexually selected.
In the present study, we report such an experiment in three bird species, the barn owl (Tyto alba), the tawny owl (Strix aluco), and the Alpine swift (Apus melba). They exhibit phaeomelanic (continuous variation in the degree of reddish-brownness; barn owl and tawny owl) and eumelanic (continuous variation in blackness; barn owl and Alpine swift) color traits. The expression of melanin-based coloration is heritable with h2 being 0.81 (phaeomelanism) and 0.65 (eumelanism) in the barn owl (Roulin and Dijkstra 2003), 1.0 in the tawny owl (unpublished data), and 0.78 in the Alpine swift (Bize et al. 2006a). Previous studies in these bird species have reported associations between melanin-based coloration and several life history traits. Yet, because the sign and magnitude of these associations can vary from year to year and between habitats (e.g., Roulin et al.2003a, b, 2004a), one hypothesis is that differently colored individuals are adapted to alternative environmental con-ditions. To generate rich and poor environments, we manipulated brood sizes by adding or removing one or two hatchlings per nest. In this way, we obtained experimentally reduced and enlarged broods where food supply per individual nestling was high and low, respectively (Roulin et al.1999; Bize and Roulin2006). This experiment allowed us to create variation in food supply, a key ecological factor that typically fluctuates across years and habitats. The aim of this experiment is to test whether the sign and intensity of covariation between growth in cross-fostered nestlings and the degree of melanism in their biological parents differ between the two experimental treatments, with differently colored individuals being best adapted to alternative con-ditions. For example, a positive relationship between parental eumelanism and offspring body size may be stronger in poor than rich rearing environments. This would indicate that the benefit to be eumelanic in terms of offspring growth is more pronounced under specific rearing conditions. Because the current knowledge of the adaptive function of phaeomelanin-and eumelanin-based traits is limited, we cannot propose a priori predictions regarding the sign and magnitude of covariation in the two experimental treatments. Our study has therefore the potential to indicate whether the degree of
phaeomelanism and eumelanism signals adaptations to rich and/or poor environments. If this is the case, it opens up the possibility that sexual selection exerted on these two traits is context-dependent, with individual preference for a given color trait varying over space/time depending on which color trait is locally/temporarily best adapted to the prevailing environmental conditions. Evidence for sexual selection has been given in the barn owl in which males appear to prefer eumelanic over non-eumelanic females (Roulin1999), while females may prefer white over reddish-brown males (Roulin and Altwegg2007). Variation in mating preference between habitats and over time may be frequent in polymorphic species (Roulin and Bize2007).
Materials and methods
General method and study organisms
Studies were carried out in Switzerland (46°49′ N/06° 56′ E) in the barn owl in 1996, in the tawny owl in 2004, and in the Alpine swift in 2003, 2004, and 2006. Barn owls bred in nest-boxes installed on barns in an area of 190 km2 located at a mean altitude of 430 to 520 m, tawny owls in nest-boxes installed on tree trunks in an area of 600 km2 located at an altitude of 480 to 900 m, and Alpine swifts in a colony holding ca 100 breeding pairs located under the roof of a clock tower in Bienne at an altitude of 450 m. We recorded hatching date, clutch size and mean egg volume with the formula ‘egg length× egg width2 × 9/6’. In adults, we measured wing length (in all three species) and tail length (barn owl and tawny owl) to the nearest millimeter, and sternum (Alpine swift) and tarsus length (tawny owl) to the nearest 0.1 mm. Sex of the nestlings was determined from blood cell DNA (Roulin et al. 1999; Griffiths et al. 1998). We marked chicks with nontoxic color paint before they were old enough to be banded with an aluminum-numbered band. Extra-pair paternity is rare in the barn owl (Roulin et al.2004b), tawny owl (Saladin et al. 2007), and swifts (Martins et al. 2002). Eggs hatch every 2.5 days in the barn owl, 3.5 days in the tawny owl, and 1 day in the Alpine swift, thereby creating a pronounced age hierarchy among nest-mates.
Ventral plumage coloration of barn owls varies contin-uously from reddish-brown (i.e., phaeomelanic; Roulin et al. 2007) to white (i.e., absence of phaeomelanin pigments) and in both number and size of black spots (eumelanin-based traits). A. Roulin reliably scored colora-tion visually on the breast, belly, flank, and underside of the wings from dark reddish-brown (color score 1) to white (color score 8) (repeatability = 0.90; Roulin and Dijkstra 2003). Mean color score of the four body parts was used in the statistical analyses. On each of the four body parts, the
diameter of spots was reliably measured to the nearest 0.1 mm using a caliper within a 60 × 40 mm frame (repeatability = 0.88; Roulin2004b). A mean spot diameter was calculated for each body part, and then, a mean overall value was used in the statistical analyses. Because previous studies showed that aspects of individual quality covary with spot diameter but not with number of spots (Roulin 2004b), we considered only spot diameter in the present paper to simplify the statistical analyses. Breeding birds for which primary and secondary feathers all belonged to the same new generation were classified as ‘1-year-old’, and those for which wing feathers were not of the same generation as ‘older than 1-year-old’ (Taylor 1994). Because plumage traits are genetically correlated with darker reddish-brown birds displaying more and larger black spots (Roulin and Dijkstra 2003; Roulin 2004b; genetic correlation is −0.40 in females and −0.60 in males, unpublished data), we simultaneously entered values of eumelanin- and phaemelanin-based coloration in the statistical analyses.
Tawny owls vary continuously from reddish-brown (i.e., phaeomelanic) to grey (i.e., absence of phaeomelanin pig-ments; unpublished data). A. Roulin visually assigned breeders to one of five morphs: reddish (1), reddish-brown (2), brown (3), brown-grey (4), and grey (5). If plumage coloration was assessed on several occasions, we calculated a mean color score per individual. To demonstrate the reliability of this method, we collected one feather on the back of most individuals. Without being aware of the morph assigned in the field, at the end of the field season, we ranked back feathers from the most reddish to greyest. Color morphs assigned in the field and feather ranks assigned after the field season were strongly correlated (Pearson correlation: r=0.92, n=74, P<0.0001).
Adult Alpine swifts vary in the amount of black streaks on the white belly feathers. P. Bize assigned visually breeding adults to one of four categories depending on the extent to which the rachis was black, and in turn, the belly appeared streaked: white belly (rachis of all belly feathers is white; score 0), lightly streaked belly (1), moderately streaked belly (2), and strongly streaked belly (i.e., all belly feathers had a strongly melanized rachis; (3). Color score of the same individual assessed over several years was repeatable (repeatability=0.87; Bize et al.2006a), and thus, we calculated a mean color score in individuals captured more than once.
Brood size manipulation experiments
Within all three species, we matched pairs of nests with similar hatching date (Pearson correlations, all three P-values<0.0001). Within pairs of experimental nests foster and biological parents did not significantly resemble each
other with respect to plumage traits [comparing average coloration of female and male parents from reduced broods with those from enlarged broods, barn owl phaeomelanism: r=−0.27, n=43, P=0.08 (coloration of one male was unknown); tawny owl: r=−0.13, n=27, P=0.50; Alpine swift: r=0.13, n=63, P=0.30 (coloration of two males was unknown)]. However, in the barn owl, biological and foster males resembled each other with respect to spot diameter (r= 0.44, n=43, P=0.003), a correlation that occurred for unknown reason, as we assigned pairs in the two brood size treatments before having captured males. To manipu-late brood sizes in the barn owl, we exchanged between nests of the same pair, 3 against 1 hatchling, in the tawny owl, on average 2.5 against 1.5 hatchlings, and in the Alpine swift, 2 against 1 hatchlings. After having ex-changed hatchlings between nests, each family was com-posed of nestlings from two origins, i.e., foster nestlings and nestlings born and raised in the same nest. Because in swifts, we carried out brood size manipulation experiments over 3 years, we considered only a bird’s first breeding attempt to avoid pseudo-replication. As our aim is to determine the sign of genetic covariation between nestling growth rate and coloration of their biological parents, we considered only cross-fostered nestlings for which colora-tion of both biological parents has been recorded. This makes a sample of 75 cross-fostered nestlings from 44 nests in the barn owl (in total 740 measures of body mass and 725 of wing length), 57 cross-fostered nestlings from 27 nests in the tawny owl (in total 177 measures of body mass and wing length), and 98 cross-fostered nestlings from 65 nests in the Alpine swift (in total 584 measures of body mass and wing length).
We successfully created broods with a different number of nestlings, as among broods in which at least one nestling fledged, brood size at fledging was significantly larger in the enlarged than reduced treatment (mean ± SE, barn owl: 5.2±0.2 vs 3.2 ±0.2, t42=6.92, P< 0.0001; tawny
owl: 4.07±0.2 vs 3.08±0.4, t25=2.00, P=0.05; Alpine
swift: 2.1±0.1 vs 1.3±0.2, t58=2.98, P=0.004). In the three
species, the mean rank in the within-brood age hierarchy of the cross-fostered offspring in both enlarged and reduced broods was not significantly correlated with coloration of biological parents (Pearson correlations, P-values>0.13: barn owl phaeomelanism: r=0.06 for enlarged broods and r=−0.17 for reduced broods; barn owl eumelanism: r=0.06 vs r=−0.17; tawny owl: r=−0.04 vs r=0.30; Alpine swift: r=−0.03 vs r=−0.14). Therefore, we did not control for hatching ranks in subsequent analyses. Hatching date, clutch size, and mean egg volume were not significantly associated with plumage traits of parents (Pearson correla-tions, P-values >0.18). In all three species, pairing was not assortative with respect to plumage traits (P-values>0.26; barn owl phaeomelanism: r=−0.17; barn owl eumelanism:
r=−0.09; tawny owl: r=−0.13; Alpine swift: r=0.14). Finally, within breeding males and females, plumage traits were not associated with body size (i.e., wing, tail, tarsus, or sternum length: Pearson correlations, P-values>0.09; range of Pearson correlation coefficients is−0.14 and 0.17 for barn owls,−0.31 and 0.30 for tawny owls, and 0.04 and 0.21 for Alpine swift).
Statistical procedure
Statistical analyses were performed with the SAS system (version 9.1; SAS Institute, Cary, NC, USA). Because a single measurement of nestling body size is subject to variation unrelated to the brood size manipulation, analyses based on repeated measures are expected to be more reliable than when based on a single measurement. We therefore used a mixed model analysis of covariance (ANCOVA) for repeated measures (proc mixed, Littell et al.2006) to investigate the interaction between melanism of parents and brood size treatments on body mass and wing length growth of their cross-fostered biological offspring. Body mass or wing length of cross-fostered nestlings were the dependent variables in separate models, nestling sex and brood size manipulation treatment (hereafter denoted BSM) were the categorical variables, nestling age, and coloration of biological parents covariates, and we computed their interactions. To control for pseudo-replication, we added in the models nest of rearing as a random factor and chick identity as a subject repeat nested within the treatment; we entered only the nest of rearing and not of origin because all cross-fostered siblings were raised in the same nest (therefore nests of rearing and origin are confounded). We did not consider noncross-fostered nestlings because any covariation between nestling growth and coloration of biological parents can be explained not only by pre-hatching effects (i.e., maternal and genetic effects) but also by post-hatching parental care as shown in previous studies in the barn owl (Roulin et al.2001; Roulin2006) and tawny owl (Roulin et al. 2004a). We chose the within-nestling covariance structure according to the AIC, AICC, and BIC criteria (Littell et al. 2006, autoregressive order 1 was selected for the barn owl and Alpine swift while unstructured was selected for the tawny owl). The degrees of freedom for fixed effects were estimated according to the Satterthwaite approximation that takes the within-nestling covariance structure better into account (Littell et al.2006). Z-statistics and P-values associated with random factors were not reported (Pinheiro and Bates 2000). However, in the statistical models we took into account the variance explained by random factors to compute the F-statistics and P-values associated with fixed effects, which are the variables of interest in our study. Nestling growth trajectories were adequately described by a quadratic relationship (i.e.,
age and age2) except in the barn owl in which body mass growth was better described by a cubic relationship (i.e., age, age2, and age3). We performed preliminary analyses with the coloration of biological father, biological mother, and mean coloration of both parents as dependent variables in separate models, and we present the best model based on AIC criterion (Johnson and Omland 2004). To facilitate the illustration of our main results, we categorized parents in two categories, i.e., phaeomelanic vs non-phaeomelanic and eumelanic vs non-eumelanic. However, in all statistical analyses, we introduced color values measured on a continuous scale. To control that our results were not artificially inflated by the greater degrees of freedom associated with the use of repeated measures, we ran a second set of analyses based on a single measurement per nest (i.e., mean of cross-fostered siblings) taken when the differences between the treatments was the most pronounced, as can be seen in the figures. Means are quoted ±SE. All tests were two-tailed, and alpha level is set to 0.05.
Results The barn owl
As shown by the significant interaction between brood size manipulation, mid-parent phaeomelanism, and nestling age (Table1), nestlings sired by redder parents became heavier
with age when brood size was experimentally reduced (similar mixed model ANCOVA as the one presented in Table1, interaction mid-parent phaeomelanism by nestling age, F1,46.7=6.65, P=0.01; Fig. 1a), an effect that was
not found when brood size was experimentally enlarged (F1,88.6=0.24, P=0.62; Fig. 1b). In contrast, wings of
nestlings born from whiter parents grew more rapidly when brood size was experimentally reduced (similar analysis as in Table 1, interaction mid-parent phaeomelanism by nestling age, F1,90.9=4.02, P= 0.05; Fig 1c), an effect
that was not detected in experimentally enlarged broods (F1,226=0.74, P=0.39; Fig. 1d). In our sample, yearling
males were significantly less reddish-brown than older individuals (Student’s t-test, males: t48=3.67, P=0.0006;
females: t48=0.75, P=0.46), and hence, age of the males
may have confounded our results. However, after running the same model as the one presented in Table 1 where we also included male age, the three-way interaction mid-parent phaeomelanism by nestling age by brood size manipulation was still significant (P-values for body mass and wing length<0.02). In the above analyses, we used mid-parent phaeomelanism because male and female phaeomelanism had similar effects on the three-way interaction with nestling age and brood size manipulation (similar analyses as in Table1by entering male and female phaeomelanism in separate models). This was the case for nestling body mass (phaeomelanism of biological father: P=0.013; phaeomelanism of biological mother: P=0.002)
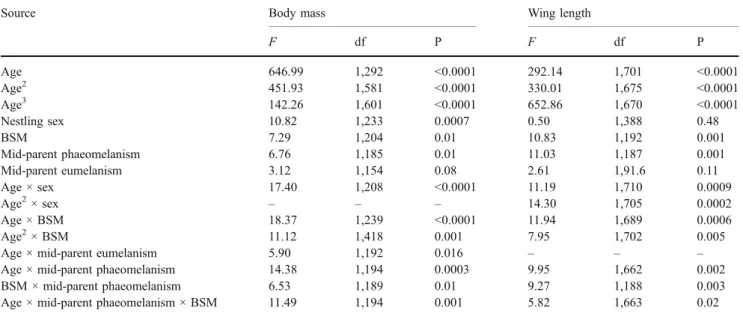
Table 1 Mixed model ANCOVA on the data collected in the barn owl
Source Body mass Wing length
F df P F df P Age 646.99 1,292 <0.0001 292.14 1,701 <0.0001 Age2 451.93 1,581 <0.0001 330.01 1,675 <0.0001 Age3 142.26 1,601 <0.0001 652.86 1,670 <0.0001 Nestling sex 10.82 1,233 0.0007 0.50 1,388 0.48 BSM 7.29 1,204 0.01 10.83 1,192 0.001 Mid-parent phaeomelanism 6.76 1,185 0.01 11.03 1,187 0.001 Mid-parent eumelanism 3.12 1,154 0.08 2.61 1,91.6 0.11 Age × sex 17.40 1,208 <0.0001 11.19 1,710 0.0009 Age2× sex – – – 14.30 1,705 0.0002 Age × BSM 18.37 1,239 <0.0001 11.94 1,689 0.0006 Age2× BSM 11.12 1,418 0.001 7.95 1,702 0.005 Age × mid-parent eumelanism 5.90 1,192 0.016 – – – Age × mid-parent phaeomelanism 14.38 1,194 0.0003 9.95 1,662 0.002 BSM × mid-parent phaeomelanism 6.53 1,189 0.01 9.27 1,188 0.003 Age × mid-parent phaeomelanism × BSM 11.49 1,194 0.001 5.82 1,663 0.02 Body mass and wing length of cross-fostered nestlings were the dependent variable in separate models, nestling sex and brood size manipulation treatments (BSM) two factors, and mean phaeomelanin-based and eumelanin-based (i.e., spot diameter) coloration of biological father and mother, nestling age, age2, and age3covariates. To control for pseudo-replication, we added in the model the nest of rearing as a random factor and chick
identity as a subject repeat nested within the treatment and the nest of rearing. Nonsignificant interactions (indicated by ×) were removed step by step from the model (all P values>0.07; these nonsignificant interactions are not given in the table). F values are given for fixed effects and degrees of freedom (df) were estimated according to the Satterthwaite approximation.
and wing length (phaeomelanism of biological father: P= 0.095; phaeomelanism of biological mother: P=0.010).
All of the above analyses were based on repeated measures, and as can be seen in Fig. 1, the covariation between plumage phaeomelanism and body mass was pronounced at fledging (i.e., around 55 days of age). For each nest, we therefore calculated mean body mass of cross-fostered siblings measured at fledging (range: 43– 65 days; mean±SE: 55±0.4), and ran an ANCOVA with brood size treatment as a factor (F1,39=4.48, P=0.04),
mean nestling age as a first covariate (F1,39=4.64, P=
0.037), mean parental phaeomelanism as a second covariate (F1,39=2.01, P=0.16), and interaction between
phaeome-lanism and treatment (F1,39= 5.41, P= 0.025; all other
interactions were not significant and thus removed from
the model). In the reduced treatment, the cross-fostered offspring of redder biological parents were heavier at fledging [multiple regression analysis with mean parental plumage phaeomelanism (F1,18=4.48, P=0.048; parameter
estimate: −19.9±9.4) and mean nestling age (F1,18=1.92,
P=0.18; −2.7±2.0) as two independent variables]. In the enlarged treatment, the relationship between mean nestling body mass and mean parental phaeomelanism was not significant (similar analysis: F1,20=0.75, P=0.40; 5.3±6.2).
In a similar analysis on mean nestling wing length at fledging, the interaction between brood size treatment and mean parental phaeomelanism was not significant (F1,39=
0.73, P=0.40).
Mid-parent eumelanism (i.e., spot diameter) was associ-ated with nestling body mass growth (but not with wing
Fig. 1 Mean body mass and wing length (±1 SE) of cross-fostered barn owl nestlings in relation to their age and mean phaeomelanism of their biological parents when brood size was experimentally reduced (a, c) or enlarged (b, d). Open and closed symbols represent nestlings sired by white and reddish-brown parents, respectively. Pairs for
which mean plumage coloration was below and above the median were referred to as ‘reddish-brown’ and ‘white’, respectively. We defined age categories each 10 days: 5 to 14=10 days; 15 to 24= 20 days, and so on
length) but not in interaction with the brood size manipu-lation experiment (Table1). Nestlings sired by parents with smaller eumelanic spots became heavier with age than nestlings sired by parents with larger spots (Fig. 2). As stated in the methods, within pairs of nests used to cross-foster nestlings spot diameter of males tending an enlarged brood was correlated with spot diameter of males rearing a reduced brood. Therefore, foster parents may explain the relationship between nestling growth and spot diameter of biological parents. This was however not the case, as the results presented in Table1were similar after having added mean spot diameter of foster parents in the model (this
factor was not significant neither alone nor in interaction with nestling age). Interactions between mid-parent eumelanism, mid-parent phaeomelanism, brood size treat-ment, and nestling age were all not significant (P-values > 0.l8) indicating that relationship between one plumage trait and nestling growth is independent of the other plumage trait. When entering male or female spot diameter (in separate models), instead of mid-parent spot diameter, we obtained the same patterns, an association between this plumage trait and nestling body mass growth (interaction age × spot diameter of biological father: P= 0.13; interaction age × spot diameter of biological mother: P= 0.02).
The tawny owl
The interaction between mid-parent phaeomelanism and brood size manipulation was significant for nestling body mass and wing length (Table2). In the reduced treatment, nestlings born from redder parents were heavier (similar mixed model ANCOVA as in Table 2, mid-parent phaeomelanism: F1,9.68=19.53, P=0.001; Fig. 3a) and had
longer wings (F1,3.22=12.60, P=0.03; Fig.3c), while in the
enlarged treatment the difference in body mass (similar analysis, F1,10.4=1.43, P=0.26; Fig. 3b) and wing length
(F1,7.96=0.05, P=0.83; Fig.3d) between nestlings sired by
reddish and grey parents was not significant. As for the barn owl, we ran the analysis by using a single value per family. In Fig. 3, we can see that the interaction phaeomelanism by brood size treatment is highest between 10 and 20 days of age. We therefore calculated mean body mass of cross-fostered siblings measured at 14 days of age on average (range: 10–16; mean± SE: 13.9±0.3), and performed an ANCOVA with mean body mass as the dependent variable, brood size treatment as a factor (F1,21=
Fig. 2 Mean body mass (±1 SE) of cross-fostered barn owl nestlings in relation to their age and mean eumelanic spot diameter of their biological parents. Open and closed symbols represent nestlings sired by parents with small or large eumelanic spot, respectively (pairs for which mean spot diameter was below and above the median, respectively). We defined age categories each 10 days: 5 to 14= 10 days; 15 to 24=20 days, and so on
Table 2 Mixed model ANCOVA on the data collected in the tawny owl
Source Body mass Wing length
F df P F df P Age 534.95 1,23.71 <0.0001 12929.4 1,92.3 <0.0001 Sex 17.94 1,28.5 0.0002 5.08 1,85.9 0.03 Mid-parent phaeomelanism 19.37 1,16.0 0.0004 4.77 1,18.9 0.04 BSM 31.59 1,21.4 <0.0001 4.43 1,18.8 0.05 BSM × mid-parent phaeomelanism 6.78 1,16.2 0.02 4.92 1,18.9 0.04 Age × sex – – – 11.45 1,92.1 0.001 Age × BSM 19.24 1,23.6 0.0002 – – –
Body mass and wing length of cross-fostered nestlings were the dependent variable in separate models, nestling sex, and brood size manipulation treatments (BSM) two factors, and nestling age and mean phaeomelanin-based coloration of biological parents covariates. To control for pseudo-replication, we added in the model the nest of rearing as a random factor and chick identity as a subject repeat nested within the treatment. Nonsignificant interactions (indicated by ×) were removed step by step from the model (all P values>0.17; these nonsignificant interactions are not given in the table). F values are given for fixed effects, and degrees of freedom (df) were estimated according to the Satterthwaite approximation.
11.92, P=0.002), mean nestling age as a first covariate (F1,21=70.82, P<0.0001), mother phaeomelanism (F1,21=
15.17, P=0.0008; offspring of redder females were heavi-er), father phaeomelanism (F1,21=3.32, P=0.08), and the
interaction between father phaeomelanism and brood size treatment (F1,21=5.35, P=0.03; all other interactions were
not significant, and hence, removed from the model). In the reduced treatment, the cross-fostered offspring of redder parents were heavier (multiple regression analysis with age (F1,10=17.91, P=0.0017; parameter estimate: 14.4±3.4),
father (F1,10=6.80, P=0.026;−8.0±3.1) and mother
phaeo-melanism (F1,10= 7.99, P= 0.018; −11.3±4.0) as three
independent variables). In the enlarged treatment, mean nestling body mass was not associated with father phaeomelan-ism (similar analysis: F1,9=0.04, P=0.84; 0.6±3.2) but with
mother plumage coloration (F1,9=6.72, P=0.029;−7.2±2.8).
Within each brood size treatment, mean nestling wing length was not associated with phaeomelanism of biological mother and father (similar multiple regression analyses: P-values> 0.10). Because the degree of phaeomelanism was scored in categories, we ran nonparametric analyses to ensure that our main results are not an artefact of the statistical method. Mean nestling body mass at 14 days of age was significantly associated with biological mother phaeomelanism in the reduced treatment (control for mean nestling age and father phaeomelanism in Kendall’s τ=−0.56, P=0.008) but not in the enlarged treatment Kendall’s τ (τ=−0.17, P=0.45) confirming the claim that nestling body mass is associated with the degree of parental phaeomelanism only in reduced broods.
Fig. 3 Mean body mass and wing length (±1 SE) of cross-fostered tawny owl nestlings in relation to their age and mean phaeomelanism of their biological parents when brood size was experimentally reduced (a, c) or enlarged (b, d). Open and closed symbols represent nestlings sired by grey and reddish-brown parent, respectively. Pairs
for which mean plumage phaeomelanism was below and above the median were referred to as‘grey’ and ‘reddish-brown’, respectively. We defined age categories each 5 days: 8 to 12=10 days; 13 to 17= 15 days; 18 to 22=20 days; 23 to 27=15 days
The Alpine swift
As shown in a previous study (Bize et al.2006a), nestling body mass and wing length are associated with the degree of eumelanism expressed in biological fathers but not in biological mothers. We therefore assessed whether the relationship between nestling growth rate and paternal eumelanism differs between the two brood size treatments. The interaction between brood size manipulation and paternal eumelanism was significant for nestling wing length but not for body mass (Table3). When brood size was experimentally enlarged, wings of nestlings sired by deeply eumelanic fathers grew more rapidly than wings of nestlings sired by lightly eumelanic fathers (similar analysis as in Table 3, interaction age by paternal eumelanism, F1,158= 8.76, P= 0.004; Fig. 4d), an effect
that was not detected in experimentally reduced broods (F1,90.6= 0.07, P= 0.80; Fig.4c). Similar analyses showed
that the degree of maternal eumelanism did not covary with offspring wing length and body mass neither alone nor in interaction with the brood size manipulation experiment (results not shown).
For each nest, we calculated mean wing length of siblings aged 46 to 55 days of age and raised by foster parents, as the interaction between father eumelanism and brood size manipulation on this trait was strongest around 50 days of age (Fig.4). With mean nestling wing length as the dependent variable in an ANCOVA and brood size manipulation as a factor (F1,48= 3.68, P= 0.06), mean
nestling age as a first covariate (F1,48=8.60, P=0.005)
and father eumelanism as a second covariate (F1,48=2.28,
P= 0.14) showed that the interaction between father eumelanism and brood size manipulation was significant
(F1,48=4.37, P=0.04). In the enlarged treatment, blacker
fathers produced longer-winged cross-fostered offspring (multiple regression analysis: F1,25=4.33, P=0.048,
param-eter estimate: 5.4±2.7; controlling for mean nestling age). In contrast, in the reduced treatment, plumage eumelanism of biological father was not significantly associated with mean offspring wing length (similar model: F1,22=0.03, P=
0.87; 1.02±1.1).
Discussion
The present study reports significant interactions between parental degree of melanism and the quality of the rearing environment (i.e., brood size manipulation experiment) on offspring growth in three free-living bird species. These results were robust, as we obtained them by using two different statistical methods, that is, by performing analyses based on a single measurement per nest (i.e., mean values of cross-fostered siblings) and by using repeated measures in mixed model ANCOVAs. Interest-ingly, phaeomelanic and eumelanic color traits responded in opposite ways to the brood size manipulation experi-ment suggesting that phaeomelanic and eumelanic indi-viduals may be best adapted to rich and poor environments, respectively. Another approach would be to investigate interaction between parental melanism and environmental factors such as food abundance that can vary in both space and time on offspring quality. However, our method has the merit to be experimental, as we modified the environment by manipulating brood sizes. In the following, we discuss the relevance of our results for understanding the adaptive value of
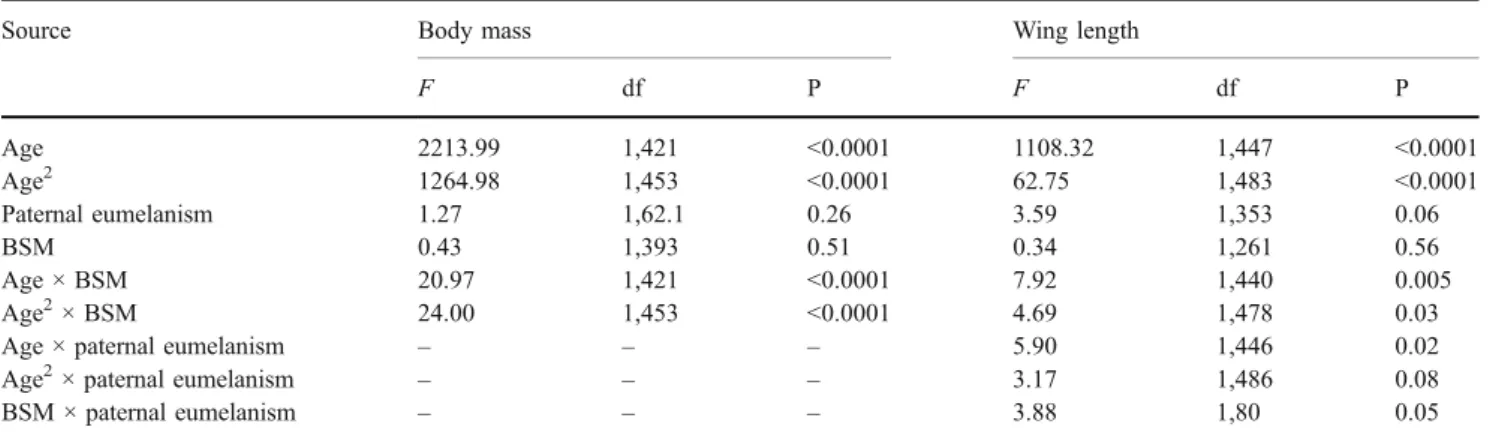
phaeome-Table 3 Mixed model ANCOVA on the data collected in the Alpine swift
Source Body mass Wing length
F df P F df P Age 2213.99 1,421 <0.0001 1108.32 1,447 <0.0001 Age2 1264.98 1,453 <0.0001 62.75 1,483 <0.0001 Paternal eumelanism 1.27 1,62.1 0.26 3.59 1,353 0.06 BSM 0.43 1,393 0.51 0.34 1,261 0.56 Age × BSM 20.97 1,421 <0.0001 7.92 1,440 0.005 Age2× BSM 24.00 1,453 <0.0001 4.69 1,478 0.03 Age × paternal eumelanism – – – 5.90 1,446 0.02 Age2× paternal eumelanism – – – 3.17 1,486 0.08 BSM × paternal eumelanism – – – 3.88 1,80 0.05 Body mass and wing length of cross-fostered nestlings was the dependent variable, brood size manipulation treatments (BSM) factor, and nestling age, nestling age2, and eumelanin-based coloration of biological father covariates. To control for pseudo-replication, we added in the model, the
nest of rearing as a random factor and chick identity as a subject repeat nested within the treatment. Nonsignificant interactions (indicated by ×) were removed step by step from the model (all P values>0.12; these nonsignificant interactions are not given in the table). F values are given for fixed effects and degrees of freedom (df) were estimated according to the Satterthwaite approximation. To simplify the model, year was not included in the model.
lanin- and eumelanin-based traits, and how variation in these traits may be evolutionary stable.
Phaeomelanin- and eumelanin-based colorations as markers of growth strategies
In both the barn owl and the tawny owl, biological parents displaying phaeomelanin-based coloration to a larger extent produced heavier offspring but significantly so only when raised in a foster reduced brood but not in a foster enlarged brood. A similar result was found for nestling wing growth in the tawny owl, while in the barn owl, nestlings sired by non-phaeomelanic parents grew their wings more rapidly in the reduced treatment. However, in the barn owl results on wing length were found only with repeated measures ANCOVAs but not
when considering a single measurement per brood. By performing the same experiment in two related species, we can therefore demonstrate that the allocation of resources into the growth of alternative traits (i.e., plasticity) is associated with the degree of parental phaeomelanism in interaction with brood size. Assuming that body mass is more closely linked to survival prospect than wing length at least during the nestling period (e.g., Overskaug and Bolstad1999; Bize et al.2006b), our study suggests that the degree of phaeomelanism is associated with different growth strategies in rich environments, as in experimentally reduced broods, offspring from redder parents were heavier. A survey of the literature revealed that only a single correlative study investigated the relationship between phaeomelanin-based coloration and body mass in adult brown-headed cowbirds (Molothrus
Fig. 4 a–d Mean body mass and wing length (±1 SE) of cross-fostered Alpine swift nestlings in relation to their age and the degree of breast eumelanism of their biological father. Open and closed symbols represent nestlings sired by father with heavily and lightly
melanic breast, respectively. Males for which the degree of melanism was above and below the median were referred to as‘eumelanic’ and ‘non-eumelanic’, respectively. We defined age categories each 5 days: 3 to 8=5 days; 8 to 12=10 days; 13 to 17=15 days, and so on
ater) (McGraw et al.2002). The absence of a significant relationship in the latter study is difficult to interpret, as a covariation may arise only in specific environmental conditions and at specific life history stages (e.g., nestling vs adult stages). Accordingly, in the barn owl, phaeome-lanic nestlings were heavier when raised under relaxed conditions (present study), while in a long-term study, non-phaeomelanic male breeders were heavier than phaeomelanics (Roulin2006).
The interaction between the brood size manipulation experiment and the degree of parental eumelanism on offspring growth was significant in the Alpine swift, while in the barn owl, non-eumelanic parents produced heavier offspring than eumelanic parents independently of brood size treatments. In swifts, cross-fostered nest-lings sired by blacker fathers grew longer wings only when brood size was experimentally enlarged; wing length is a key trait in this species, as it determines age at fledging (an important fitness component in this species) and birds are foraging on their wings (Bize et al. 2003). This suggests that the advantage of being blacker in terms of improved offspring growth (Bize et al. 2006a) is exacerbated when rearing conditions are stress-ful. Based on the results found in the Alpine swift, we propose that the degree of eumelanism signals the capacity to buffer the negative effect of environmental stress factors. In line with this hypothesis, barn owl mothers, displaying larger black spots, produce offspring that develop a more symmetrical phenotype (Roulin et al. 2003b), are more resistant to parasites (Roulin2004b), and start to breed at a younger age and survive better (Roulin and Altwegg 2007), and blacker feral pigeons (Columba livia) were more resistant to the effects of the nuclear accident in Chernobyl (Johnston and Janiga 1995). Blacker Harris’ sparrows (Zonotrichia querula) had lower levels of blood corticosterone, although this may be due to the fact that blacker individuals are dominant in social relationships (Rohwer and Wingfield1981).
Implications for the maintenance of phenotypic variation To determine the sign and intensity of genetic covariation between offspring growth rate and parental phenotypic traits, cross-fostering experiments are necessary to avoid post-hatching parental effects. The expression of plumage coloration in the barn owl, the tawny owl, and the Alpine swift being heritable (Roulin and Dijkstra 2003; Bize et al. 2006a; unpublished data), genetic factors or pre-hatching maternal effects may be responsible for the relationships detected between growth in cross-fostered offspring and the degree of melanism in their biological parents. The maintenance of variation in the degree of melanism requires this trait to be associated with equally
rewarding alternative strategies to cope with a fluctuating environment with melanic and non-melanic parents achieving equal fitness but via different routes. This scenario is plausible at least in the barn owl.
Cline variation on the European continent with barn owls being reddish-brown in the north (subspecies Tyto alba guttata) and white in the south (Tyto alba alba) (Roulin 2003) suggests that phaeomelanic and non-phaeomelanic individuals are adapted to different envi-ronmental conditions. Accordingly, these two subspecies have a different diet in both allopatry and sympatry with T. a. guttata consuming more voles and T. a. alba more mice (Roulin 2004c). Furthermore, reddish-brown males pro-duce more fledglings in some years (Roulin et al. 2001), while whiter male nestlings are more often recruited as breeders in the local breeding population (Roulin and Altwegg 2007) suggesting that plumage coloration is associated with alternative male reproductive strategies. Phaeomelanin-based dependent strategies in the barn owl may result from two non-mutually exclusive mechanisms. First, plumage phaeomelanism plays a direct role on foraging (e.g. Rohwer and Paulson 1987; Roulin and Wink2004) or thermoregulation, or the genetic machinery underlying the expression of phaeomelanic pigments have habitat-dependent positive and negative pleiotropic effects. Second, results obtained in the zone of secondary contact of the subspecies T. a. guttata and T. a. alba in Switzerland may be an indirect consequence of the fact that these two subspecies evolved alternative life history strategies in different geographic regions where selective regimes are different. In other words, genes coding for given life history strategy and coloration would have evolved independently in allopatry, and a covariation between the two in sympatry would occur if there is a linkage disequilibrium between these genes. In that case, coloration may have no selective value and genetic correlation between coloration and life history traits such as growth would have evolved in allopatry just by chance and be a specificity of European barn owls. If we cannot exclude this scenario for the barn owl, it may not be applicable to the tawny owl because we detected similar associations between the degree of parental phaeomelan-ism and nestling body mass growth despite plumage coloration showing no cline variation on the European continent (Galeotti and Cesaris 1996). Previous studies showed that in some years, phaeomelanic tawny owls produce heavier offspring than grey individuals, while the reverse is true in other years (Roulin et al.2003a,2004a). Interestingly, the finding that phaeomelanic parents pro-duce heavier offspring in repro-duced than in enlarged broods is consistent with a laboratory experiment showing that offspring of reddish parents assimilate food more effi-ciently than those of grey parents only when food is
provided ad libitum (unpublished data). Furthermore, in Italy, phaeomelanic tawny owls suffer a higher mortality in cool-dry years, and grey birds in warm-wet years (Galeotti and Cesaris1996). This further indicates that the degree of phaeomelanism is associated with alternative strategies, a proposition that should be tested in other species in which there is clear interindividual variation in phaeomelanin-based coloration.
Environmental heterogeneity generates diversifying selection, and hence, favoring either ecological specialists that exploit alternative niches or generalists that are able to exploit the whole heterogenous environment. Hetero-geneity can also promote the evolution of phenotypic plasticity where individuals match their phenotype with the environment (Kassen 2002). To our knowledge, we report one of the first experimental evidence that covari-ance between parental melanin-based coloration and offspring fitness parameters varies across rich and poor environments (i.e., reduced and enlarged broods, respec-tively). Because melanin-based traits can be used in communication (Jawor and Breitwisch 2003; Roulin 2004a), and food supply varies in space and time in nature, this finding could explain, at least in part, why variation in the degree of melanism is maintained within populations but also why mean and variance in plumage coloration differ between populations (see also Gustafsson et al.1995; Qvarnström1999). These suggestions have to be tackled further by considering other traits than nestling growth, as in the present study, interaction between coloration and brood size manipulation on offspring growth were not crossing, i.e., a redder coloration was beneficial in terms of growth rate when raised in reduced broods, while a non-red coloration did not provide an advantage when raised in enlarged broods.
Melanin-based coloration in the barn owl, tawny owl, and Alpine swift appears to be appropriate model systems to investigate the role played by environmental heteroge-neity on the maintenance of phenotypic variation. This model system allows us to integrate a suite of character-istics such as genetic correlation between plumage traits (e.g., coloration and spot diameter are genetically corre-lated in the barn owl, Roulin 2004b), sex-specific selective regimes exerted on these traits (e.g., in the barn owl, phaeomelanism seems to be particularly important in males, while eumelanism in females, Roulin and Altwegg 2007), but also genetic compatibility if offspring perfor-mance depends on the combination of father and mother plumage traits, a possibility that will be investigated in a near future. Finally, it would be interesting to investigate whether the covariation in offspring growth strategies and parental melanism results from differently colored indi-viduals varying in their degree of offspring solicitation and parental investment, a potential case of coevolution
between parental and offspring life-history strategies (Kölliker et al.2005).
Conclusion
In an experiment with combined cross-fostering and brood size manipulation in three species of birds, we show that (1) nestlings sired by phaeomelanic parents grew more rapidly in body mass in rich environments (i.e., experimentally reduced broods) in both the barn owl and the tawny owl, and (2) nestlings sired by blacker fathers grew their wings more rapidly in poor environ-ments (i.e., experimentally enlarged broods) in the Alpine swift. Because nestlings were raised by foster parents, relationships between growth rate and the degree of melanism in biological parents are probably due to genetic factors. The next steps are (1) to test in a wider range of species the general applicability of the hypoth-esis that phaeomelanin- and eumelanin-based color traits signal adaptations to rich and poor environments, respec-tively, (2) to determine what mechanisms produce the links between melanism and adaptations to different environments, and (3) to assess the lifelong consequences of these melanism-based growth strategies.
Acknowledgments The study Swiss National Science Foundation supported financially the study (n° PPOOA-102913 to A. Roulin and PPOOA-109009 to P. Bize). We are grateful to the late Martin Epars, Henri Etter, and Antoine Stocker for their help in the field, Verena Saladin for her help in the laboratory, and to the late Theo Marbot for providing us access to the Alpine swift colony in Bienne. James Fry and two anonymous referees kindly provided useful comments on a previous version of the manuscript. Experiments were under the legal authorization of the‘Service vétérinaire des cantons de Vaud et Berne’.
References
Ahnesjö J, Forsman A (2003) Correlated evolution of colour pattern and body size in polymorphic pygmy grasshoppers, Tetrix undulata. J Evol Biol 16:1308–1318
Andersson M (1994) Sexual selection. Princeton University Press, Princeton
Bize P, Roulin A (2006) Sibling competition and the risk of falling out of the nest. Anim Behav 72:539–544
Bize P, Roulin A, Bersier L-F, Pflüger D, Richner H (2003) Parasitism and developmental plasticity in Alpine swift nestlings. J Anim Ecol 72:633–639
Bize P, Gasparini J, Klopfenstein A, Altwegg R, Roulin A (2006a) Melanin-based coloration is a non-directionally selected sex-specific signal of offspring development in the Alpine swift. Evolution 60:2370–2380
Bize P, Metcalfe NB, Roulin A (2006b) Catch-up growth strategies differ between body structures: interactions between age and structure-specific growth in wild nestling Alpine swifts. Funct Ecol 20:857–864
Byers DL (2005) Evolution in heterogenous environments and the potential of maintenance of genetic variation in traits of adaptive significance. Genetica 123:107–124
Galeotti P, Cesaris C (1996) Rufous and grey colour morphs in the Italian tawny owl: geographical and environmental influences. J Avian Biol 27:15–20
Gillespie JH, Turelli M (1989) Genotype–environment interactions and the maintenance of polygenic variation. Genetics 114:333–343 Griffiths R, Double MC, Orr K, Dawson RJG (1998) A DNA test to
sex most birds. Mol Ecol 7:1071–1075
Gustafsson L, Qvarnström A, Sheldon BC (1995) Trade-offs between life-history traits and a secondary sexual character in male collared flycatchers. Nature 375:311–313
Jawor JM, Breitwisch R (2003) Melanin ornaments, honesty, and sexual selection. Auk 120:249–265
Johnston RF, Janiga M (1995) Feral pigeons. Oxford University Press, Oxford
Johnson JB, Omland KS (2004) Model selection in ecology and evolution. Trends Ecol Evol 19:101–108
Kassen R (2002) The experimental evolution of specialists, general-ists, and the maintenance of diversity. J Evol Biol 15:173–190 Kawecki TJ, Ebert D (2004) Conceptual issues in local adaptation.
Ecol Lett 7:1225–1241
Kölliker M, Brodie ED, Moore A (2005) The coadaptation of parental supply and offspring demand. Am Nat 166:506–516
Levene H (1953) Genetic equilibrium when more than one niche is available. Am Nat 87:331–333
Littell RC, Milliken GA, Stroup WW, Wolfinger RD, Schabenberger O (2006) SAS® for mixed models, 2nd edn. SAS Institute, Inc, Cary, NC
Majerus MEN (1998) Melanism, evolution in action. Oxford University Press, Oxford
Martins TLF, Blakey JK, Wright J (2002) Low incidence of extra-pair paternity in the colonially nesting common swift Apus apus. J Avian Biol 33:441–446
McGraw KJ, Mackillop EA, Dale J, Hauber ME (2002) Different colors reveal different information: how nutritional stress affects the expression of melanin- and structurally based ornamental plumage. J Exp Biol 205:3747–3755
Merilä J, Fry JD (1998) Genetic variation and causes of genotype– environment interaction in the body size of blue tit (Parus caeruleus). Genetics 148:1233–1244
Nachman MW, Hoekstra HE, D’Agostino SL (2003) The genetic basis of adaptive melanism in pocket mice. Proc Natl Acad Sci USA 100:5268–5273
Overskaug K, Bolstad JP (1999) Fledgling behavior and survival in northern tawny owls. Condor 101:169–174
Pinheiro JC, Bates DM (2000) Statistics and computing; mixed-effects models in S and S-plus. Springer Verlag, New York
Prout T, Savolainen O (1996) Genotype-by-environment interaction is not sufficient to maintain variation: Levene and the leafhopper. Am Nat 148:930–936
Qvarnström A (1999) Genotype-by-environment interactions in the determination of the size of a secondary sexual character in the collared flycatcher (Ficedula albicollis). Evolution 53:1564–1572 Ravigné V, Olivieri I, Dieckmann U (2004) Implications of habitat
choice for protected polymorphisms. Evol Ecol Res 6:125–145 Rohwer S, Paulson DR (1987) The avoidance-image hypothesis and
color polymorphism in Buteo hawks. Ornis Scand 18:285–290 Rohwer S, Wingfield JC (1981) A field study of social dominance,
plasma levels of luteinizing hormone and steroid hormones in wintering Harris’ sparrows. Ethology 57:173–183
Roulin A (1999) Nonrandom pairing by male barn owls Tyto alba with respect to a female plumage trait. Behav Ecol 10:688–695
Roulin A (2003) Geographic variation in sexually selected traits: a role for direct selection or genetic correlation? J Avian Biol 34:251–258
Roulin A (2004a) The evolution, maintenance and adaptive function of genetic colour polymorphism in birds. Biol Rev 79:815–848 Roulin A (2004b) Proximate basis of the covariation between a
melanin-based female ornament and offspring quality. Oecologia 140:668–675
Roulin A (2004c) Covariation between plumage colour polymorphism and diet in the barn owl Tyto alba. Ibis 146:509–517
Roulin A (2006) Linkage disequilibrium between a melanin-based colour polymorphism and tail length in the barn owl. Biol J Linn Soc 88:475–488
Roulin A, Altwegg R (2007) Breeding rate is associated with pheomelanism in male and with eumelanism in female barn owls. Behav Ecol 18:563–570
Roulin A, Bize P (2007) Sexual selection in genetic colour polymorphic species: a review of experimental studies and perspectives. J Ethol 25:99–105
Roulin A, Dijkstra C (2003) Genetic and environmental components of variation in eumelanin and phaeomelanin sex-traits in the barn owl. Heredity 90:359–364
Roulin A, Wink M (2004) Predator–prey relationships and the evolution of genetic colour polymorphism: a comparative analysis in diurnal raptors. Biol J Linn Soc 81:565–578 Roulin A, Ducrest A-L, Dijkstra C (1999) Effect of brood size
manipulations on parents and offspring in the barn owl Tyto alba. Ardea 87:91–100
Roulin A, Riols C, Dijkstra C, Ducrest A-L (2001) Fe and male-specific signals of quality in the barn owl. J Evol Biol 14:255– 267
Roulin A, Ducret B, Ravussin P-A, Altwegg R (2003a) Female plumage coloration covaries with reproductive strategies in the tawny owl. J Avian Biol 34:393–401
Roulin A, Ducrest A-L, Balloux F, Dijkstra C, Riols C (2003b) A female melanin-ornament signals offspring fluctuating asymme-try in the barn owl. Proc R Soc Lond B270:167–171
Roulin A, Bize P, Ravussin P-A, Broch L (2004a) Genetic and environmental effects on the covariation between colour polymorphism and a life history trait. Evol Ecol Res 6:1253– 1260
Roulin A, Müller W, Sasvári L, Dijkstra C, Ducrest A-L, Riols C, Wink M, Lubjuhn T (2004b) Extra-pair paternity, testes size and testosterone level in relation to colour polymorphism in the barn owl Tyto alba. J Avian Biol 35:492–500
Roulin A, Almasi B, Rossi-Pedruzzi A, Ducrest A-L, Wakamatsu K, Miksik I, Blount J D, Jenni-Eiermann S, Jenni L (2007) Corticosterone mediates the condition-dependent component of melanin-based coloration. Anim Behav (in press)
Saladin V, Ritschard M, Roulin A, Bize P, Richner H (2007) Genetic parentage analysis in the tawny owl (Strix aluco) reveals low rate of extra-pair paternity. J Ornithol 148:113–116
Sgrò CM, Hoffmann AA (2004) Genetic correlations, tradeoffs and environmental variation. Heredity 93:241–248
Spichtig M, Kawecki TJ (2004) The maintenance (or not) of polygenic variation by soft selection in heterogeneous environ-ments. Am Nat 164:70–84
Svensson E, Sinervo B, Comendant T (2001) Condition, genotype-by-environment interaction, and correlational selection in lizard life-history morphs. Evolution 55:2053–2069
Taylor IR (1994) Barn Owls: predator–prey relationships. Cambridge University Press, Cambridge
Via S, Lande R (1985) Genotype–environment interaction and the evolution of phenotypic plasticity. Evolution 39:505–522