HAL Id: hal-01242020
https://hal.inria.fr/hal-01242020
Submitted on 11 Dec 2015
HAL is a multi-disciplinary open access
archive for the deposit and dissemination of
sci-entific research documents, whether they are
pub-lished or not. The documents may come from
teaching and research institutions in France or
abroad, or from public or private research centers.
L’archive ouverte pluridisciplinaire HAL, est
destinée au dépôt et à la diffusion de documents
scientifiques de niveau recherche, publiés ou non,
émanant des établissements d’enseignement et de
recherche français ou étrangers, des laboratoires
publics ou privés.
Copyright
In situ validation of a parametric model of electrical
field distribution in an implanted cochlea
Kai Dang, Maureen Clerc, Clair Vandersteen, Nicolas Guevara, Dan Gnansia
To cite this version:
Kai Dang, Maureen Clerc, Clair Vandersteen, Nicolas Guevara, Dan Gnansia.
In situ
valida-tion of a parametric model of electrical field distribuvalida-tion in an implanted cochlea.
7th
Inter-national IEEE EMBS Conference on Neural Engineering, Apr 2015, Montpellier, France, France.
�10.1109/NER.2015.7146711�. �hal-01242020�
In situ validation of a parametric model of electrical
field distribution in an implanted cochlea
Kai Dang, Maureen Clerc, Clair Vandersteen, Nicolas Guevara and Dan Gnansia
Abstract—Cochlear implants have been proved to be an
effec-tive treatment for patients with sensorineural hearing loss. Among all the approaches that have been developed to design better cochlear implants, 3D model-based simulation stands out due to its detailed description of the electric field which helps reveal the electrophysiological phenomena inside the cochlea. With the advances in the cochlear implant manufacturing technology, the requirement on simulation accuracy increases. Improving the simulation accuracy relies on two aspects: 1) a better geometrical description of the cochlea that is able to distinguish the subtle differences across patients; 2) a comprehensive and reliable validation of the created 3D model. In this paper, targeting at high precision simulation, we propose a parametric cochlea model which uses micro-CT images to adapt to different cochlea geometries, then demonstrate its validation process with multi-channel stimulation data measured from a implanted cochlea. Comparisons between the simulation and validation data show a good match under a variety of stimulation configurations. The results suggest that the electric field distribution is affected by the geometric characteristics of each individual cochlea. These differences can be correctly reflected by simulations based on a 3D model tuned with personalized data.
I. INTRODUCTION
As a highly successful neural prostheses, cochlear implant have been used for many years to help patients who suffer from sensorineural hearing loss recover the sense of hearing. The cochlear implant works by directly stimulating the residual auditory nerve fibers inside the cochlea according to their naturally developed tonotopic organization [1], [2]. Despite the significant improvements that have been made in the past decades, the performance of modern cochlear implants is still far behind the healthy cochlea. A suspected reason is the precision of stimulation. In a healthy cochlea, an auditory nerve fiber is activated by the hair cell to which it is connected. While in an implanted cochlea, the auditory nerve fibers are activated by electrical stimulations originating from a certain distance. The tissue and liquid between the current source and the nerve fiber diffuse the stimulating current, reducing its spatial selectivity [3]. As a result, the excited nerve fibers spreads and the number of uncorrelated information channels decreases [4].
Efforts have been made to improve spatial selectivity with optimized the stimulation strategies. Since the implants only have a limited capability of measuring electric field related data in the patients’ cochleas, 3D model based simulations are often used to fill the blanks. Until now, based on the computation of the electric field [5], [6], [7], the simulation approach has been used to optimize the current focusing strategy [8], to study the consequences of neural degeneration [9], and to model the electric compound action potential (ECAP) of the auditory nerve [10], [11].
Besides current diffusion, the performance of the implant on each patient is also largely affected by individual factors such as the cochlea shape, position of the electrode array and the neuron survival [9], [12]. For the generalized 3D cochlear models developed in the previous studies, the effects of these factors are hard to estimate. To address this problem and propose patient-specific 3D electric field simulation in the cochlea, we propose an adaptive cochlear model based on parametric descriptions. Using micro-CT images, this model is quickly adapted to the scanned cochlea in terms of the cochlea shape and the position of the implanted electrode array.
In previous researches, cochlear model are often validated through indirect approaches. For instance, comparing the sim-ulated input impedance of each electrode with the impedance measurement of a real cochlea implant is a commonly used method [7], [13]. However, since the input impedance is measured between pairs of electrodes, this validation method does not cover multi-channel stimulation, which is commonly performed by the actual implants [14]. In this paper, we also demonstrate a novel validation approach which directly measures the electric potential during a variety of stimulation configurations. The potential data is recorded in the cochlea of an implanted human specimen with high sampling rate and amplitude resolution. The acquired data is compared to the simulation results in terms of stimulation patterns, stimulating positions and measuring positions.
II. METHOD
A. Electric field simulation
Patient-specific geometric details, such as the placement of the electrode array inside the cochlea, are closely correlated to the performance of a cochlear implant [12]. Yet the exact causes of performance variations are still not clear. Motivated by the lack of a simulation tool on this aspect, we developed a parametrical modeling approach that is able to adapt to a specified cochlea through micro-CT images.
Simulation of the electric field is equivalent to solving a Poisson equation (1) in 3D:
∇ · (σ∇ϕ) = 0 (1) in which ϕ is the 3D electric potential distribution and σ represents the conductivity distribution of the tissues. In our simulation, equation 1 is solved via a symmetric boundary element method (BEM) approach [15]. The BEM is economi-cal compared to FEM because it only requires surface meshes as geometrical input. In our parametric model, these meshes are created by rotating the cross-section of the cochlea in a cylindrical coordinate system. The output of the simulation is the value of the electric potential at a set of fixed positions
within the cochlea. These virtual measurement points are organized along 200 virtual auditory nerve fibers, stretching from the base to the apex of the cochlea. Each fiber contains 50 measurement points, located from the peripheral process to the central axon, and depicted as red curves in Fig 1.
Fig. 1. The parametric cochlear model with different parts marked out by color: (scala tympani(ST) and scala vestibuli(SV), light green), (nerve tissue, yellow); (electrode array, light blue); (metal electrodes, dark blue) and (nerve fibers, red). Only one out of 5 nerve fibers is plotted for image clarity.
B. Geometrical adaptation
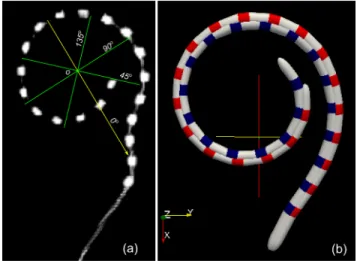
Our experimental setup involved an EVO electrode array (Neurelec-Oticon Medical) implanted in the right cochlea of a human cadaver. The EVO array has a total length of 25mm, with 20 equally spaced cylindrical platinum contacts. The implanted temporal bone was placed into a Micro-CT which provided a high resolution 3D scan of the cochlea (resolution 24.8µm in each direction). As the first step of adapting the 3D model, the same cylindrical coordinate system used by the parametric model is defined in the scan data using the methods from [16], [17]. The polar axis inside the scan is shown in Fig 2(a) as the yellow arrow, while the longitudinal axis is pointing from the centre of the modiolus to the apex of the cochlea, parallel to the view direction.
Fig. 2. Position of the electrodes extracted from micro-CT scan (a). Yellow arrow is the polar axis of the cylindrical coordinate system, green lines are the locations of the cross-sections images shown in Fig 3. Compared with 3D electrode array model in (b). The blue and the red array each represents the position of the electrode array before and after adaption.
Fig. 3. Vertical cross-sections of the cochlea at four angular coordinates. Green curves are the manually segmented ST and SV, separated by the estimated position of the basilar membrane (yellow line). The red curve is the apex of the cochlea where the ST and SV cannot be separated.
h
w
α
x y
Fig. 4. Cross-section of the ST and the implanted electrode array (dotted red circle) from the parametric model, adapted to the micro CT scan using the 5 parameters given in the plot.
The scan data allows to adapt the positioning of the electrode array, as well as the shape of the ST with the parameters given in Fig. 4: width w, height h and tilt angle α of ST; coordinate (x,y) of the electrode in relation to the ST. The values of these parameters are measured from vertical cross-section images taken at 4 different rotation angles along the longitudinal axis, as shown in Fig 2(a). Manually segmented images of the cochlea are shown in Fig 3. w, h and α, plus the pre-defined width of the basilar membrane, generate 5 key points (blue dots in Fig. 4) that create the cross-section of ST through interpolation.
C. Intra-cochlear stimulation and acquisition platform
We devised an original experiment setup for in-situ vali-dation, by implanting by cochleostomy the left cochlea of a human cadaver. A home-designed stimulation and acquisition platform allowed to measure the intra-cochlear potential result-ing from stimulation with an EVO electrode array. On a multi-channel electrode array, different multi-channels can be activated at the same time to create a desired electric field pattern inside the cochlea [14], [18]. To record this field pattern, our system combines the stimulation research platform with a multi-channel recording circuit. The system diagram is shown in Fig 5. The final ST cross-section is created from the interpolation
In the stimulation part of the system, a stimulation chip is connected to a 20 channel electrode array and a reference as in the actual implant. The chip belongs to a research platform, which generates different stimulation sequences according to user’s configuration. The reference electrode is placed between the skull and the scalp at the same side of the head as the implanted cochlea. It is a platinum spherical contact with a diameter of 1.5mm.
In order to measure the electric potential generated by the stimulation, the 20 wires from the electrode array are also connected to an analog multiplexer that leads to the recording part of the system. Since an open circuit is easily corrupted by interference from the environment, the output of the multiplexer is connected to the reference via a 10kΩ resistor to create a loop in the circuit. The two leads of the resistor are connected to the input of a differential probe, which keeps the stimulation part isolated from outside while extracting the differential signal to the digital oscilloscope. Finally, the digital oscilloscope samples the signal at 5MHz sampling rate and 16bits amplitude resolution. The sampled data is sent to PC for storage and analysis. During the recording process, each stimulation waveform is programmed to repeat 20 times. In each repetition, an analog multiplexer connects one of the 20 electrodes to the input of the recording part, so waveforms conducted by the cochlear tissue can be recorded at the electrode positions.
EVO electrode array
analog multiplexer Multiplexer control Differential probe -+ Digital Oscilloscope PC Reference Electrode Implanted Outside
...
...
C=47nF Is Stimulation chip R=10kΩFig. 5. Diagram of the stimulation - recording system.
In a modern cochlear implant system, the different strate-gies to stimulate auditory nerve fibers involve changing the waveform, the duration and intensity of stimulation and the spatial layout of the stimulation electrodes. Those variable parameters are configured as follows in the stimulation ex-periment:
1) Stimulation waveform: During the stimulation, each
electrode can be assigned to one of the following modes: output / passive discharge or high impedance. The stimulation waveform is created by switching between the modes given above. Fig 6 plots a stimulation waveform used by the experi-ment. A relatively long period of passive discharge follows the output mode in order to absorb the residual unbalanced charge caused by the error of the stimulation chip.
2) Spatial stimulation modes: Besides switching the work
modes of one electrode in time, configuring the electrodes to
0 50 100 150 200 250 300 −1000 −500 0 500 1000 T (us) I (u A) Plateau
Fig. 6. Plateau stimulation waveform. Colors indicate the work modes of the electrode: (black, high impedance); (blue, output); (green, passive discharge).
work at different modes at the same time creates a spatial stimulation pattern. In this experiment, we measure the electric potential with the following spatial patterns:
• Monopolar. Only one electrode is assigned to output mode while the rest are set to high impedance mode.
• Bipolar. A pair of neighbouring electrodes are as-signed to the output mode but one sends the opposite stimulation waveform from the other. All the other electrodes are set to high impedance.
• BP + n. Same as BP, but the two stimulating electrodes have n electrodes in between. Here we set n to 3.
• Tripolar. 3 neighbouring electrodes are assigned to output mode. The middle one sends the stimulation waveform with a +1 gain factor while its two neigh-bours send the same waveform at −1/2 gain. Besides the configurations given above, due to the circuit topology given in Fig 5, the reference electrode is always assigned to passive discharge mode during simulations.
For each spatial stimulation pattern, all waveforms with the amplitude and duration configurations above will be used. In the monopolar mode, each electrode is used once as the stimulating electrode. In other modes, the stimulation is repeated at least on 2 different positions on the electrode array. The combination of parameters given above makes a com-prehensive measurement scenario which covers most of the realistic stimulation settings.
III. RESULTS AND DISCUSSION
The in-situ validation discussed here concerns the spatial current distribution. The output of the model is the electric potential simulated along 200 auditory nerve fibers. Fig 7. gives an example of the output when performing bipolar stimulation between the 12th and 13th electrodes.
To compare the simulation with the potential measured on the implanted electrodes, we chose the measurement point closest to the electrode array on each nerve fiber, and create a 200 point potential plot along the scala tympani. Since there is gain error between the simulation output and the measurements, each simulation output zoomed with a factor to match the amplitude of the measurements.
The global error between the simulation and the measure-ments can be described using the Relative Difference Measure
Fig. 7. 3D electric field distribution of a bipolar stimulation.
(RDM) computed in the following way:
RDM (gs, gm) = gs ∥gs∥ − gm ∥gm∥ (2) In equation 2, gs is the simulation output while gm is the
potential measured during the stimulation. The results are given in table I.
Plots of the potential distribution over different spatial stimulation patterns is shown in Fig 8. Four different patterns are compared: monopolar, bipolar, tripolar and BP+3 . The results show a generally good match between the simulation output and the measured potential. However, the details of the error indicate that the simulation accuracy can be further improved with more accurate geometry or even conductivity adaption. For example, all the measured potentials have a small step between the 10th and the 11th electrode, suggesting the affect of an unknown geometry factor in that position.
TABLE I. RDMOVER DIFFERENT STIMULATION PATTERNS
Spatial pattern Monopolar Bipolar Tripolar BP+3 Average RDM 0.155 0.148 0.179 0.134 0.154 0 0.5 1 1.5 2 2.5 −8 −6 −4 −2 0 2 4 6 8
Comparison of Bipolar Stimulation
Cochlear Turns E le c tri c P o te n ti a l simulation results measurements 0 0.5 1 1.5 2 2.5 4 6 8 10 12 14 16
Comparison of Monopolar Stimulation
Cochlear Turns El e ct ri c Po te n ti a l measurements simulation results 0 0.5 1 1.5 2 2.5 −1 −0.5 0 0.5 1 1.5 2 2.5 3 3.5
Comparison of Tripolar Stimulation
Cochlear Turns E le ct ri c Po te n ti a l simulation results measurements 0 0.5 1 1.5 2 2.5 −8 −6 −4 −2 0 2 4 6 8 Comparison of BP+3 Stimulation Cochlear Turns El e c tri c P o te n ti a l simulation results measurements
Fig. 8. 3D electric field distribution of a bipolar stimulation.
The validation process shows the importance of consider-ing geometrical details in order to acquire higher simulation accuracy with 3D cochlear models, which was done here by adapting the model to micro-CT scan data. The validated
model will provide more insight into the interaction between the stimulation pattern and the cochlear geometry, and help the design of personalized cochlear implants in the future.
REFERENCES
[1] B. Wilson and M. Dorman, “Cochlear implants: current designs and future possibilities.” Journal of rehabilitation research and development, vol. 45, no. 5, pp. 695–730, 2007.
[2] F.-G. Zeng, S. Rebscher, W. Harrison, X. Sun, and H. Feng, “Cochlear implants: system design, integration, and evaluation,” IEEE Reviews in
Biomedical Engineering, vol. 1, pp. 115–142, 2008.
[3] Q. Tang, R. Ben´ıtez, and F.-G. Zeng, “Spatial channel interactions in cochlear implants,” Journal of neural engineering, vol. 8, no. 4, p. 046029, 2011.
[4] M. D. McDonnell, A. N. Burkitt, D. B. Grayden, H. Meffin, and A. J. Grant, “A channel model for inferring the optimal number of electrodes for future cochlear implants,” Information Theory, IEEE Transactions
on, vol. 56, no. 2, pp. 928–940, 2010.
[5] J. J. Briaire and J. H. Frijns, “3d mesh generation to solve the electrical volume conduction problem in the implanted inner ear,” Simulation
Practice and Theory, vol. 8, no. 1, pp. 57–73, 2000.
[6] F. Sibella, M. Parazzini, A. Pesatori, A. Paglialonga, M. Norgia, P. Ravazzani, and G. Tognola, “Modeling and computation of electric potential field distribution generated in cochlear tissues by cochlear implant stimulations,” in 3rd International IEEE/EMBS Conference on
Neural Engineering. IEEE, 2007, pp. 506–509.
[7] C. T. Choi, W.-D. Lai, and S.-S. Lee, “A novel approach to compute the impedance matrix of a cochlear implant system incorporating an electrode-tissue interface based on finite element method,” IEEE
Transactions on Magnetics, vol. 42, no. 4, pp. 1375–1378, 2006.
[8] B. H. Bonham and L. M. Litvak, “Current focusing and steering: Modeling, physiology, and psychophysics,” Hearing research, vol. 242, no. 1-2, p. 141, 2008.
[9] J. Briaire and J. Frijns, “The consequences of neural degeneration regarding optimal cochlear implant position in scala tympani: a model approach.” Hearing research, vol. 214, no. 1-2, p. 17, 2006. [10] C. T. Choi and S. P. Wang, “Modeling ecap in cochlear implants using
the fem and equivalent circuits,” IEEE Transactions on Magnetics, vol. 50, no. 2, pp. 49–52, 2014.
[11] J. Briaire and J. Frijns, “Unraveling the electrically evoked compound action potential.” Hearing research, vol. 205, no. 1-2, p. 143, 2005. [12] C. C. Finley and M. W. Skinner, “Role of electrode placement as a
contributor to variability in cochlear implant outcomes,” Otol Neurotol, vol. 29, no. 7, p. 920, 2008.
[13] R. K. Kalkman, J. J. Briaire, D. M. Dekker, and J. H. Frijns, “Place pitch versus electrode location in a realistic computational model of the implanted human cochlea,” Hearing research, vol. 315, pp. 10–24, 2014.
[14] J. A. Bierer and K. F. Faulkner, “Identifying cochlear implant channels with poor electrode-neuron interface: partial tripolar, single-channel thresholds and psychophysical tuning curves,” Ear and hearing, vol. 31, no. 2, p. 247, 2010.
[15] A. Gramfort, T. Papadopoulo, E. Olivi, and M. Clerc, “OpenMEEG: opensource software for quasistatic bioelectromagnetics,” Biomedical
engineering online, vol. 9, no. 1, p. 45, 2010.
[16] B. M. Verbist, M. W. Skinner, L. T. Cohen, P. A. Leake, C. James, C. Bo¨ex, T. A. Holden, C. C. Finley, P. S. Roland, J. T. Roland Jr
et al., “Consensus panel on a cochlear coordinate system applicable
in histological, physiological and radiological studies of the human cochlea,” Otol Neurotol, vol. 31, no. 5, p. 722, 2010.
[17] J. R. Clark, F. M. Warren, and J. J. Abbott, “A scalable model for human scala-tympani phantoms,” Journal of Medical Devices, vol. 5, no. 1, p. 014501, 2011.
[18] D. M. Landsberger, M. Padilla, and A. G. Srinivasan, “Reducing current spread using current focusing in cochlear implant users,” Hearing