ORIGINAL ARTICLE
Maximum tumor diameter adjusted to the risk profile predicts
biochemical recurrence after radical prostatectomy
Georg Müller&Malte Rieken&Gernot Bonkat&Joel Roman Gsponer&Tatjana Vlajnic&
Christian Wetterauer&Thomas C. Gasser&Stephen F. Wyler&Alexander Bachmann&
Lukas Bubendorf
Received: 11 March 2014 / Revised: 29 June 2014 / Accepted: 8 August 2014 / Published online: 17 August 2014 # Springer-Verlag Berlin Heidelberg 2014
Abstract Currently, no consensus exists on the best method for tumor quantification in prostate cancer (PCA), and its prognostic value remains controversial. We evaluated how a newly defined maximum tumor diameter (MTD) might con-tribute to the prediction of biochemical recurrence (BCR) in a consecutive series of PCA patients treated with radical pros-tatectomy (RP). Patients with PCA who underwent RP with-out neoadjuvant therapy at a single center were included for analysis. MTD was defined as the largest diameter of all identified tumors in all three dimensions (i.e., length, width, or depth) of the prostate (“Basel technique”). Cox regression models addressed the association of MTD with BCR in three risk groups (low risk—prostate-specific antigen (PSA)< 10 ng/ml, pT2, and Gleason score (GS)≤6; intermediate risk—PSA≥10 and <20 ng/ml and/or pT2 and GS=7; high risk—PSA>20 ng/ml or pT3 or GS≥8) and whole cohort. Within a median follow-up of 44 months (interquartile range (IQR) 23–66), 48 patients (9.4 %) in the intermediate-risk and high-risk groups experienced BCR. In multivariate Cox re-gression analysis, PSA, pathological stage (pT stage), GS, positive surgical margins (PSMs), and MTD>19.5 mm were independent predictors for BCR (p<0.05). In subgroup anal-ysis, MTD as a nominal variable (<24.5 and >24.5 mm) was the only independent predictor of BCR in the intermediate-risk group (hazard ratio (HR) 9.933, 95 % confidence interval (CI) 2.070–47.665; p<0.05). MTD is an independent risk factor of BCR in PC patients after RP. The combination of
the MTD with other well-known prognostic factors after RP may improve decision-making concerning follow-up intensity or adjuvant treatment.
Keywords Prostate cancer . Radical prostatectomy . Biochemical recurrence . Maximum tumor diameter . Tumor volume
Introduction
The value of tumor quantitation for prostate cancer (PCA) remains controversial. Despite a current lack of consensus on the appropriate method for tumor volume (TV)/size assess-ment, reporting of this variable has been suggested by the
International Society of Urological Pathology (ISUP) [1]. The
association of TV/size with prostate-specific antigen (PSA), Gleason score (GS), pathological stage (pT stage), positive surgical margins (PSMs), and clinical outcomes was shown in
several previous studies [2–6]. However, the prognostic value
of TV, independent of well-characterized standard clinico-pathologic features, on biochemical recurrence (BCR) is weak
[7]. Taking into account that higher GS, advanced pT stage
with or without PSMs, and positive lymph node status (LN+) are powerful predictors of BCR, some studies provide evi-dence of the independent prognostic value of tumor
quantita-tion on BCR [3–6,8–10]. The correct prediction of the
prob-ability of BCR is crucial to identify proper timing for adjuvant
treatment [11]. This is even more important in patients with
intermediate risk constellation where oncologic benefits and
adverse events of adjuvant treatment need to be balanced [12].
There is no general consensus on how to best quantify tumor in radical prostatectomy specimens, as shown in a survey across 321 pathology laboratories from 15 west
Euro-pean countries [13]. Several methods for tumor quantification
such as TV, maximum tumor diameter (MTD) of the index
G. Müller (*)
:
M. Rieken:
G. Bonkat:
C. Wetterauer:
T. C. Gasser:
S. F. Wyler:
A. BachmannDepartment of Urology, University Hospital Basel, Spitalstrasse 21, 4031 Basel, Switzerland
e-mail: [email protected]
J. R. Gsponer
:
T. Vlajnic:
L. BubendorfInstitute for Pathology, University Hospital Basel, Schönbeinstrasse 40, 4031 Basel, Switzerland
tumor, positive-block ratio estimation, visual estimation, and others have been described showing association with BCR or
not [1]. The commonly used methods are visual estimation of
TV or MTD of the index tumor. Although estimation of the MTD is less time consuming and inexpensive, there is no
consensus on how the index tumor should be designated [1].
In a previous, unpublished study, we developed a new method of assessment of tumor diameter by adding the MTD of all tumor areas along one line after deduction of the diameter of tumor tissue overlapping along this line. Review of over 240 radical prostatectomy showed that modified MTD but not the diameter of the index tumor was a strong independent prog-nostic marker. Therefore, this method was introduced in our daily practice. Here, we tested the predictive value of this newly defined MTD on biochemical recurrence (BCR) in patients treated with radical prostatectomy (RP). Moreover, we assessed how this variable might optimally contribute to BCR prediction together with other pathological features.
Patients and methods
This study was approved by the institutional ethics review board. All patients (n=661) who were treated with either transperitoneal or extraperitoneal laparoscopic RP for PCA between April 2001 and December 2011 at the Department of Urology, University Hospital Basel, Switzerland, were includ-ed for analysis. Patients with incomplete clinical data, lost to follow-up (n=119), or who received neoadjuvant treatment (n=7) were excluded. Patients with LN+ (n=24), those who did not reach undetectable PSA level after surgery, or patients who received immediate androgen deprivation treatment after RP were excluded as well. The final study population consisted of 511 patients. PCA was diagnosed by transrectal ultrasound-guided biopsies.
All specimens were processed at the Institute for Patholo-gy, University Hospital Basel, Switzerland. Apical and dorso-lateral margins were examined by frozen section analysis according to current guidelines of the International Society
of Urological Pathology (ISUP) [14]. Briefly, we used the
cone method for cutting the apex and the base and then performed sagittal slicing of the cones. After overnight fixa-tion in 10 % buffered formalin solufixa-tion, what remained of the prostate gland was sectioned at 3–4-mm intervals along a transverse plane from apex to the base. The external surface had been previously inked. Whole mount tissue slices were embedded and further processed according to routine proce-dures. Formalin-fixed and paraffin-embedded (FFPE) whole mount sections were stained with hematoxylin and eosin (H&E) and prospectively evaluated by two pathologists inde-pendently. The principles of how the greatest diameter was
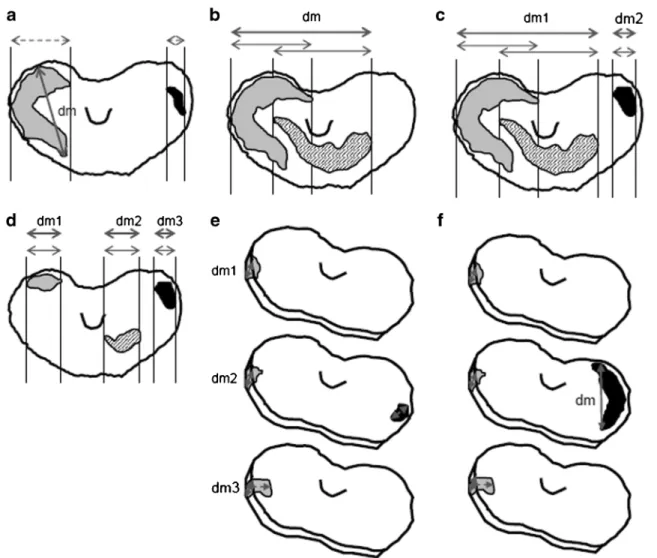
measured are illustrated in Fig.1. The maximum diameter was
calculated as the sum of the largest diameter of all tumor areas
along one line, after deducing the length of overlap of tumor areas along this line. By this method, the maximum tumor diameter never exceeds the size of the whole prostate. If tumors were present in consecutive sections at the same location and orientation, the measurement was performed in the same manner as described above. The largest measure estimated in three dimensions (length, width, and depth) was considered as the MTD. All distances were measured on FFPE
sections with a ruler marked with millimeters (Fig.1).
The predictive value of the MTD for BCR was tested for the whole cohort and for risk groups based on clinicopatho-logical features such as preoperative PSA, pT, and final GS.
Low-risk (PSA<10 ng/ml, pT2 and GS≤6), intermediate-risk
(PSA≥10 and <20 ng/ml and/or pT2 and GS 7), and high-risk (PSA>20 ng/ml or pT3 or GS≥8) groups were composed. BCR was defined as a serum PSA concentration of >0.2 ng/ml in two independent measurements. The date of the first mea-surement was defined as the date of BCR. Follow-up for patients who received adjuvant treatment at the time of PSA≤0.2 ng/ml ended with the day the treatment started.
The cutoff value for MTD that best discriminated low and high risk for BCR was designated by computing the receiver operating curves (ROC) and calculating the Youden index. Due to different clinicopathological features and different MTD values in each group, this was done for the whole cohort and the intermediate-risk and high-risk groups.
The comparison of categorical data and continuous vari-ables was performed using chi-square tests and Mann-Whitney U tests, respectively. Cox regression multivariate models were used to identify factors predictive for BCR. Biochemical recurrence-free survival (BFS) was analyzed by the Kaplan-Meier method, and survival of different groups was compared using log-rank tests. All statistical analyses were performed using the Statistical Package for the Social Sciences (SPSS, version 21.0; Chicago, IL, USA) for Win-dows. A two-sided p value <0.05 was considered significant.
Results
Clinicopathologic features
At the time of operation, patients were on the average 63 years old (interquartile range (IQR) 59–68) and median PSA was 6.68 ng/ml (IQR 4.9–10.3). The most common clinical stage
and Gleason score were T1 (62.4 %) and≤6 (54.7 %),
respec-tively. Only 37/511 patients (7.3 %) had biopsy GS ≥8 and
3/511 (0.4 %) patients had clinical stage T3. Palpable disease or biopsy GS 7 was present in 190/511 (37.2 %) and 194/511 (38 %) cases, respectively. According to final pathological assessment, 79.6 % of the patients (n=407) had organ confined disease. In 67/511 cases (13.1 %), extracapsular extension (ECE) was diagnosed and 37/511 patients (7.2 %) had seminal
vesicle infiltration (SVI). Final GS≤6, 7, and ≥8 was found in 173/511 (33.8 %), 278/511 (54.3 %), and 60/511 (11.9 %) specimens, respectively. PSMs were found in 122/511 patients (23.9 %). The median MTD was 20 mm (IQR 12–26 mm)
(Table1). After median follow-up of 44 months (IQR 24–67),
48 (9.4 %) patients had BCR. Most of BCR (n=38) occurred in the high-risk group followed by intermediate-risk (n=10) group. In the lower-risk group, none of patients had BCR. Association of MTD with biochemical recurrence
The estimated cutoff values for MTD were 19.5 mm (area under the curve (AUC) 0.763, 95 % confidence interval (CI) 0.702–0.825; p<0.001), 24.5 mm (AUC 0.794, 95 % CI 0.658–0.931; p=0.002), and 27.5 mm (AUC 0.590, 95 % CI
0.486–0.694; p=0.053) for the whole cohort,
intermediate-risk, and high-risk groups, respectively. Patients with higher MTD than the estimated cutoff value showed a significantly worse BFS than patients with smaller MTD in the entire cohort, intermediate-risk, and high-risk groups, respectively
(p<0.05) (Fig.2).
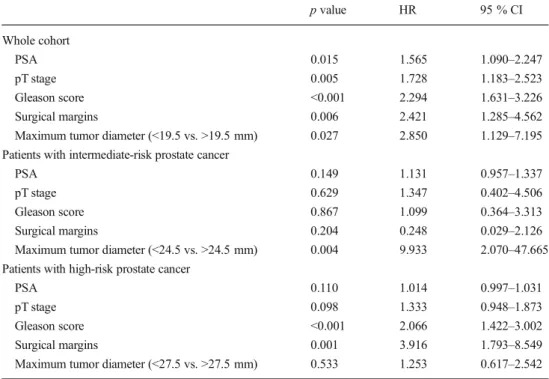
In multivariate Cox regression analyses, PSA (hazard ratio (HR) 1.565, 95 % CI 1.090–2.247; p=0.015), pT stage (HR 1.728, 95 % CI 1.183–2.523; p=0.005), final GS (HR 2.294, 95 % CI 1.631–3.226; p<0.001), PSM (HR 2.421, 95 % CI 1.285–4.562; p=0.006), and MTD>19.5 mm (HR 2.850, 95 % CI 1.129–7.195; p=0.027) were independent predictors for BCR for the whole cohort. In subgroup analysis, MTD> 24.5 mm was the only independent prognostic factor for BCR in the intermediate-risk group (HR 9.933, 95 % CI 2.070– 47.665; p=0.004), whereas PSA, pT stage, final GS, and PSM
were not associated with BCR (Table2).
Fig. 1 Largest diameter (dm) measured in the horizontal and vertical planes. a Largest dm in the horizontal plane including two non-overlap-ping tumors. b Largest dm in the horizontal plane including two partly overlapping tumors. c Largest dm in the horizontal plane including several partly overlapping tumors (largest dm=dm1+dm2). d Largest dm in the horizontal plane including several non-overlapping tumors (largest dm = dm1 + dm2 + dm3). e Largest dm in the vertical plane
including two non-overlapping tumors (largest dm=dm1+dm2+dm3). f Largest diameter in the horizontal plane including two non-overlapping tumors. Thick gray double arrows=diameters that define the largest diameter; thin gray double arrows=tumor diameters including overlap of individual tumors in one axis; dashed gray arrows=diameters that are irrelevant for the largest diameter
Discussion
In this consecutive series of PCA patients treated with RP, we found that MTD using a novel method of assessment contrib-utes to the prediction of BCR. For the whole cohort, MTD> 19.5 mm was significantly predictive, and for patients with intermediate risk constellation, MTD>24.5 mm was the only independent predictor of BFS.
The most common approach for MTD estimation is to
measure only the largest (index) tumor [8], as it might have
a major impact on BCR [15]. However, the data on measures
of tumor extent in RP remain controversial, as summarized in
Table 3. Recent studies highlighted the frequent PCA
multifocality with the dominant tumor not always
representing all poorly differentiated elements [16]. Thus,
there is no consensus about the final definition of the index or dominant tumor and, as a consequence, the correct
estima-tion of the MTD [1]. Our method includes measurement of
extension of all identified tumors in three dimensions. Initial evaluation of the prognostic ability of MTD in terms of BCR in a series of 464 men showed that tumors <1 cm have longer BFS (two consecutive detectable PSA values) than tumors
>2 cm [4]. Multivariate analyses revealed that MTD, PSA,
ECE, or LN+ are independent predictors of BCR. This was confirmed by a study in which the authors found MTD (HR 1.7, p=0.011) and GS to be independent determinants for BCR (PSA>0.2 ng/ml), although LN+ and PSA were not
included in the multivariate analysis [9]. The most recent
study included 364 patients treated with RP and showed a strong independent prognostic value of MTD>20 mm for
BCR (HR 3.07, p<0.001) [3]. PSA was omitted in the
analy-sis. In all referred studies, MTD was defined as a largest diameter of the largest tumor.
In contrast, in the most recent series consisting of 781 patients, MTD was not significantly associated with BCR
when adjusted for PSM [17]. In contrast, PCA with a MTD
>13 mm (median MTD value) in patients with a preoperative
PSA <10 ng/ml, pT stage≤pT3a, and GS 3+4=7 and without
PSM was associated with poor BFS. Dvorak et al. concluded that a larger MTD in these cases might serve as trigger for
adjuvant treatment [17]. Our results confirm this notion, even
though the risk stratification and cutoff value for MTD were different. Another European study investigated the prognostic value of MTD for BCR (PSA>0.1 ng/ml) in 542 PCA patients
treated with RP [18]. Patients were stratified in three risk
groups according to the D’Amico criteria [19]. Univariate
analysis of MTD (continuous variable) revealed a weak asso-ciation with risk of BCR (HR 1.02) which could not be detected in the high-risk group. PSM, GS, pT stage, and multiple tumors were independent prognostic factors in mul-tivariate analysis. Interestingly, tumor quantity parameters
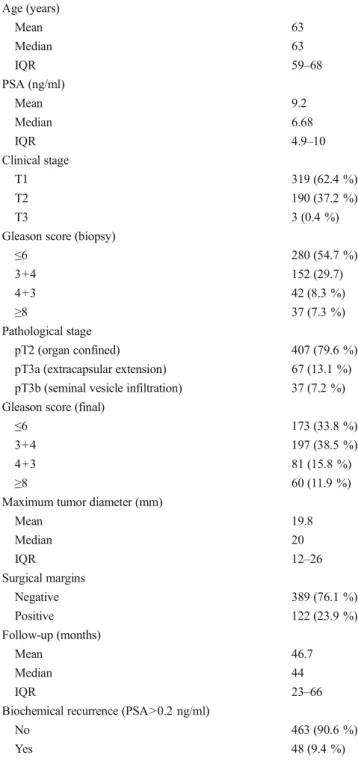
Table 1 Clinicopathologic characteristics and oncologic outcome Age (years) Mean 63 Median 63 IQR 59–68 PSA (ng/ml) Mean 9.2 Median 6.68 IQR 4.9–10 Clinical stage T1 319 (62.4 %) T2 190 (37.2 %) T3 3 (0.4 %)
Gleason score (biopsy)
≤6 280 (54.7 %) 3+4 152 (29.7) 4+3 42 (8.3 %) ≥8 37 (7.3 %) Pathological stage pT2 (organ confined) 407 (79.6 %) pT3a (extracapsular extension) 67 (13.1 %) pT3b (seminal vesicle infiltration) 37 (7.2 %) Gleason score (final)
≤6 173 (33.8 %)
3+4 197 (38.5 %)
4+3 81 (15.8 %)
≥8 60 (11.9 %)
Maximum tumor diameter (mm)
Mean 19.8 Median 20 IQR 12–26 Surgical margins Negative 389 (76.1 %) Positive 122 (23.9 %) Follow-up (months) Mean 46.7 Median 44 IQR 23–66
Biochemical recurrence (PSA>0.2 ng/ml)
No 463 (90.6 %)
Yes 48 (9.4 %)
IQR interquartile range
Fig. 2 a–c Kaplan-Meier curves depicting biochemical recurrence-free survival in 511 patients with prostate cancer treated with radical prostatectomy according to maximum tumor diameter: a all patients (*p<0.001), b intermediate-risk PCA patients (*p<0.001), and c high-risk PCA patients (*p=0.025). d, e Corresponding receiver operating curves depicting predictive value of biochemical recurrence-free survival: d all patients (AUC 0.763, 95 % CI 0.702–0.825; p<0.001), e intermediate-risk PCA patients (AUC 0.794, 95 % CI 0.658–0.931; p= 0.002), and f high-risk PCA patients (AUC 0.590, 95 % CI 0.486–0.694; p=0.053). *log-rank test
a
<19.5 mm 251 203 143 81 28 8 1 >19.5 mm 258 156 90 51 17 7 0b
<24.5 mm 153 117 80 49 13 7 1 >24.5 mm 65 44 26 12 5 1 0c
<27.5 mm 95 66 39 26 5 3 1 >27.5 mm 54 21 14 10 4 2 0d
e
f
No discrimination MTD No discrimination MTD No discrimination MTD(MTD and TV) did not provide any additional information regardless of risk stratification. For high-risk PCA, MTD did not provide any further information on BCR prediction, as we found in our study. Although in our study median value in the whole cohort was smaller (19.5 mm vs. 24 mm), MTD was an independent predictor of the BCR.
Another yet less commonly used parameter for tumor
quantitation is TV [13]. The initial evaluation of the predictive
ability of TV on BCR was discouraging. Epstein at al. found that only GS and PSM are independent predictors for cancer progression (increase in postoperative PSA, local recurrence, and/or presence of distant metastases) in patients with
organ-confined disease after RP [20]. Ohori et al. included in the
analysis 478 patients with clinically localized PCA treated with RP and found ECE and SVI among with GS to be
independent prognostic factors for cancer progression [21].
TV did not have any prognostic value in either study. While Salomon et al. had similar results in their study, progression
was defined as BCR (PSA>0.2 ng/ml) [22]. In our analysis
LN+ patients were omitted for the multivariate analysis, as its strong prognostic value on progression and cancer-specific
survival is well established [23]. Also in a recent study on
344 patients from ERSPC (Rotterdam section) with a long follow-up (mean 96.2 months), the prognostic value of TV was assessed. Age at RP, GS 4+3=7, and PSMs were predic-tive for BCR but none of the reported TV-related variables
(TV, relative TV, and TV>0.5 ml) [24].
Another study provided confusing results by analyzing predictive determinants for PSA failure (≥0.07 ng/ml) in 379
cases after RP [25]. TV was a highly significant and
independent predictor of BCR tested in a multivariate model with the percentage of Gleason grade 4/5, LN+, and vascular invasion. Only the largest tumor detected in the specimens was used for further investigation. Chun et al. published corresponding data in which PSA, ECE, TV, and percentage of high-grade Gleason TV (%HGTV) were predictors of BCR
(PSA>0.1 ng/ml) [10]. LN+, SVI, and PSM were included in
the model, but showed no significant association with risk of BCR. The authors concluded that %HGTV is a powerful predictor of BCR after RP, confirming previous publications
[25–28]. Yet another study tested the prognostic value of the
percentage of TV (sum of all visually estimated tumor foci in relation to the specimen on every section) in terms of BCR
(PSA>0.2 ng/ml) [29]. In multivariate analysis, PSA, final
GS, and percent TV were independent predictors of BCR, whereas PSM, pT stage, and LN+ failed to reach significance. Our study is limited by its retrospective nature and short follow-up time. The low number of BCR is at least in part caused by patients with a high-risk constellation (PSA< 0.2 ng/ml) who already received or rapidly entered into adju-vant treatment. Furthermore, clinical outcome data on local recurrence, metastasis, and mortality were not available. Fi-nally, our cohort contained a high number of organ confined PCAs (79.6 %), a main prognostic factor even though most of
them had Gleason score≥7 (72.2 %).
We conclude that MTD assessed by our novel method might be a useful additional prognostic factor for the predic-tion of BFS in patients after RP. Especially in patients with intermediate-risk constellation, MTD may influence decision making regarding adjuvant treatment.
Table 2 Multivariate Cox re-gression analysis for determinants predicting biochemical recurrence in a whole cohort and patients with intermediate-risk and high-risk prostate cancer
p value HR 95 % CI Whole cohort PSA 0.015 1.565 1.090–2.247 pT stage 0.005 1.728 1.183–2.523 Gleason score <0.001 2.294 1.631–3.226 Surgical margins 0.006 2.421 1.285–4.562 Maximum tumor diameter (<19.5 vs. >19.5 mm) 0.027 2.850 1.129–7.195 Patients with intermediate-risk prostate cancer
PSA 0.149 1.131 0.957–1.337
pT stage 0.629 1.347 0.402–4.506 Gleason score 0.867 1.099 0.364–3.313 Surgical margins 0.204 0.248 0.029–2.126 Maximum tumor diameter (<24.5 vs. >24.5 mm) 0.004 9.933 2.070–47.665 Patients with high-risk prostate cancer
PSA 0.110 1.014 0.997–1.031
pT stage 0.098 1.333 0.948–1.873 Gleason score <0.001 2.066 1.422–3.002 Surgical margins 0.001 3.916 1.793–8.549 Maximum tumor diameter (<27.5 vs. >27.5 mm) 0.533 1.253 0.617–2.542
Ta b le 3 Overview o f publications on tumor qua ntification for prostate cancer Author Y ear Quantification method Median fol low -up Num b er of patients En d points M ultivariate analys es Conclusions Rens haw et al. [ 8 ] 1998 Greates t dimension o f the lar g es t single focus 27.2 5 7 T wo consecutive de te ct ab le P S A values PSA (RR 1 .066; p = 0 .017) “… gre ate st tumor d imen sion … is a p redictor of PSA failure …” Stage T 3c/LN+ (RR 3 .389; p = 0 .015) MTD (RR 1.1 17; p = 0 .057) Ei chel ber g er al . [ 9 ] 2005 Greates t diameter of the lar g es t single focus 12 364 PSA ≥ 0.1 ng/ml PSMs (HR 1.78; p = 0 .084) “MTD is a significant predictor of B C R ” GS (H R 1 .9; p < 0 .0 001) MTD (HR 1.7; p =0 .0 1 1 ) Fukuhara et al. [ 3 ] 2010 Lar g es t d iameter o f the la rg es t tumo r 33 364 PSA > 0 .2 ng/ml Stage > pT2 (HR 2.53; p = 0 .003) “… MTD is independent prognostic factor for B C R ” GS > 6 (HR 1 .99; p =0 .0 3 7 ) PSMs (HR 3.87; p < 0 .001) MTD > 20 (HR 3 .07; p = 0 .037) Dvor ak et al . [ 17 ] 2005 Maximal d imension of the lar g es t single focus 65 781 PSA > 0 .2 ng/ml PSA (HR 1 .02 ; p < 0 .0001) “… the M TRD v alue may serve as a p roxy for sur gical m ar gin st atus …” GS > 6 (HR 2 .96; p = 0 .00 02) Stage p T3b (HR 9.38; p < 0 .0001) PSMs (HR 1.71; p = 0 .0004) MTD (HR 1.03; p = 0 .07) van O ort et al. [ 18 ] 2008 Lar g es t d iameter o f the la rg es t tumo r consi d er ed in tw o d imensio n s; tota l tu mor volume; volume of the lar gest tu mor 39.5 542 PSA > 0 .1 ng/ml Stage p T3b (HR 1.79; p < 0 .05) “… MTD is not an ind ependent pr edic tor for BCR ” GS > 6 (HR 1 .97; p <0 .0 5 ) PSMs (HR 3.75; p < 0 .05) NT (1.18; p < 0 .05) O h o rie ta l. [ 21 ] 1995 T o tal tumo r volume 3 2 478 PSA progression or loc al recur re n ce or dis tant m et asta ses SMI (HR 4.38; p = 0 .0001) “TV and PSM failed to provide significant contribution o n prognosis of BCR ” GS (HR 1 .97; p = 0 .0001) ECE (HR 3.3; p = 0 .0015) TT V (p = 0 .25) PSMs (0.3 21) Sal o mon et al. [ 22 ] 2003 T o tal tumo r volume 63.6 200 BCR Stage (p = 0 .0002) “TV does not provide additional prognostic information ” GS > 6 (p = 0 .04) PSMs (p = 0 .12) TT V (p = 0 .35) Wo lt er s et al . [ 24 ] 2010 T o tal tumo r volume, relative tumor volume 96.2 344 PSA > 0 .2 ng/ml Age (HR 1.1; p = 0 .008) “TTV d id n o t add progno stic va lue to routine ly asse sse d pathologic p arameters .” SVI (HR 2.32; p = 0 .327) GS 4 + 3 (HR 5.95; p < 0 .0001) PSM (HR 3 .84; p < 0 .0001) TTV (HR 0.95; p = 0 .517) S tam ey et al . [ 25 ] 1999 Index tumor volume 68.7 379 PSA > 0 .07 ng/ml ITV (HR 1.68; p < 0 .001) “IT V , G S 4/ 5 % , L N + and V I were independently associated w ith PSA in cr eas ing ” GG 4/5 % (HR 1 .49; p < 0 .001) LN+ (HR 1.004; p < 0 .001)
Conflict of interest We declare that we have no conflict of interest.
References
1. van der Kwast TH, Amin MB, Billis A, Epstein JI, Griffiths D, Humphrey PA, Montironi R, Wheeler TM, Srigley JR, Egevad L, Delahunt B, IPC Group (2011) International Society of Urological Pathology (ISUP) consensus conference on handling and staging of radical prostatectomy specimens. Working group 2: T2 substaging and prostate cancer volume. Mod Pathol 24(1):16–25
2. Mizuno R, Nakashima J, Mukai M, Ookita H, Nakagawa K, Oya M, Ohigashi T, Marumo K, Murai M (2006) Maximum tumor diameter is a simple and valuable index associated with the local extent of disease in clinically localized prostate cancer. Int J Urol 13(7):951– 955
3. Fukuhara H, Kume H, Suzuki M, Fujimura T, Enomoto Y, Nishimatsu H, Ishikawa A, Homma Y (2010) Maximum tumor diameter: a simple independent predictor for biochemical recurrence after radical prosta-tectomy. Prostate Cancer Prostatic Dis 13(3):244–247
4. Renshaw AA, Richie JP, Loughlin KR, Jiroutek M, Chung A, D’Amico AV (1999) Maximum diameter of prostatic carcinoma is a simple, inexpensive, and independent predictor of prostate-specific antigen failure in radical prostatectomy specimens. Validation in a cohort of 434 patients. Am J Clin Pathol 111(5):641–644
5. Nelson BA, Shappell SB, Chang SS, Wells N, Farnham SB, Smith JA Jr, Cookson MS (2006) Tumour volume is an independent pre-dictor of prostate-specific antigen recurrence in patients undergoing radical prostatectomy for clinically localized prostate cancer. BJU Int 97(6):1169–1172
6. Carvalhal GF, Humphrey PA, Thorson P, Yan Y, Ramos CG, Catalona WJ (2000) Visual estimate of the percentage of carcinoma is an independent predictor of prostate carcinoma recurrence after radical prostatectomy. Cancer 89(6):1308–1314
7. Fine SW, Amin MB, Berney DM, Bjartell A, Egevad L, Epstein JI, Humphrey PA, Magi-Galluzzi C, Montironi R, Stief C (2012) A contemporary update on pathology reporting for prostate cancer: biopsy and radical prostatectomy specimens. Eur Urol 62(1):20–39 8. Renshaw AA, Richie JP, Loughlin KR, Jiroutek M, Chung A,
D’Amico AV (1998) The greatest dimension of prostate carcinoma is a simple, inexpensive predictor of prostate specific antigen failure in radical prostatectomy specimens. Cancer 83(4):748–752 9. Eichelberger LE, Koch MO, Eble JN, Ulbright TM, Juliar BE, Cheng
L (2005) Maximum tumor diameter is an independent predictor of prostate-specific antigen recurrence in prostate cancer. Mod Pathol 18(7):886–890
10. Chun FK, Briganti A, Jeldres C, Gallina A, Erbersdobler A, Schlomm T, Walz J, Eichelberg C, Salomon G, Haese A, Currlin E, Ahyai SA, Benard F, Huland H, Graefen M, Karakiewicz PI (2007) Tumour volume and high grade tumour volume are the best predic-tors of pathologic stage and biochemical recurrence after radical prostatectomy. Eur J Cancer 43(3):536–543
11. Bolla M, van Poppel H, Tombal B, Vekemans K, Da Pozzo L, de Reijke TM, Verbaeys A, Bosset JF, van Velthoven R, Colombel M, van de Beek C, Verhagen P, van den Bergh A, Sternberg C, Gasser T, van Tienhoven G, Scalliet P, Haustermans K, Collette L, European Organisation for R, Treatment of Cancer RO, Genito-Urinary G (2012) Postoperative radiotherapy after radical prostatectomy for high-risk prostate cancer: long-term results of a randomised con-trolled trial (EORTC trial 22911). Lancet 380(9858):2018–2027 12. Suardi N, Gallina A, Lista G, Gandaglia G, Abdollah F, Capitanio U,
Dell’oglio P, Nini A, Salonia A, Montorsi F, Briganti A (2014) Impact of adjuvant radiation therapy on urinary continence recovery after radical prostatectomy. Eur Urol 65(3):546–551
Ta b le 3 (continued) Au thor Y ear Quantification m ethod Median follow -up Num b er of patients End points M ultivariate analy ses Con clusions VI (HR 0 .7 93; p < 0 .001) Chun et al. [ 10 ] T otal tumor volume, high-grade tumor volume 43.4 780 PSA ≥ 0.1 n g/ml PSA (RR 1 .01; p = 0 .013) “TV de te rm ine s th e ra te o f P S M an d % H G TV dete rmine s th e rate of BCR ” ECE (RR 2.43; p < 0 .001 TV (RR 1 .03; p = 0 .005) %HGTV (R R 1.03; p < 0 .001) Song et al. [ 29 ] 2012 Percent tumor volume 4 2 1 ,567 PSA > 0 .2 ng/ml PSA (HR 1 .006; p = 0 .012) “… GS, P TV and P S A ar e independent predictors of B C R …” GS (HR 2 .183; p < 0 .0001) PTV (HR 1.393; p < 0 .0001) RR ri sk ra ti o, HR haza rd ra tio , PSA prostate-specific antigen, LN + p ositive lymph n ode status, MTD maximum tumor diameter , GS G lea son scor e, BCR biochemical recurrence, PSMs positive sur gical mar g ins, NT number o f tumors, TT V total tumor volume, RT V relative tumor v olume, ITV index tumor volume, GG S 4 /5 % th e p er ce nt of Gl eas on gr ade 4 /5, SVI seminal v esicle invasion, VI intr apr o sta tic vascular invasion, ECE extracapsular extension, %HGTV the p ercent high-grade G leason volume, PT V percent tumor volume
13. Egevad L, Algaba F, Berney DM, Boccon-Gibod L, Griffiths DF, Lopez-Beltran A, Mikuz G, Varma M, Montironi R, European Network of U (2008) Handling and reporting of radical prosta-tectomy specimens in Europe: a web-based survey by the European Network of Uropathology (ENUP). Histopathology 53(3):333–339
14. Samaratunga H, Montironi R, True L, Epstein JI, Griffiths DF, Humphrey PA, van der Kwast T, Wheeler TM, Srigley JR, Delahunt B, Egevad L, IPC Group (2011) International Society of Urological Pathology (ISUP) consensus conference on handling and staging of radical prostatectomy specimens. Working group 1: spec-imen handling. Mod Pathol 24(1):6–15
15. Wise AM, Stamey TA, McNeal JE, Clayton JL (2002) Morphologic and clinical significance of multifocal prostate cancers in radical prostatectomy specimens. Urology 60(2):264–269
16. Andreoiu M, Cheng L (2010) Multifocal prostate cancer: biologic, prognostic, and therapeutic implications. Hum Pathol 41(6):781–793 17. Dvorak T, Chen MH, Renshaw AA, Loffredo M, Richie JP, D’Amico AV (2005) Maximal tumor diameter and the risk of PSA failure in men with specimen-confined prostate cancer. Urology 66(5):1024– 1028
18. van Oort IM, Witjes JA, Kok DE, Kiemeney LA, Hulsbergen-vandeKaa CA (2008) Maximum tumor diameter is not an indepen-dent prognostic factor in high-risk localized prostate cancer. World J Urol 26(3):237–241
19. D’Amico AV, Whittington R, Malkowicz SB, Cote K, Loffredo M, Schultz D, Chen MH, Tomaszewski JE, Renshaw AA, Wein A, Richie JP (2002) Biochemical outcome after radical prostatectomy or external beam radiation therapy for patients with clinically local-ized prostate carcinoma in the prostate specific antigen era. Cancer 95(2):281–286
20. Epstein JI, Carmichael M, Partin AW, Walsh PC (1993) Is tumor volume an independent predictor of progression following radical prostatectomy? A multivariate analysis of 185 clinical stage B ade-nocarcinomas of the prostate with 5 years of followup. J Urol 149(6): 1478–1481
21. Ohori M, Wheeler TM, Kattan MW, Goto Y, Scardino PT (1995) Prognostic significance of positive surgical margins in radical pros-tatectomy specimens. J Urol 154(5):1818–1824
22. Salomon L, Levrel O, Anastasiadis AG, Irani J, De La Taille A, Saint F, Vordos D, Cicco A, Hoznek A, Chopin D, Abbou CC (2003) Prognostic significance of tumor volume after radical prostatectomy: a multivariate analysis of pathological prognostic factors. Eur Urol 43(1):39–44
23. Gervasi LA, Mata J, Easley JD, Wilbanks JH, Seale-Hawkins C, Carlton CE Jr, Scardino PT (1989) Prognostic significance of lymph nodal metastases in prostate cancer. J Urol 142(2 Pt 1):332–336 24. Wolters T, Roobol MJ, van Leeuwen PJ, van den Bergh RC,
Hoedemaeker RF, van Leenders GJ, Schroder FH, van der Kwast TH (2010) Should pathologists routinely report prostate tumour volume? The prognostic value of tumour volume in prostate cancer. Eur Urol 57(5):821–829
25. Stamey TA, McNeal JE, Yemoto CM, Sigal BM, Johnstone IM (1999) Biological determinants of cancer progression in men with prostate cancer. JAMA 281(15):1395–1400
26. Palisaar RJ, Graefen M, Karakiewicz PI, Hammerer PG, Huland E, Haese A, Fernandez S, Erbersdobler A, Henke RP, Huland H (2002) Assessment of clinical and pathologic characteristics predisposing to disease recurrence following radical prostatectomy in men with path-ologically organ-confined prostate cancer. Eur Urol 41(2):155–161 27. McNeal JE, Villers AA, Redwine EA, Freiha FS, Stamey TA (1990)
Histologic differentiation, cancer volume, and pelvic lymph node metastasis in adenocarcinoma of the prostate. Cancer 66(6):1225– 1233
28. Cheng L, Koch MO, Juliar BE, Daggy JK, Foster RS, Bihrle R, Gardner TA (2005) The combined percentage of Gleason patterns 4 and 5 is the best predictor of cancer progression after radical prosta-tectomy. J Clin Oncol 23(13):2911–2917
29. Song C, Seo S, Ahn H, Byun SS, Cho JS, Choi YD, Lee E, Lee HM, Lee SE, Choi HY (2012) Percent tumor volume predicts biochemical recurrence after radical prostatectomy: multi-institutional data analy-sis. Int J Clin Oncol 17(4):355–360