2010/124
Puerperal symphysis fundus distance: normal values
Sabine Frei, Juozas Kurmanavicius, Roland Zimmermann and Ursula von Mandach*
Department of Obstetrics, Zurich University Hospital, Switzerland
Abstract
Aim: To measure puerperal symphysis fundus distance
(SFD) by two manual methods and to calculate individual normal values.
Study design: Prospective cohort study including women
after single pregnancy without special problems in uterine involution.
Methods: SFD was daily measured on the 1st–5thpostpartum
days by counting the number of midwife’s fingers put hori-zontally on the mother’s abdomen and by a paper tape, respectively. Linear mixed model analysis was performed to determine SFD normal values.
Results: Independent variables determining the SFD on
dif-ferent days after delivery were the gestational age and the delivery mode (finger method) and the maternal age, body mass index (BMI), delivery mode and birth weight (tape method). Individual normal values were calculated by regres-sion equation including the coefficients for the independent variables.
Conclusion: Puerperal SFD values measured by tape have
more independent variables than those measured by fingers and reflect better the actual situation of the patient. It should be verified whether values deviating from normal values of tape measurements may prevent postpartum complications.
Keywords: Cesarean section; gestational age; postpartum
involution; symphysis fundus distance; vaginal delivery.
Introduction
Postpartum uterine involution reduces the uterine size and returns to non-gravid dimensions toward the end of the sec-ond month postpartum. During uterine involution, collagen and elastin decrease immediately. The uterus shrinks from the size of a 20-week gestation to about 350 g by two weeks postpartum. After two weeks, involution continues less
rap-*Corresponding author: Prof. Dr. Ursula von Mandach Department of Obstetrics Zurich University Hospital Frauenklinikstrasse 10 CH–8091 Zurich Switzerland Tel.: q41/44 255 51 36 Fax: q41/44 255 44 30 E-mail: [email protected]
idly. By three weeks postpartum, the endometrium except the placental area, returns to normal. The placental area returns to normal by the 7thweek. Neither retained placental tissue
nor moderate infection keeps the non-placental area from regenerating, but retained placenta does prevent involution. The greater the extent of uterine distension during pregnancy, the longer it takes for endometrial regeneration. Higher par-ity increases the efficiency of uterine involution. Avoiding subinvolution which may be followed by foul-smelling lochia and/or endomyometritis, involution in the early post-partum phase should be monitored daily. Monitoring can be performed estimating the fundal height by manual measure-ment of the symphysis fundus distance (SFD) w1, 3, 4x and/ or by ultrasonographic measurement of the uterine dimension w7–9, 11, 13x. Long-axis measurements correcting for uterine angulations are the most reproducible and accurate, irrespec-tive of bladder distention w13x. There is no measurement more exact than ultrasound, but nonetheless even this is not perfect and the early postpartum uterus is highly susceptible to distortion from trivial pressure applied by the transducer and therefore not really popular. Moreover, ultrasonographic measurements are performed by physicians (in Switzerland), whereas the SFD can be measured by midwifes. Two pos-sibilities for the manual measurement exist: first, by counting the number of midwife’s fingers put horizontally on the mother’s abdomen to determine the distance (D) between the symphysis pubis (S) and the uterine fundus (F) and second, by a paper tape measure quantifying the number of centi-meters from S to F. Based on our experience for many years with the finger method the mean value of a normal involu-tion after single pregnancy is one finger per day. This value corresponding to 1 cm per day is also recommended by Sil-verton w10x. However, there exists a wide variation between the data of different studies or recommendations. The WHO recommends 2 cm per day. In a study comparing the post-partum involution in mothers with vs. without the adminis-tration of methylergometrine w1, 14x found a mean value of 2.2 cm in four days corresponding to 0.5 cm per day (preg-nancies not selected by parity, delivery mode or number of neonates). In a small study with 28 primiparas, Cluett et al. w4x measured the SFD daily within the first 18 days after delivery by a paper tape on which they have marked the distance with a pen. The distance was measured afterwards in cm with a tape measure. In 22 (78.6%) patients the invo-lution did not decrease linearly but included a phase with a delayed involution of -1 cm in three days.
In contrast to the pregnancy SFD for which different nor-mal curves exist, no such curves exist for postpartum invo-lution. It was therefore the objective of the present study to produce normal values for the first days after delivery in a cohort of mothers which gave birth at our department. SFD measurements in all mothers were carried out by manual
Table 1 Demographic data (ns509). Age (years) 29.7"5.6 Height (m) 1.6"0.07 Weight* (kg) 62.2"11.1 BMI* (kg/m2) 22.99"4.01 Gravidity )1 (n) 287 Nulliparity (n) 273 Caucasian (n) 433 African (n) 23 Asian (n) 13 Others (n) 40
Gestational age at delivery (weeks) 38.5"2.8
Preterm delivery (-37.0 weeks) (n) 79
Vaginal delivery (n) 308
Cesarean section (n) 201
Birth weight (g) 3184"37
Sex male/female (n) 253/256
Degree of nursing at 3rdpostpartum day (%)
No 3.7
Partially 63.6
Full 32.7
*Before pregnancy i.e., -7.0 weeks of gestation.
Continuous values: mean"SD (n); nsnumeric values, BMIs body mass index, SDsstandard deviation.
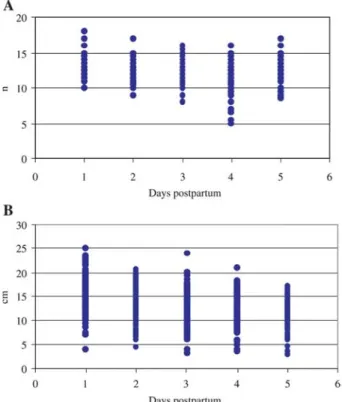
Figure 1 Scattergram showing individual values of symphysis fundus distance measured daily in 509 women after delivery during postpartum hospital stay until the 5thpostpartum day A by finger
(n) and B by tape (cm).
palpation using the fingers as well as the paper tape measure. Data were evaluated in relation to the method, parity, ges-tational age, maternal age, weight and height and the delivery mode.
Methods
Women with a live born infant after single pregnancy were consec-utively recruited from admissions to the Department of Obstetrics, Zurich University Hospital, during four months. All provided writ-ten informed consent for the study which was approved by the local Institutional Review Board. Exclusion criteria were women with multiple pregnancy, stillbirth and fetal malformations. Patients with signs or symptoms of uterine subinvolution (prolonged lochia, pro-fuse vaginal bleeding, large and flabby uterus or the need of oxy-tocic medication) on day 2–5 were secondarily excluded.
All measurements were carried out by midwifes daily between 8:00 and 11:00 a.m. during postpartum hospital stay at least until
the 5thpostpartum day. The women with an empty bladder had to
lie down in the supine position with their arms and legs straight. During measurements the women were not allowed to breastfeed. Manual measurements in each women were performed by two dif-ferent methods: (1) the midwife placed one or more than one finger horizontally on the woman’s abdomen to estimate the fundus above or below the navel (finger methods); (2) the midwife placed one end of a white tape on the patient’s symphysis pubis bone and marked the top of the uterus on it. The distance on the tape was afterwards measured by a measure tape giving the SFD in cm (tape method). At every timepoint only one measurement was carried out and measurements in one woman were not performed always by the same midwife taking into account the real clinical situation. On every day the degree of nursing (no, partial, full) was recorded.
Patient data including the maternal age, weight and height, parity, gestational age and the number of neonates were obtained from the patient notes. The SFD data as well as the data of the degree of nursing were collected daily. All data were given in an Excel file. The primary endpoint was to define independent variables influenc-ing postpartum SFD measured by both methods. The secondary end-points were to define the equation for calculating individual SFD values and to show practical examples of values calculated by this method.
The data were analyzed in StatView 5.0.1 for Windows XP. Mean, standard deviation (SD), standard of the mean, range and median were calculated. Linear mixed model analysis and a post hoc power analysis were performed by SPSS Version 16. P-0.05 was considered significant.
Results
A total of ns509 was selected from 550 women who were delivered during 18 weeks. Most women were Caucasians (ns433; 85%), a minority was Africans (4.5%), Asians (2.5%) and Latinos or Orientals (s8% others; Table 1). A total of 47.8% were multiparae and 60.5% had a vaginal delivery. In the case of cesarean section there was no failure in measuring uterine size in any woman. Mean gestational age at delivery was 38.5 weeks, however, 79 newborns (15.5%) were preterm. At day 3 only 14 women (3.7%) did not nurse their baby because of a contraindications (HIV infections).
The post hoc power analysis considering a relevant dif-ference in SFD of 2 cm (SDs2.5) between women with vaginal delivery and cesarean section measured by tape
Figure 2 Scattergram showing individual values of symphysis fundus distance measured daily by tape (cm) in women during post-partum hospital stay until the 5thpostpartum day A after vaginal
delivery (ns308) and B after cesarean section (ns201).
Table 3 Multiple regression equations to calculate norm post-partum SFD values for the 50th
, 5th and 95th centile, respectively. Centile Equation Finger 50th
11.0009q0.0592=gestational age (week)q0.6760= delivery mode (*)–0.5233=day p.p (n)
5th 50th–1.645=0.6062 95th 50thq 1.645=0.6062 Tape 50th 7.3226q0.0467=age(year)q0.0636=BMI(kg/m2)q
1.2709=delivery mode (*)q0.0006=birth weight (g)–0.9262=day p.p (n)
5th 50th–1.645=2.7827
95th 50thq1.645=2.7827
*0 for vaginal delivery, 1 for cesarean section.
BMIsbody mass index; SFDssymphysis fundus distance.
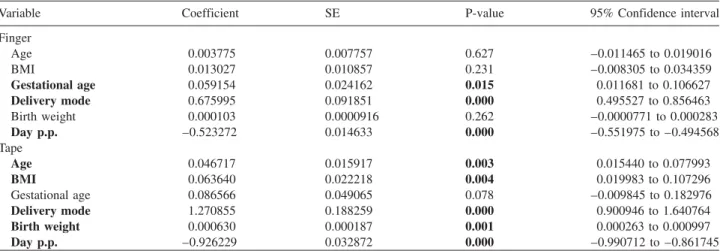
Table 2 Mixed model analysis of independent variables and the dependent variable SFD recorded by finger or tape, respectively.
Variable Coefficient SE P-value 95% Confidence interval
Finger Age 0.003775 0.007757 0.627 –0.011465 to 0.019016 BMI 0.013027 0.010857 0.231 –0.008305 to 0.034359 Gestational age 0.059154 0.024162 0.015 0.011681 to 0.106627 Delivery mode 0.675995 0.091851 0.000 0.495527 to 0.856463 Birth weight 0.000103 0.0000916 0.262 –0.0000771 to 0.000283 Day p.p. –0.523272 0.014633 0.000 –0.551975 to –0.494568 Tape Age 0.046717 0.015917 0.003 0.015440 to 0.077993 BMI 0.063640 0.022218 0.004 0.019983 to 0.107296 Gestational age 0.086566 0.049065 0.078 –0.009845 to 0.182976 Delivery mode 1.270855 0.188259 0.000 0.900946 to 1.640764 Birth weight 0.000630 0.000187 0.001 0.000263 to 0.000997 Day p.p. –0.926229 0.032872 0.000 –0.990712 to –0.861745
BMIsbody mass index, SEsstandard error, SFDssymphysis fundus distance.
resulted in a power of 0.8 (ns20) and 1.0 (ns200), respectively.
SFD values measured by fingers and by tape, respectively, are given in Figure 1. Values are higher after cesarean than after vaginal delivery on every day and involution is slower after cesarean (Figure 2). Multiple linear regression by mixed model analysis discovered the significant influence of the gestational age, the delivery mode and the day postpartum in the finger method (Table 2). If the tape was used, signif-icant independent variables were the maternal age, body
mass index (BMI), delivery mode, fetal birth weight and the day postpartum (Table 2). No influence could be shown for parity, gravidity, fetal sex and degree of nursing. The regres-sion equation including these predictors can be used to cal-culate mean (50th centile) SFD values within the first five
postpartum days. Values for the 5thand the 95thcentiles were
created by correction of the mean value (Table 3).
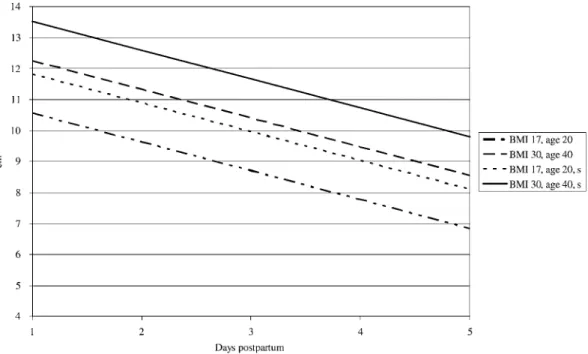
Examples for SFD values estimated from the regression equations related to the postpartum days are given for tape measuring in 20-year-old women with a BMI of 17 and in 40-year-old women with a BMI of 30 once after vaginal delivery and once after cesarean section, respectively (Figure 3).
Discussion
We showed that SFD measured by two different types of manual methods i.e., by fingers and by tape, are not influ-enced by the same independent variables. However, for each
Figure 3 Example of individual puerperal symphysis fundus distance measured by tape (cm) related to the first five postpartum days for four women with different predictors (independent variables) as: age 20 and BMI 17; age 40 and BMI 30; both without or with cesarean section(s).
BMIsbody mass index.
postpartum day the delivery mode is a variable which plays a key role in both methods. There are more variables detected by mixed model analysis influencing the values if measure-ments are performed by tape than by finger. Individual nor-mal values can be calculated from the regression equation including these variables.
This is the first cohort study with sufficient statistical pow-er demonstrating normal values for postpartum SFD meas-ured by two manual methods to estimate uterine involution. In contrast to the measurement of fundal height in pregnancy, until now, only a small number of studies addressed the measurement of postpartum fundus. It includes a smaller number of women than in our study w1, 3, 4x and/or focused on ultrasonographic (US) measures w7, 8, 11, 13x or com-pared manual with US measures w9x. However, our results agree with those of Arabin et al. w1x who demonstrated faster uterine involution after vaginal delivery than after cesarean. In addition, it agrees with those of Cluett et al. 1997 w4x who showed a faster involution on day 1 than on the following days. These observations are in contrast to the recommen-dation of the WHO indicating independently of the day a mean involution (difference of SFD) of 2 cm.
In contrast to the ultrasonographic measurements w13x we were unable to relate between involution and parity, i.e., we could not find faster involution with higher parity. Moreover, our results show new information on the maternal age which is a variable determining the SFD measured by tape: the fundus is lower (mean difference 0.5 cm immediately after delivery) and the involution is faster in a 20-year-(30-year-) old than in a 30-year-(40-year-, respectively) old woman irre-spective of the delivery mode.
We have not undertaken repeated measurement (by the same person on the same day) assuming that measurement taken -2 min apart would not have significant differences and would not also be accepted by the patient. Moreover, this design is reflecting the real clinical situation. Manual methods for measuring SFD are influenced by inter-individ-ual variation of the investigator and the flexibility of the uterus w13x. For the tape measurement on a special postpar-tum day there exist four additional independent variables influencing the values. We assume therefore that the tape measurement is reflecting the actual situation of an individ-ual woman on each postpartum day more accurately than that of the finger method. The tape measurement is therefore the elective method for and the estimation of individual normal values. Regression equations should be added to the software of the electronic patient files, where centiles can be calcu-lated from daily measured values. Values over the 95thcentile
are considered to be pathological indicating subinvolution. Subinvolution is a postpartum complication which is fol-lowed by infection, blood loss and hysterectomy if it is not detected and/or treated w2, 5x. Subinvolution was treated for many years with methylergometrine, which has several dis-advantages. The prostaglandin E analogue misoprostol, rec-ommended for preventing postpartum hemorrhage w12x, could be an alternative w6x. However, earlier data could not detect a relationship between decreased involution and complications w3, 4x. For further clinical significance it should therefore be verified whether tape measurement which is a cheap and non-invasive method, is the preferred method for preventing postpartum complications or adverse outcomes.
References
w1x Arabin B, Ru¨ttgers H, Kubli F. Auswirkungen der
routine-ma¨ssigen Applikation von Methylergometrin im Wochenbett
auf Involution, mu¨tterliche Morbidita¨t und Laktation.
Geburtsh Frauenheilk. 1986;46:215–20.
w2x Barz MS. Puerperal infections. Zentralbl Gyna¨kol. 1986;108: 277–90.
w3x Bergstro¨m S, Libombo A. Puerperal measurement of the sym-physis-fundus distance. Gynecol Obstet Invest. 1992;44: 425–7.
w4x Cluett ER, Alexander J, Pickering RM. What is the normal
pattern of uterine involution? An investigation of postpartum uterine involution measured by the distance between the sym-physis pubis and the uterine fundus using a paper tape meas-ure. Midwifery. 1997;13:9–16.
w5x Costa MA, Calejo LI, Martinez-de-Oliveria J, Laurini R. Late onset postpartum hemorrhage from placental bed subinvolu-tion: a case report. J Report Med. 2005;50:557–60. w6x Gu¨lmezoglu AM, Forna F, Villar J, Hofmeyr GJ.
Prostaglan-dins for preventing postpartum haemorrhage. Cochrane Data-base Syst Rev. 2007;18:CD00094.
w7x Lavery JP, Shaw LA. Sonography of the postpartum uterus.
J Ultrasound Med. 1989;8:481–6.
w8x Lee CY, Madrazo B, Drukker BH. Ultrasonographic
evalua-tion of the postpartum uterus in the management of postpar-tum bleeding. Obstet Gynecol. 1981;58:227–32.
w9x Shalev J, Royburt M, Fite G, Mashiach R, Schoenfeld A, Bar J, et al. Sonographic evaluation of the puerperal uterus: cor-relation with manual examination. Gynecol Obstet Invest. 2002;53:38–41.
w10x Silverton L. The art and science of midwifery. New York:
McGraw-Hill Cos Inc; 1993.
w11x VanRees D, Bernstine RL, Crawford W. Involution of the
postpartum uterus. An ultrasonic study. J Clin Ultrasound. 1981; 9:55–7.
w12x Vogel D, Burkhardt T, Rentsch K, Schweer H, Watzer B,
Zimmermann R, et al. Misoprostol vs. methylergometrine: pharmacokinetics in human milk. Am J Obstet Gynecol. 2004;191:2168–73.
w13x Wachsberg RH, Kurtz AB, Levine CD, Solomon P, Wapner
JR. Real-time ultrasonographic analysis of the normal post-partum uterus: technique, variability, and measurements. J Ultrasound Med. 1994;13:215–21.
w14x World Health Organization. The prevention and management
of puerperal infections, report of a technical working group, Geneva, May 1992. World Health Organization, Geneva 1995.
The authors stated that there are no conflicts of interest regarding the publication of this article.
Received July 5, 2009. Revised August 30, 2009. Accepted October 19, 2009. Previously published online February 2, 2010.