Original article
© 2003 European Society for Medical Oncology
Locally advanced/inflammatory breast cancers treated with
intensive epirubicin-based neoadjuvant chemotherapy: are there
molecular markers in the primary tumour that predict for 5-year
clinical outcome?
H. Bonnefoi
1*, S. Diebold-Berger
1, P. Therasse
2, A. Hamilton
3, M. van de Vijver
4, G. MacGrogan
5,
L. Shepherd
6, N. Amaral
7, C. Duval
8, R. Drijkoningen
9, D. Larsimont
3& M. Piccart
3†
*Correspondence to: Dr H. Bonnefoi, Gynaecology Department, Hôpitaux Universitaires de Genève, Boulevard de la Cluse 30, CH-1211 Genève 14, Switzerland. Tel: +41-22-382-3311; Fax: +41-22-382-4135; E-mail: Herve.Bonnefoi@hcuge.ch
†Study participants are listed in the Acknowledgements.
1
Hôpitaux Universitaires de Genève, Geneva, Switzerland; 2
EORTC Data Center, Brussels; 3
Institut J. Bordet, Brussels, Belgium; 4
Netherlands Cancer Institute, Amsterdam, The Netherlands; 5
Institut Bergonié, Bordeaux, France; 6
NCIC Clinical Trials Group, Kingston, Canada; 7
Hospitais da Universidade, Coimbra, Portugal;
8Centre Henri Becquerel, Rouen, France; 9University Hospital, Leuven, Belgium
Received 9 September 2002; revised 15 October 2002; accepted 19 November 2002
Background:
Locally advanced and/or inflammatory breast cancer (LABC) is a heterogeneous disease. Molecular markers may help to understand this heterogeneity. This paper reports the results of a study assessing the potential prognostic or predictive value of HER-2, p53, cyclinD1, MIB1, ER and PgR expression by immunohistochemistry from patients included in an EORTC–NCIC–SAKK trial.Patients and methods:
A total of 448 patients with a cytological or histological diagnosis of LABC were randomised into a trial comparing two anthracycline-based neoadjuvant regimens. Chemotherapy was followed by standard locoregional therapy. Survival was comparable in both arms. We collected and analysed centrally paraffin-embedded tumour specimens from 187 (72.5%) of 258 patients that had a histological diagnosis.Results:
Of the patients included in this molecular marker study 114 relapsed and 91 died. In the multivariate analysis p53 positivity was associated with a shorter progression-free survival [hazard ratio (HR) = 1.96; 95% CI 1.33–2.91; P = 0.0008) and a shorter overall survival (HR = 1.98; 95% CI 1.28–3.06; P = 0.002). PgR positivity predicted for a longer overall survival (HR = 0.54; 95% CI 0.35–0.83; P = 0.0045).Conclusions:
p53 was an independent factor predicting for survival. In order to clarify whether p53 is a pure prognostic and/or a predictive factor, a phase III trial is being conducted (EORTC 10994/BIG 00-01 study) using functional assay in yeast from frozen tumour samples.Key words: breast cancer, locally advanced/inflammatory breast cancer, neoadjuvant chemotherapy, p53
Introduction
Molecular predictive factors of response or resistance to
chemo-therapy in breast cancer are lacking in clinical practice. The list of
candidates is long and MDR1/gp170, topoisomerase II, S-phase,
HER-2, p53 and others have been analysed in many breast cancer
trials. Within this list two markers, namely HER-2 and p53,
seem very promising. Preclinical data regarding the relationship
between HER-2 and response to chemotherapy are contradictory
[1]. In the clinic the role of HER-2 as a predictive factor of
response to chemotherapy, specifically to anthracyclines, has
been suggested by several retrospective analyses conducted in
the context of prospective trials. Taken together these data
sug-gest that HER-2 is associated with sensitivity to doxorubicin [2].
TP53 is a key regulatory gene in the apoptotic pathway and
preclinical and clinical studies have shown that anticancer agents
achieve their cytotoxic effect through apoptosis. In vitro and
in vivo studies indicate that tumours containing wild-type p53
respond better to anthracyclines than p53-mutant tumours [3, 4].
One clinical study [5], recently updated [6], where TP53 gene
was analysed suggested that specific mutations may confer
resist-ance to anthracyclines.
The results of a large intergroup (EORTC–NCIC–SAKK)
phase III trial conducted on 448 patients presenting with locally
advanced and/or inflammatory breast cancers were recently
reported [7]. Patients were randomised between two different
neo-adjuvant anthracycline chemotherapy regimens. After six cycles
of chemotherapy, locoregional treatment was planned, followed
by tamoxifen for 5 years. After a median follow-up of 5.5 years,
no significant difference in terms of progression-free survival
(PFS) or overall survival (OS) was found between the two
chemotherapy arms. Patients with inflammatory breast cancer
had a shorter median PFS than patients with locally advanced
breast cancer (24 months and 44 months, respectively). However,
both subgroups were heterogeneous, some patients having
pro-gressed very early and others remaining without progression
several years after diagnosis. Beyond the clinical presentation
(locally advanced versus inflammatory breast cancer) we attempted
to understand this heterogeneity with the help of molecular
mark-ers. Therefore, we collected tumour specimens from patients
included in the EORTC–NCIC–SAKK study and performed a
central immunohistochemical analysis of the following markers:
estrogen receptor (ER) and progesterone receptor (PgR), MIB-1,
HER-2, p53 and cyclin D1. This paper reports the results of a
retrospective assessment of the potential prognostic or predictive
value of these markers in relation to clinical response, PFS and
OS. By definition “prognostic factors are associated with either
the metastatic and/or growth rate potential of the primary tumour
and predictive factors are associated with relative sensitivity and/
or resistance to specific therapeutic agents” [8]. Some factors can
be both prognostic and predictive. We will elaborate on this in the
discussion.
Patients and methods
Patients and treatment
From May 1993 to April 1996, patients with locally advanced or inflamma-tory breast cancer were included in a large EORTC–NCIC–SAKK random-ised study that compared two neoadjuvant anthracycline-based regimens, with dose-intensity in one regimen being twice that of the other. The eligi-bility criteria for this trial are described by Therasse et al. [7]. Patients were randomised to receive six cycles of neoadjuvant chemotherapy, either fluoro-uracil 500 mg/m2 days 1 and 8 intravenously (i.v.), epirubicin 60 mg/m2 days
1 and 8 i.v., cyclophosphamide 75 mg/m2/day from day 1 to day 14 orally,
q 4 weeks (FEC 120), or epirubicin 120 mg/m2 day 1, cyclophosphamide
830 mg/m2 i.v. and granulocyte colony-stimulating factor (G-CSF)
(Fil-grastim) 5 µg/kg/day from day 1 to day 13 subcutaneously (EC regimen), every 2 weeks. Tumour assessment was planned after three and six cycles of chemotherapy in both arms. Locoregional treatment was planned after chemotherapy and was flexible according to each centre’s policy. Tamoxifen was started 4 weeks following day 1 of the last cycle of chemotherapy in all patients irrespective of hormone-receptor status and was planned for a total of 5 years. All patients were followed in a standardised fashion after treatment completion to determine the PFS and OS.
Central pathology review
Formalin-fixed or Bouin Hollande-fixed, paraffin-embedded tumour samples from the primary tumour were obtained prior to the initiation of neoadjuvant chemotherapy from participating EORTC institutions. Tumours were pro-vided as unstained 5-µm tissue sections or as tumour blocks, in which case the slides were prepared centrally. The tumours were graded on haematoxylin and eosin (H&E) slides according to the Elston modified scoring scheme of Bloom and Richardson [9] by a reference pathologist (S.D.B.) blinded to the clinical outcome of the patient.
Immunohistochemical analysis
All immunohistochemical analyses were performed in a single reference laboratory, using the unstained 5-µm tissue sections. The general protocol for immunohistochemical staining was performed according to a standardised method previously described by Clahsen et al. [10]. This standardised method
has been used in several retrospective studies on tissue sections from patients treated within EORTC trials.
Except for HER-2, an antigen retrieval procedure was applied: tissue sec-tions were pre-incubated in 10 mM sodium citrate solution and incubated three times for 5 min in a 600 W microwave oven. Slides were then pre-incubated for 15 min in phosphate-buffered saline (PBS) with 5% bovine serum albumin (BSA) and incubated for 1 h at room temperature with the following primary antibodies: mouse monoclonal HER-2 Abs CB11 (Bio-genex, undiluted), mouse monoclonal p53 Abs DO-7 (Dako, 1/100 dilution), mouse monoclonal Cyclin D1 Abs DCS-6 (Novocastra, 1/40 dilution), mouse monoclonal estrogen receptors Abs 1D5 (Dako, 1/100 dilution), mouse mono-clonal progesterone receptors Abs PGR-1A6 (Biogenex, 1/20 dilution), mouse monoclonal Ki-67 antigen Abs MIB-1 (Immunotech, 1/20 dilution). Sections were washed with PBS and reacted with streptavidin–biotin per-oxidase reagents (Dako) and diaminobenzidine chromogen. Sections were finally counterstained with haematoxylin (5 min).
In all series and for each antibody, positive controls (known cases of breast carcinoma) and negative controls (primary antibody omitted) were included.
All slides were scored independently by two investigators (S.D.B. and H.B.) without patient information. The method of counting and scoring the immunostaining and the definition of a cut-off value were established for each antibody according to previous studies before starting the analyses; all details are described below. All discrepancies in scoring between the two investigators were resolved by consensus.
p53 overexpression. Scoring was done using a semiquantitative system
according to a method previously described [10]. Mean nuclear staining intensity (MSI) was evaluated and could vary from 0 (none), 1 (weak), 2 (moderate) to 3 (strong). Percentage of positive tumour cell nuclei (PPN) was estimated and values were given: 0 (0%), 1 (1–25%), 2 (26–50%), 3 (51–75%) and 4 (>75%). The addition of these two values (MSI and PPN) results in the p53 staining score (range 2–7). Expression of p53 was con-sidered as positive for scores ≥4 [10].
HER-2 overexpression. As previously described, a tumour was considered as
positive if a clear circonferential membranous positivity was found in the tumour cells either focally or throughout the tumour, as defined in previous studies [11]. Tumour cells which showed a granular cytoplasmic staining were considered to have normal HER-2 expression. The proportion of HER-2 positive cells was determined semi-quantitatively as the percentage of inva-sive tumour cells ranging from 0% to 100% from the entire tissue section.
MIB-1 positivity. Only clear nuclear staining in tumour cells was considered
positive. The percentage of positively stained cells was calculated from the number of brown nuclei seen in a sample of 200 tumour cells [12]. We selected the threshold of 20% (<20%, negative; ≥20%, positive), as used in a previous EORTC immunohistochemical study [10].
ER and PgR status. Only clear nuclear staining in tumour cells was
con-sidered positive. The proportion of ER and PgR-positive cells was deter-mined as the percentage of invasive tumour cells ranging from 0% to 100% from the entire tissue section. The threshold of 10% positivity was chosen as the cut-off value, according to a current consensus recommendation [13]. The staining intensity was scored from 0 to 3, in a similar fashion as for p53 (see above).
Cyclin D1 expression. Only clear nuclear staining in tumour cells was
con-sidered positive. Rarely, a weak cytoplasmic staining was observed; this was considered to be non-specific. The percentage of positive cells and the stain-ing intensity were determined as described above. We chose a cut-off value of 10% (<10%, negative tumours; ≥10%, positive tumours), as used in previous studies [14].
Statistical methods
Life tables were constructed to examine PFS and OS, using the Kaplan–Meier method [15] and were compared using the log-rank test [16]. A proportional hazards regression model [17] with stratification for treatment [18] was used in the univariate and multivariate analysis. A step-down (backward) variable selection procedure was used to fit the multivariate model [19]. A two-sided test was used at the 5% level of significance.
In the statistical analysis of prognostic value, we planned to analyse molecular marker expression by immunohistochemistry both as continuous and dichotomous variables. For each marker the definitions of positivity and negativity were selected before we performed the analysis based on previous studies, as described in the previous section. The correlation between the response status and the predictive value of each biological factor has been analysed in a univariate and multivariate logistic regression model [17, 19]. All analyses testing prognostic significance of the different factors identified have been performed with SAS software. The survival data and response status were provided directly from Software for the Management and Ana-lysis of Randomised Trials (SMART). The correlation between the response
status and the predictive value of each biological factor has been analysed in a univariate analysis.
Results
Patient and tumour characteristics
From May 1993 to April 1996 448 patients were included in the
EORTC–NCIC–SAKK trial. Eleven patients were not eligible.
One of the inclusion criteria for this protocol was a cytological or
histological diagnosis of breast carcinoma. We were able to
col-lect tumour specimens from 187 (72.5%) of 258 patients that had
a histological diagnosis. Eight cases were not evaluable for the
immunohistochemical analysis (no invasive carcinoma detected
in six cases; technically unsuitable specimen in two cases).
Con-sequently tumour specimens from 179 patients were included in
the immunohistochemical study, leaving 258 patients who were
treated in the clinical trial but not entered in this translational
research study (no tumour specimen collected). Characteristics
of patients in these two groups were well balanced for age,
tumour presentation (locally advanced versus inflammatory),
menopausal status, chemotherapy regimen allocated and clinical
response to chemotherapy (Table 1). Tumour characteristics
(histological grade and molecular markers) of the 179 patients
included in this study are listed in Table 2.
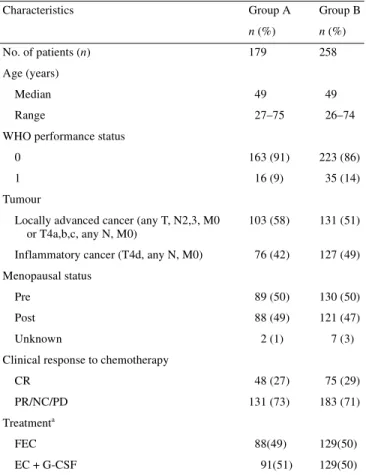
Table 1. Comparison of patient characteristics included in the European Organisation for Research and Treatment of Cancer (EORTC) 10921 study: group A, patients included in the prognostic factor study (PF study) and group B, patients not included in the PF study
aNo survival differences between the two treatment arms (FEC versus
EC + G-CSF).
CR, complete response; EC, epirubicin, cyclophosphamide and granulocyte colony-stimulating factor (G-CSF) (Filgrastim); FEC, 5-fluorouracil, epirubicin, cyclophosphamide; PR, partial response; NC, no change; PD, progressive disease.
Characteristics Group A Group B
n (%) n (%)
No. of patients (n) 179 258 Age (years)
Median 49 49
Range 27–75 26–74
WHO performance status
0 163 (91) 223 (86)
1 16 (9) 35 (14)
Tumour
Locally advanced cancer (any T, N2,3, M0 or T4a,b,c, any N, M0)
103 (58) 131 (51) Inflammatory cancer (T4d, any N, M0) 76 (42) 127 (49) Menopausal status
Pre 89 (50) 130 (50) Post 88 (49) 121 (47) Unknown 2 (1) 7 (3) Clinical response to chemotherapy
CR 48 (27) 75 (29)
PR/NC/PD 131 (73) 183 (71) Treatmenta
FEC 88(49) 129(50)
EC + G-CSF 91(51) 129(50)
Table 2. Tumour characteristics: histological grade and molecular markers
ER, estrogen receptor; PF, prognostic factor; PgR, progesterone receptor.
Tumour characteristics PF study (n = 179)
n (%) Histological grade Grade I and II 82 (58) Grade III 60 (42) ER Negative <10% 102 (57) Positive ≥10% 77 (43) PgR Negative <10% 60 (34) Positive ≥10% 117 (66) MIB-1 Negative <20% 42 (25) Positive ≥20% 128 (75) HER-2 Negative 132 (74) Positive 47 (26) p53 overexpression Negative (score <4) 126 (70) Positive (score ≥4) 53 (30) Cyclin D1 Negative <10% 126 (71) Positive ≥10% 52 (29)
Survival
Of the 179 patients included in this molecular markers study
114 relapsed and 91 died.
Univariate analysis for PFS and OS
A first univariate analysis was performed on the following
parameters analysed as dichotomous variables: tumour grade
(I/II versus III), ER status [percentage of cells stained (%CS)
<10 versus ≥10], PgR status (%CS <10 versus ≥10), MIB-1
per-centage (%CS <20 versus ≥20), HER-2 overexpression (%CS = 0
versus >0), p53 overexpression (score <4 versus ≥4) and cyclin
D1 overexpression (% CS <10 versus ≥10). This analysis
demon-strated that two factors were significantly associated with a
shorter PFS and OS: ER negativity and p53 positivity (Table 3).
PgR negativity was associated with a shorter PFS and OS; this
difference was statistically significant for OS (P = 0.007), but not
for PFS (P = 0.23). Progression-free survival and OS curves
according to immunohistochemically defined p53 status are shown
in Figures 1 and 2.
A second univariate analysis was performed on
immuno-histochemical parameters which were analysed as continuous
variables. Again ER negativity and p53 overexpression were
significantly associated with a worse outcome in terms of PFS
and OS (Table 4). Progesterone receptor negativity and MIB-1
positivity were associated with a shorter PFS and OS; with both
markers this difference was statistically significant for OS
(P = 0.002 and 0.004, respectively), but not for PFS (P = 0.22 and
0.09, respectively).
Multivariate analysis for PFS and OS
Characteristics were analysed as dichotomous variables in the first
multivariate analysis and as continuous variables in the second.
All the factors found to be significant at the 0.1 level in the
uni-variate analysis were included in the multiuni-variate Cox regression
model for their relation to PFS and OS. Consequently, grade and
HER-2 were not analysed in the first multivariate analysis, and
HER-2 and cyclin D1 were not analysed in the second
multi-variate analysis.
In both analyses, p53 positivity (tumour with a score ≥4 or with
a high percentage of positive cells) was found to be an
independ-ent prognostic factor associated with a statistically significant
higher risk of progression and death (Tables 5 and 6).
In both multivariate analyses, PgR negativity was found to be
an independent prognostic factor associated with a statistically
significant higher risk of death (Tables 5 and 6).
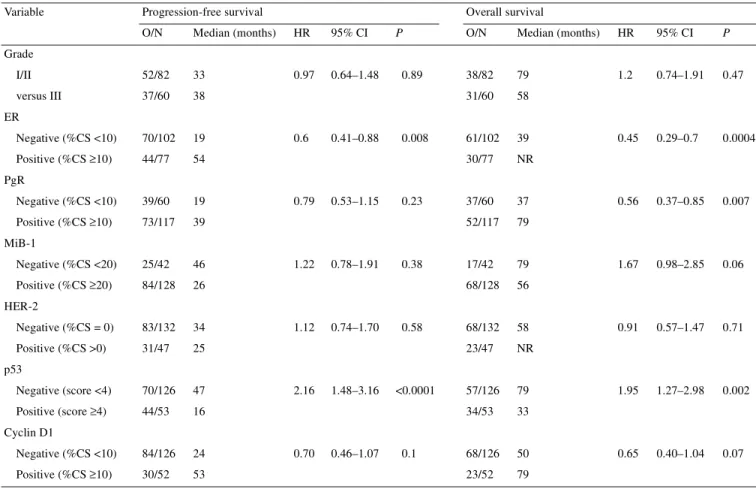
Table 3. Univariate analysis of grade and molecular markers predicting for progression-free survival (PFS) and overall survival (OS)
(characteristics analysed as dichotomous variables)
O/N, observations (events)/number of patients (total); HR, hazard ratio; NR, not reached; CI, confidence interval; %CS, percentage of cells stained. Variable Progression-free survival Overall survival
O/N Median (months) HR 95% CI P O/N Median (months) HR 95% CI P
Grade I/II 52/82 33 0.97 0.64–1.48 0.89 38/82 79 1.2 0.74–1.91 0.47 versus III 37/60 38 31/60 58 ER Negative (%CS <10) 70/102 19 0.6 0.41–0.88 0.008 61/102 39 0.45 0.29–0.7 0.0004 Positive (%CS ≥10) 44/77 54 30/77 NR PgR Negative (%CS <10) 39/60 19 0.79 0.53–1.15 0.23 37/60 37 0.56 0.37–0.85 0.007 Positive (%CS ≥10) 73/117 39 52/117 79 MiB-1 Negative (%CS <20) 25/42 46 1.22 0.78–1.91 0.38 17/42 79 1.67 0.98–2.85 0.06 Positive (%CS ≥20) 84/128 26 68/128 56 HER-2 Negative (%CS = 0) 83/132 34 1.12 0.74–1.70 0.58 68/132 58 0.91 0.57–1.47 0.71 Positive (%CS >0) 31/47 25 23/47 NR p53 Negative (score <4) 70/126 47 2.16 1.48–3.16 <0.0001 57/126 79 1.95 1.27–2.98 0.002 Positive (score ≥4) 44/53 16 34/53 33 Cyclin D1 Negative (%CS <10) 84/126 24 0.70 0.46–1.07 0.1 68/126 50 0.65 0.40–1.04 0.07 Positive (%CS ≥10) 30/52 53 23/52 79
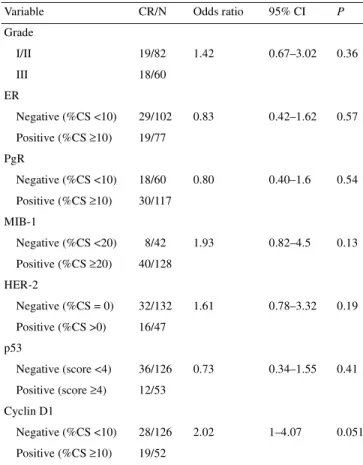
Predictive factors of a clinical complete response to
chemotherapy
A complete clinical response to neoadjuvant chemotherapy was
observed in 48 of 179 patients (27%). In the univariate analysis,
cyclin D1-negative tumours were associated with a lower rate of
complete clinical response (P = 0.051) (Table 7). No statistically
significant correlation between grade or immunohistochemical
status of ER, PgR, MIB-1, HER-2 or p53 and a clinical complete
response to chemotherapy was found (Table 7).
Discussion
In the literature few studies report on biological factors in
locally-advanced/inflammatory breast cancer [5, 20, 21]. This is the
largest biological markers study conducted so far in this setting.
In early breast cancer ER and PgR status are weak prognostic
factors [22] and well established predictive factors of response to
tamoxifen and other hormonal manipulations [23]. In locally
advanced and/or inflammatory breast cancers the prognostic or
predictive value of hormone receptors remains controversial
[21, 24]. In our study, PgR status was found to be an independent
factor predicting for OS (Tables 5 and 6). In the multivariate
analysis for OS, ER status lost its significance (Tables 5 and 6).
This is most probably because of its close correlation with PgR
(in the multivariate analysis for OS, ER was removed from the
model in favour of PgR). The fact that PgR is an independent
factor for OS, but not for PFS seems paradoxical. We
hypo-thesised that we missed its prognostic information for PFS due to
the relatively small number of patients analysed.
In our series HER-2 did not predict for either PFS or OS in
the univariate analysis. The potential pure prognostic value of
HER-2 remains controversial, as shown in a recent meta-analysis
[25]. Regarding its predictive value, data in the literature suggest
that HER-2 overexpression is associated with anthracycline
sensitivity and that this sensitivity increases with dose escalation
[2]. In our study patients received chemotherapy regimens with a
high dose of anthracyclines in both treatment arms. Therefore,
our study design is not optimal to evaluate the hypothesis of an
association between HER-2 overexpression and anthracycline
sensitivity. Similarly, there are data in the literature that suggest
Figure 1. Progression-free survival of patients according to p53 statusdefined by immunohistochemistry. The numbers below the years on the x axis refer to patients at risk.
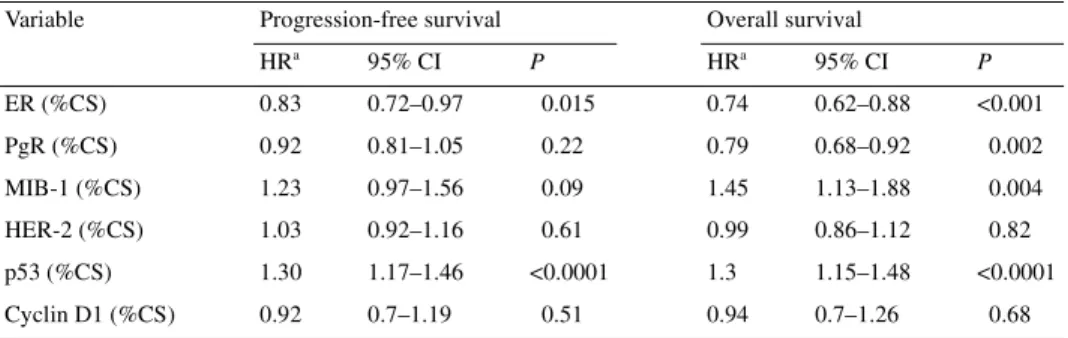
Table 4. Univariate analysis of molecular markers predicting for progression-free survival and overall survival
(characteristics analysed as continuous variables)
aHazard ratio (HR) represents the increase of the relative risk when the percentage of cells stained (%CS) rises
from x% to x+25%.
CI, confidence interval; ER, estrogen receptor; HR, hazard ratio; PgR, progesterone receptor. Variable Progression-free survival Overall survival
HRa 95% CI P HRa 95% CI P ER (%CS) 0.83 0.72–0.97 0.015 0.74 0.62–0.88 <0.001 PgR (%CS) 0.92 0.81–1.05 0.22 0.79 0.68–0.92 0.002 MIB-1 (%CS) 1.23 0.97–1.56 0.09 1.45 1.13–1.88 0.004 HER-2 (%CS) 1.03 0.92–1.16 0.61 0.99 0.86–1.12 0.82 p53 (%CS) 1.30 1.17–1.46 <0.0001 1.3 1.15–1.48 <0.0001 Cyclin D1 (%CS) 0.92 0.7–1.19 0.51 0.94 0.7–1.26 0.68
Figure 2. Overall survival of patients according to p53 status defined by
that HER-2-positive tumours may be less sensitive to tamoxifen
than HER-2-negative tumours [2]. In our study all patients
received tamoxifen and the results do not suggest an inverse
association between HER-2 overexpression and tamoxifen
sensitivity.
In this study p53 was a strong independent factor predicting for
PFS and OS. We first performed a multivariate analysis with
molecular markers as dichotomous variables using a predefined
score detailed in the methods section. In this multivariate analysis
p53 was the only factor associated with an increased risk of
pro-gression (HR = 1.96) and the strongest factor associated with an
increased risk of death (HR = 1.98) (Table 5). We then performed
a second multivariate analysis, the factors being analysed as
continuous variables. Again p53 emerged as the only factor
pre-dicting for a shorter PFS and the strongest factor prepre-dicting for a
shorter OS (Table 6).
The risk of false positive and false negative results is higher
when p53 is assessed by the immunohistochemical method as
compared with molecular biology methods (e.g. denaturating
gradient gel electrophoresis, genomic p53 sequencing method)
[6, 26]. With immunohistochemistry there is a risk of false
negative cases related to the type of p53 mutation. With many p53
gene mutations, p53 protein half-life is increased and
immuno-histochemistry detects the protein in the nucleus, but when p53
gene mutations encode unstable proteins (nonsense mutations,
splicing mutations) immunohistochemistry remains negative
(‘null mutations’). These mutations have been found to account
for 25–47% of all p53 mutations in series of patients with early
breast cancers [27, 28]. These specific mutations were probably
uncommon in our series and this may explain our observation:
p53 by immunohistochemistry was a strong independent
prognostic factor in this subset of high risk tumours. We could
hypothesise that the use of a more sensitive method (e.g.
denatur-ating gradient gel electrophoresis, genomic p53 sequencing
method) could only have increased the independent prognostic
value of p53 assessed by immunohistochemistry.
In our series we did not find a correlation between p53 status
and clinical response to chemotherapy (Table 7). Amongst other
possibilities two reasons may explain this observation. First the
number of events (number of clinical complete responses) was
small in our series and we may have missed a correlation by a
lack of statistical power. Secondly, as discussed previously,
immunohistochemistry is not the best method to assess p53. In
five trials conducted in the neoadjuvant setting where p53 status
was assessed by immunohistochemistry, no correlation was
found between p53 status and clinical response to chemotherapy
[6, 29–32]. While in one clinical study [5], recently updated [6],
where p53 was assessed by temporal temperature gradient gel
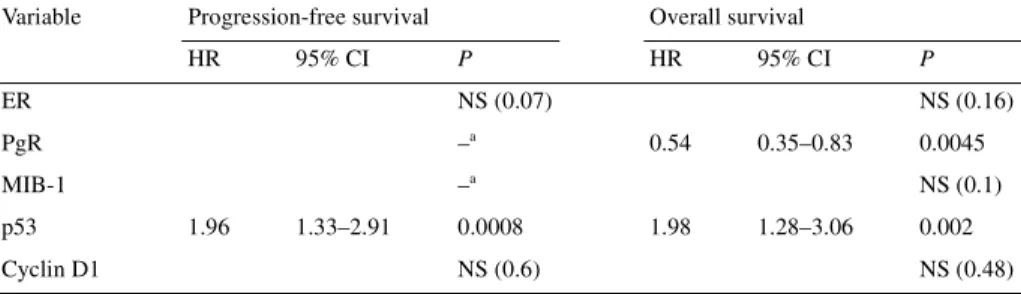
Table 5. Multivariate analysis of molecular markers predicting for progression-free survival and overallsurvival (characteristics analysed as dichotomous variables)
aIn the univariate analysis for progression-free survival, PgR and MIB-1 were not found to be significant at
the 0.1 level, and therefore were not included in the multivariate analysis.
CI, confidence interval; ER, estrogen receptor; HR, hazard ratio; NS, not significant; PgR, progesterone receptor.
Variable Progression-free survival Overall survival
HR 95% CI P HR 95% CI P ER NS (0.07) NS (0.16) PgR –a 0.54 0.35–0.83 0.0045 MIB-1 –a NS (0.1) p53 1.96 1.33–2.91 0.0008 1.98 1.28–3.06 0.002 Cyclin D1 NS (0.6) NS (0.48)
Table 6. Multivariate analysis of molecular markers predicting for progression-free survival and overall
survival (characteristics analysed as continuous variables)
aHazard ratio (HR) represent the increase of the relative risk when the percentage of cells stained (%CS) rises
from x% to x+25%.
bIn the univariate analysis for progression-free survival, PgR was not found to be significant at the 0.1 level,
and therefore was not included in the multivariate analysis for PFS.
CI, confidence interval; ER, estrogen receptor; NS, not significant; PgR, progesterone receptor. Variable Progression-free survival Overall survival
HRa 95% CI P HRa 95% CI P
ER (%CS) NS (0.22) NS (0.09)
PgR (%CS) –b 0.79 0.68–0.93 0.004
MIB-1 (%CS) NS (0.57) NS (0.32) p53 (%CS) 1.27 1.13–1.43 <0.0001 1.29 1.13–1.47 0.0001
electrophoresis (TTGE) and genomic sequencing, specific p53
mutations were associated with resistance to anthracyclines.
Pathologically assessed complete response may be a better
surro-gate for chemotherapy efficacy than clinical response. Therefore
biological markers predicting for a pathological complete response
(pCR) would be of great value. However, in view of the small
number of patients who achieved a pCR, we decided not to
evaluate the possible correlation between p53 status (or other
markers) and pathological response.
Our results do not allow us to conclude whether p53 is a pure
prognostic, or a mixed prognostic and predictive factor.
Pre-clinical data suggest that p53-mutated tumours are less sensitive
to anthracyclines [3, 4], but remain sensitive to taxanes [33–35].
Moreover, the correlation between p53 status and pCR, that we
were unable to address, needs to be evaluated. In order to test this
hypothesis a large intergroup phase III clinical trial is being
conducted (EORTC, SAKK, Swedish and Angloceltic groups)
under the auspices of the Breast International Group (EORTC
10994/BIG 00-01 study). Patients with large operable or locally
advanced breast cancer are randomised to receive six cycles
of neoadjuvant chemotherapy, either an anthracycline-based
regimen or a docetaxel-based regimen, followed by locoregional
treatment and antihormonal treatment when indicated. In this
study, p53 status will be determined by using a functional assay
in yeast that detects functionally important p53 mutations [36].
This test gives direct information regarding p53 function (detects
biologically important mutations) and is theoretically more
sensi-tive than sequencing because it is insensisensi-tive to contamination of
samples with normal tissue. We will measure the correlation
between p53 assessment by immunohistochemistry method and
functional test as part of a side study. The functional test will be
performed from frozen tumour samples taken by double trucut
biopsy or by single incisional biopsy, as we have shown that the
material from both biopsies gives identical results [37]. These
frozen samples will also be assessed by cDNA microarray
tech-nology, with the hope of identifying a gene expression profile
that predicts ‘exquisite’ sensitivity to a taxane-based regimen.
Acknowledgements
The participating institutions are given below. The pathologist (or contact person) is listed first, followed by the principal investigator (when different) and then the address. D. Dom (pathologist or contact person), D. Becquart (principal investigator), Algemeen Ziekenhuis Middelheim, Antwerpen; D. Larsimont, M. Piccart, Institut Jules Bordet, Brussels; R. Drijkoningen, R. Paridens, UZ Gasthuisberg, Leuven, Belgium; L. Shepherd, NCIC Clinical Trials Group, Queen’s University, Kingston, Canada; T. Svoboda, University Hospital, Plzen; J. Jiroseva, Thomayer’s Teaching Hospital, Praha, Czech Republic; G. MacGrogan, L. Mauriac, Fondation Bergonié, Bordeaux; L. Arnould, P. Fargeot, Centre Georges-François, Leclerc, Dijon; R.-M. Parache, E. Luporsi, Centre Alexis Vautrin, Nancy; C. Duval, I. Raoust, C. Chinet-Charrot, Centre Henri Becquerel, Rouen; A. Gentile, M. Tubiana-Hulin, Centre René Huguenin, St Cloud, France; H. Peterse, P. Bruning, Antoni van Leeuwenhoekhuis, Amsterdam; L. Beex, University Medical Centre, Nijmigen; J. Henzen-Logwans, J. Klijn, AZ Rotterdam–Daniel Den Hoed Kliniek, Rotterdam; N. Nortier, A. de Graeff, AZ Utrecht, Uthrecht, The Netherlands; M. Welnicka-Jaskiewicz, J. Jassem, Medical University of Gdansk, Gdansk; B. Utracka-Hutka, Maria Skoldowska-Curie Cancer Center, Gliwich; D. Alwaslak, J. Pluzanska, Medical Academy of Lodz, Lodz, Poland; N. Amaral, C. Freire de Olivera Hospitais da Universidade de Coimbra, Coimbra, Portugal; M. Zagrekova, M. Lichinister, Cancer Research Center, Moscow; V.-F. Semiglazov, Petrov Research Institute of Oncology, St Petersburg, Russia; P. Laissue, M. Castiglione, Inselspital, Bern; S. Diebold-Berger, H. Bonnefoi, Hôpitaux Universitaires de Genève, Geneva; F. Bosman, L. Perey, Centre Hospitalier Universitaire Vaudois, Lausanne; C. Öschlegel, B. Thürliman, Kantonsspital, St Gallen, Switzerland; A. M. Hanby, M. A. Richards, Guy’s Hospital, London, UK. This work was supported by grants from Foundation Widmer, Foundation Gianluca Spinola and Foundation Jean-Claude Heuson. We would like to thank Sophia Alexe for her excellent technical assistance and Bernadette Mermillod for carefully reading the manuscript and giving her highly appreciated advice.
References
1. Pegram MD, Finn RS, Arzoo K et al. The effect of HER-2/neu over-expression on chemotherapeutic drug sensitivity in human breast and ovarian cancer cells. Oncogene 1997; 15: 537–547.
2. Yamauchi H, Stearns V, Hayes DF. When is a tumor marker ready for prime time? A case study of c-erbB-2 as a predictive factor in breast cancer. J Clin Oncol 2001; 19: 2334–2356.
Table 7. Univariate analysis of factors predicting for a clinical complete response (CR) (characteristics analysed as dichotomous variables)
CR/N, number of patients with a clinical complete response/number of patients (total).
CI, confidence interval; %CS, percentage of cells stained; ER, estrogen receptor; PgR, progesterone receptor.
Variable CR/N Odds ratio 95% CI P
Grade I/II 19/82 1.42 0.67–3.02 0.36 III 18/60 ER Negative (%CS <10) 29/102 0.83 0.42–1.62 0.57 Positive (%CS ≥10) 19/77 PgR Negative (%CS <10) 18/60 0.80 0.40–1.6 0.54 Positive (%CS ≥10) 30/117 MIB-1 Negative (%CS <20) 8/42 1.93 0.82–4.5 0.13 Positive (%CS ≥20) 40/128 HER-2 Negative (%CS = 0) 32/132 1.61 0.78–3.32 0.19 Positive (%CS >0) 16/47 p53 Negative (score <4) 36/126 0.73 0.34–1.55 0.41 Positive (score ≥4) 12/53 Cyclin D1 Negative (%CS <10) 28/126 2.02 1–4.07 0.051 Positive (%CS ≥10) 19/52
3. Lowe SW, Ruley HE, Jacks T, Housman DE. p53-dependent apoptosis modulates the cytotoxicity of anticancer agents. Cell 1993; 74: 957–967. 4. Lowe SW, Bodis S, McClatchey A et al. p53 status and the efficacy of
cancer therapy in vivo. Science 1994; 266: 807–810.
5. Aas T, Borresen AL, Geisler S et al. Specific p53 mutations are associ-ated with de novo resistance to doxorubicin in breast cancer patients. Nature Med 1996; 2: 811–814.
6. Geisler S, Lonning PE, Aas T et al. Influence of TP53 gene alterations and c-erbB-2 expression on the response to treatment with doxorubicin in locally advanced breast cancer. Cancer Res 2001; 61: 2505–2512. 7. Therasse P, Mauriac L, Jassem J et al. Final results of a randomised phase
III trial comparing CEF (cyclophosphamide, epirubicin, 5FU) with a dose intensified EC + G-CSF (epirubicin, cyclophosphamide + filgras-tim) in locally advanced breast cancer. An EORTC–NCIC–SAKK multi-center study. J Clin Oncol 2003; In press.
8. Hayes DF, Trock BJ, Harris AL. Assessing the clinical impact of prognostic factors: when is ‘statistically significant’ clinically useful? Breast Cancer Res Treat 1998; 52: 305–319.
9. Elston CW, Ellis IO. Pathological prognostic factors in breast cancer. I. The value of histological grade in breast cancer: experience from a large study with long-term follow-up. Histopathology 1991; 19: 403–410. 10. Clahsen PC, van de Velde CJ, Duval C et al. p53 protein accumulation
and response to adjuvant chemotherapy in premenopausal women with node-negative early breast cancer. J Clin Oncol 1998; 16: 470–479. 11. Allred DC, Swanson PE. Testing for erbB-2 by immunohistochemistry
in breast cancer. Am J Clin Pathol 2000; 113: 171–175.
12. Wintzer HO, Zipfel I, Schulte-Mönting J et al. Ki-67 immunostaining in human breast tumors and its relationship to prognosis. Cancer 1991; 67: 421–428.
13. Goldhirsch A, Glick JH, Gelber RD et al. Meeting highlights: Inter-national Consensus Panel on the Treatment of Primary Breast Cancer. Seventh International Conference on Adjuvant Therapy of Primary Breast Cancer. J Clin Oncol 2001; 19: 3817–3827.
14. McIntosh GG, Anderson JJ, Milton I et al. Determination of the prognostic value of cyclin D1 overexpression in breast cancer. Oncogene 1995; 11: 885–891.
15. Kaplan EL, Meier P. Non-parametric estimation from incomplete obser-vations. J Am Stat Assoc 1958; 53: 457–481.
16. Mantel N. Evaluation of survival data and the two new rank order statistics arising in its consideration. Cancer Chemother Rep 1966; 50: 163–170.
17. Cox DR. Regression models and life-tables. J R Stat Soc B 1972; 34: 187–202.
18. Breslow N. Comparison of survival curves. In Buyse ME, Staquet MJ, Sylvester RJ (eds): Cancer clinical trials methods and practice. Oxford, UK: Oxford Medical Publications 1988; 382–406.
19. Simon R, Altman DG. Statistical aspects of prognostic factor studies in oncology. Br J Cancer 1994; 69: 979–985.
20. Faille A, Cremoux P, Extra JM et al. p53 mutations and overexpression in locally advanced breast cancers. Br J Cancer 1994; 69: 1145–1150.
21. Honkoop AH, van Diest PJ, de Jong JS et al. Prognostic role of clinical, pathological and biological characteristics in patients with locally advanced breast cancer. Br J Cancer 1998; 77: 621–626.
22. Allred DC. Prognostic and predictive factors in breast cancer by immuno-histochemical analysis. Mod Pathol 1998; 11: 155–168.
23. Early Breast Cancer Trialist’ Collaborative Group. Tamoxifen for early breast cancer: an overview of the randomised trials. Lancet 1998; 351: 1451–1467.
24. Rubens RD, Armitage P, Winter PJ et al. Prognosis in inoperable stage III carcinoma of the breast. Eur J Cancer 1977; 13: 805–811.
25. Trock BJ, Yamauchi H, Brotzman M et al. C-erbB2 as a prognostic factor in breast cancer: a meta-analysis. Proc Am Soc Clin Oncol 2000; 19: 97a (Abstr).
26. Sjögren S, Inganäs S, Norberg T et al. The p53 gene in breast cancer: prognostic value of complementary DNA sequencing versus immuno-histochemistry. J Natl Cancer Inst 1996; 88: 173–182.
27. Berns EM, Foekens JA, Vossen R et al. Complete sequencing of TP53 predicts poor response to systemic therapy of advanced breast cancer. Cancer Res 2000; 60: 2155–2162.
28. Chappuis PO, Estreicher A, Dieterich B et al. Prognostic significance of
p53 mutation in breast cancer: frequent detection of non-missense
muta-tions by yeast functional assay. Int J Cancer 1999; 84: 587–593. 29. MacGrogan G, Mauriac L, Durand M et al. Primary chemotherapy in
breast invasive carcinoma: predictive value of the immunohistochemical detection of hormonal receptors, p53, c-erbB-2, MiB1, pS2 and GSTπ. Br J Cancer 1996; 74: 1120–1125.
30. Makris A, Powles TJ, Dowsett M et al. Prediction of response to neo-adjuvant chemoendocrine therapy in primary breast cancer. Clin Cancer Res 1997; 3: 593–600.
31. Linn SC, Pinedo HM, van Ark-Otte J et al. Expression of drug resistance proteins in breast cancer in relation to chemotherapy. Int J Cancer 1997; 71: 787–795.
32. Rozan S, Vincent-Salomon A, Zafrani B et al. No significant predictive value of c-erbB-2 or p53 expression regarding sensitivity to primary chemotherapy or radiotherapy in breast cancer. Int J Cancer 1998; 79: 27–33.
33. Fan S, Cherney B, Reinhold W et al. Disruption of p53 function in immortalized human cells does not affect survival or apoptosis after taxol or vincristine treatment. Clin Cancer Res 1998; 4: 1047–1054. 34. Lanni JS, Lowe SW, Licitra EJ et al. p53-independent apoptosis induced
by paclitaxel through an indirect mechanism. Proc Natl Acad Sci USA 1997; 94: 9679–9683.
35. Wahl AF, Donaldson KL, Fairchild C et al. Loss of normal p53 function confers sensitization to Taxol by increasing G2/M arrest and apoptosis.
Nature Med 1996; 2: 72–79.
36. Flaman JM, Frebourg T, Moreau V et al. A simple p53 functional assay for screening cell lines, blood, and tumors. Proc Natl Acad Sci USA 1995; 92: 3963–3967.
37. Bonnefoi H, Ducraux A, Movarekhi S et al. p53 as a potential predictive factor of response to chemotherapy: feasibility of p53 assessment using a functional test in yeast from trucut biopsies in breast cancer patients. Br J Cancer 2002; 86: 750–755.