HAL Id: hal-02796105
https://hal.inrae.fr/hal-02796105
Submitted on 5 Jun 2020
HAL is a multi-disciplinary open access archive for the deposit and dissemination of sci-entific research documents, whether they are pub-lished or not. The documents may come from teaching and research institutions in France or abroad, or from public or private research centers.
L’archive ouverte pluridisciplinaire HAL, est destinée au dépôt et à la diffusion de documents scientifiques de niveau recherche, publiés ou non, émanant des établissements d’enseignement et de recherche français ou étrangers, des laboratoires publics ou privés.
NFC (National Focal Centre) reports
Anne Probst, Simon Rizzetto, Noémie Gaudio
To cite this version:
Anne Probst, Simon Rizzetto, Noémie Gaudio. NFC (National Focal Centre) reports. 2014. �hal-02796105�
Modelling and Mapping
the impacts of atmospheric
deposition on plant species
diversity in Europe
CCE Status Report 2014
J. Slootweg, M. Posch, J.-P. Hettelingh, L. Mathijssen (eds.)
The Coordination Centre for Effects (CCE: www.wge-cce.org), located at RIVM, is the Programme Centre of the International Cooperative Programme on Modelling and Mapping (ICP M&M: www.icpmapping.org) of Critical Levels and Loads and Air Pollution Effects, Risks and Trends under the Working Group on Effects (WGE) of the Convention on Long-range Transboundary Air Pollution (LRTAP Convention: www.unece.org/
The work reported here has been performed by order and for the account of the Directorate for Climate, Air Quality and Noise of the Dutch Ministry of Infrastructure and the Environment, for the account of the European Commission under the Seventh Framework Programme, Theme [ENV.2011.1.1.2-1], Grant agreement no. 282910 ‘Effects of Climate Change on Air Pollution Impacts and Response Strategies for European
Ecosystems (ECLAIRE)’, and for the account of (the Working Group on Effects within) the trust fund for the effect-oriented activities under the Convention on Long-range Transboundary Air Pollution.
Report no. 2014-0075
ISBN 978-90-6960-276-9
© CCE 2014
Parts of this publication may be reproduced provided that reference is made to the source. A comprehensive reference to the report reads as Slootweg J, Posch M,
Hettelingh J-P, Mathijssen L (eds.) Modelling and Mapping impacts of atmospheric deposition on plant species diversity in Europe: CCE Status Report 2014, Coordination Centre for Effects, www.wge-cce.org.
Acknowledgements
The methods and results presented in this report are the product of close collaboration within the Effects Programme of the UNECE Convention on Long-range Transboundary Air Pollution (LRTAP), under its long-term strategy and work plan, involving many institutions and individuals throughout Europe. Participants in the Effects Programme and National Focal Centres of the International Co-operative Programme (ICP) on Modelling and Mapping of Critical Levels and Loads and Air Pollution Effects, Risks and Trends are acknowledged for their commitment and contributions to the work of the Coordination Centre for Effects (CCE).
In particular, the CCE wishes to thank: • the Ministry of Infrastructure and the
Environment, and its department of Climate, Air and Noise in particular, for their continued support;
• the Working Group on Effects and the Task Force of the ICP on Modelling and Mapping for their collaboration and assistance;
• the EMEP Meteorological Synthesizing Centres and the EMEP Centre for Integrated Assessment Modelling for their collaboration in the field of atmospheric dispersion and integrated assessment modelling;
• The European Seventh Framework Programme, Theme [ENV.2011.1.1.2-1], Grant agreement no. 282910 ‘Effects of Climate Change on Air Pollution Impacts and Response Strategies for European Ecosystems’ (ECLAIRE).
Summary
The focus of this report is on progress made, by the ICP M&M, with the modelling and mapping of critical thresholds and dose-response relationships of air pollution effects on the diversity of plant species in Europe. The idea is to extend and complete the existing European critical loads database with critical thresholds for biodiversity, to meet the new requirements of the LRTAP
Convention and the European Union for the support of European air pollution abatement policies, taking into account synergies with other international policy issues.
Chapter 1 describes the results of an assessment of
the impacts of the emission reduction scenarios that have been developed and used in the context of recent European air pollution abatement policies, using data from the current European critical loads database held at the CCE. The area at risk of acidification in Europe improves from 6% (8% in Natura 2000 areas) in 2005 to 2% (2% in Natura 2000 areas) in 2020. For eutrophication these percentages are 63% (78% in Natura 2000 areas) and 55% (65% in Natura 2000 areas), respectively. The extension of ICP M&M work to include
biodiversity endpoints more specifically was initiated in 2007 when the Executive Body agreed at its 25th
session to encourage the Working Group on Effects ‘to increase its work on quantifying effects
indicators, in particular for biodiversity. These should also be linked to the integrated assessment
modelling activities’ (ECE/EB.AIR/91, para. 31). This was confirmed in the Long-term Strategy of the Convention till 2020, which ‘set a vision for the next 10 years and beyond to address the remaining issues from existing activities and to meet emerging challenges with the aim of delivering a sustainable optimal long-term balance between the effects of air pollution, climate change and biodiversity’ (ECE/EB. AIR/2010/4, para. 6a).
In 2012 the Working Group on Effects decided that a Call for Data on ‘no net loss of biodiversity’
indicators be issued by the CCE with a deadline of March 2014 in order to assess tentative
methodologies and national data that had been reviewed by the CCE and National Focal Centres under the ICP Modelling and Mapping at various yearly CCE workshops and Task Force meetings since 2007. The Call for Data also aimed at addressing the EU 2020 headline target of ‘halting the loss of biodiversity and the degradation of ecosystem
services in the EU by 2010, and restoring them in so far as feasible, while stepping up the EU contribution to averting global biodiversity loss’ (EU1, 2011, p.12,
Target 2, Action 7). Chapter 2 describes the result of this Call for Data on biodiversity indicators and calculations, to which ten countries responded. Seven of them applied dynamic modelling. Respondents to the call suggested that further technical and conceptual work was needed to arrive at a harmonised indicator of no net loss of
biodiversity.
Meanwhile, work continued on the identification of relationships between nitrogen-sulphur deposition and biodiversity response on a regional (EUNIS) scale with a focus on ‘areas of special protection’ such as Natura 2000 areas in the EU. An important goal is to derive a harmonised metric from the submitted variables and indicators with the objective of quantifying ‘no net loss of biodiversity’ on a regional scale. This harmonised metric would allow
comparisons of the state of biodiversity between regions and countries. Finally, the indicator should be easily applicable to European policy support in the context of integrated assessment modelling and the GAINS system2. The progress made in the
development of a new indicator, i.e. the Habitat Suitability (HS) index, includes the establishment of a link between modelled soil chemistry and the occurrence probability of plant species on a European scale. A description of the methodology and data for the implementation of the HS index on a European scale is provided in Chapters 3 and 4. A modelling methodology for the assessment of the HS index as a measure of the occurrence probability of plant species is introduced. Initial simulations with this model reveal the need to improve
information on European natural vegetation and the list of desired species.
1 COM(2011) 244 final: http://ec.europa.eu/environment/nature/
biodiversity/comm2006/pdf/2020/1_EN_ACT_part1_v7[1].pdf; see also http://biodiversity.europa.eu/bise/policy/
eu-biodiversity-strategy.
2 The GAINS system consists of a combination of hard-linked
(embedded in the GAINS computer code) and soft-linked assessment options. The latter are also known as ‘ex-post’ assessments under the LRTAP Convention. A component of the FP7 ECLAIRE project also contributes to this task.
These chapters include elements that form the basis of the Call for Data 2014/15, which was issued in November 2014 in response to the request of the Working Group on Effects at its 33rd session (Geneva,
17–19 September 2014).
This report concludes with submissions by National Focal Centres describing the methods and data used for their submission to the 2012–14 Call for Data on ‘no net loss of biodiversity’ indicators.
Publiekssamenvatting
Gemodelleerde effecten van de neerslag van stikstof op de natuur
Als stikstof vanuit de lucht op de bodem
terechtkomt, werkt dat als een voedingsstof. Door te veel stikstof kunnen bepaalde plantensoorten verdwijnen of juist gaan overheersen. In
internationale politieke gremia is daarom de vraag gesteld bij welke hoeveelheid stikstof (stikstofoxides en ammoniak) in de lucht natuurgebieden intact blijven. Het internationale Coordination Centre for Effects (CCE) helpt deze vraag te beantwoorden door een Europese database te beheren en te analyseren waarin de limieten (‘kritische belastingsgrenzen’) per type natuurgebied staan weergegeven. Landen uit het CCE-netwerk leveren hiervoor informatie. In de afgelopen jaren hebben de landen nieuwe methoden getest om de kritische belastingsgrenzen te bepalen. Deze methode is gericht op de
biodiversiteit: er wordt een relatie gelegd tussen de planten die typerend zijn voor een bepaald soort vegetatie en de omstandigheden in de bodem waaronder deze planten optimaal gedijen. In acht landen is vooruitgang geboekt met de toepassing en kwantificering van deze methode. Het blijkt
essentieel om informatie te hebben over de typerende plantensoorten, maar dat is nog niet van alle vegetatiesoorten gelukt. Bossen zijn nog problematisch.
Momenteel zijn er twee methoden in gebruik om de kritische belastingsgrens te bepalen: bij de ene wordt de toegestane neerslag van stikstof begrensd door de stikstofconcentratie in het bodemvocht (in de laag van de bodem waar de wortels zitten), bij de ander gebeurt dat op basis van geobserveerde effecten van stikstof depositie op de natuur. De nieuwe methode - gebaseerd op de biodiversiteit - is hierop een aanvulling. Vanaf komend jaar worden aan de landen data over de belastingsgrenzen voor alle drie de methoden gevraagd.
Het CCE informeert beleidsmakers over de effecten van luchtverontreiniging op verschillende
ecosystemen en wat het rendement van
maatregelen is. De stikstofdepositie neemt al jaren af, maar op veel plekken in Europa verliezen ecosystemen nog steeds aan diversiteit.
Contents
Part 1 Progress CCE 11
1 Exposure of ecosystems to acidification and eutrophication in Europe: an update of EEA-Core Set Indicator 005 13
1.1 Introduction 13
1.2 Trends of acidification and eutrophication since 1880 14
1.3 Maps and Tables of acidification and eutrophication since 1980 15
1.3.1 CSI 005 for acidification 16
1.3.2 CSI 005 for eutrophication 18
1.4 Tentatively assessing plant species diversity in selected European ecosystems 20
1.5 Summary, conclusions and recommendations 23
References 24
Annex 1A: CSI 005 using ‘old’ methods and data 26
2 Summary of National Data 29
2.1 Introduction 29
2.2 A metric to describe loss of biodiversity 29
2.3 NFC submissions 30
2.4 Submitted D–R functions 32
2.5 Conclusions regarding the D–R functions 34
2.6 Comparing the D–R points to data from the nitrogen addition experiments 34
2.7 Summary and outlook 36
References 36
Annex 2A: Updated Swedish critical loads 37
Part 2 Progress in Modelling 39
3 Deriving critical loads based on plant diversity targets 41
3.1 Introduction 41
3.2 The Habitat Suitability Index 41
3.3 Deriving critical loads 42
References 45
4 VSD+PROPS: Recent developments 47
4.1 Introduction 47
4.2 Methods 47
4.2.1 The VSD+ model 47
4.2.2 The PROPS model 48
4.2.3 The PROPS database 48
4.2.4 Indices 50
4.3 Site application of VSD+PROPS 50
4.4 Recommendations 51
Part 3 NFC Reports 55 Austria 57 Czech Republic 63 Finland 69 France 73 Germany 87 Italy 95 Netherlands 103 Sweden 107 Switzerland 119 United Kingdom 139
United States of America 151
Appendix A 153
Part 1
Jean-Paul Hettelingh, Maximilian Posch, Jaap Slootweg, Liesbeth Mathijssen
1.1 Introduction
This chapter focuses on the impacts of the exposure to acidification and eutrophication of European natural areas, as classified in the European Nature Information System (EUNIS; Davies and Moss, 1999). Areas where policies of special protection apply under the EU Habitat Directive (EC, 1992), i.e. Natura 2000 areas, are addressed as a specific receptor, sensitive to impacts of nitrogen (N) deposition in particular. In this chapter an update is provided of the Core Set Indicator 005 ‘Exposure of ecosystems to acidification, eutrophication and ozone’ (CSI 005) by computing and mapping exceedances of the critical loads for acidification and eutrophication. The exceedance of ozone thresholds, also included in the CSI 005, is not dealt with in this chapter.
Results are based on the 20131 state of knowledge,
with modelled deposition data from EMEP MSC-W2
and critical loads from the Coordination Centre for Effects (CCE). The EMEP model was recently revised (Simpson et al. 2012) to cover a 0.50º×0.25º (about 28×28 km2) longitude-latitude grid. In anticipation of
the increased resolution of the EMEP model, National Focal Centres (NFCs) under the ICP Modelling & Mapping responded to a CCE call for data in 2010-2012 to update the scale (and protection requirements as appropriate) of their contribution to the European critical load database (see Posch et al. 2012). These new methods and data have enabled the re-calculation of exceedances and areas at risk caused by depositions (MSC-W 2013) from emissions under the revised Gothenburg Protocol, the Current Legislation scenario (GP-CLE) in 2020, and the Maximum Feasible Reduction (MFR) scenario in 2030. These emission scenarios were provided by the Centre for Integrated Assessment
1 Selected results of the different model and data versions used
to support the revision of the Gothenburg Protocol can be found in the Annex to this chapter.
2 Co-operative Programme for Monitoring and Evaluation of the
Long-range Transmission of Air Pollutants in Europe (EMEP), Meteorological Synthesizing Centre West (MSC-W) at the Norwegian Meteorological Institute.
1
Exposure of ecosystems
to acidification and
eutrophication in Europe:
an update of EEA-Core
Set Indicator 005
*
* This chapter bears on work done by the CCE for Technical Report
Modelling (CIAM) of the Task Force on Integrated Assessment Modelling (TFIAM) of EMEP.
Emissions in the base year 2005 and projected emissions according to the GP-CLE scenario in 2020 have been developed under the revised Protocol to Abate Acidification, Eutrophication and Ground-level Ozone (UNECE 2012a,b) to the LRTAP Convention. Historic emissions since 1880, used in this chapter to illustrate the long-term trend of the CSI 005, have been derived from Schöpp et al. (2003). The historical CSI 005 trends are based on deposition patterns following different versions of the EMEP model (e.g. Hettelingh et al. 2013), and the most recent critical load database (Posch et al. 2012). The 1980–2000
depositions were downloaded from the EMEP website (www.emep.int/mscw) and they were calculated on the 50×50 km2 EMEP grid. For the years 2010-2030
depositions are based on EMEP calculations with a newer model version on the 0.50º×0.25º longitude-latitude grid. This chapter partly bears on work performed under the LRTAP Convention (ICP M&M 2013; WGE 2013a,b). In this chapter the location and trends of critical load exceedances, i.e. the CSI 005 indicator, are provided until 2030.
Furthermore, results of a tentative assessment of a selected indicator for biodiversity, i.e. species richness in grasslands, are presented. These biodiversity-related results are based on the tentative application of a N dose-response relationship (Stevens et al. 2010a,b) on specific European grasslands that are distinguished according to the European Nature Information System (EUNIS3), i.e. classes E1, E2 and E3. This use of
the dose-response relationship can illustrate species
3 See http://eunis.eea.europa.eu/about.jsp.
Figure 1.1: The temporal development since 1880 of the area at risk (in %; left) and magnitude (in eq ha–1yr–1; right) of exceedance (AAE) of critical loads for acidification (red) and of nutrient nitrogen (green)
using the GP-CLE scenario depositions from 2010 onwards.
80Ecosystem area exceeded (%) Ecosystem area exceeded (%)
1880 1910 1940 1970 2000 2030 1880 1910 1940 1970 2000 2030 70 60 50 40 30 20 10 400 350 300 250 200 150 100 50
richness — for any N emission scenario — as a percentage compared with a hypothesized 100% species richness at zero N deposition. It should be noted that the assessment results of this biodiversity indicator are uncertainty prone.
1.2 Trends of acidification and
eutrophication since 1880
New methods and data as described above have enabled the revision of calculated exceedances and areas at risk caused by depositions (MSC-W 2013) due to a combination of the revised Gothenburg Protocol and Current Legislation scenario (GP-CLE) provided by the CIAM at the International Institute for Applied Systems Analysis.
Exposure in a natural area for which critical loads are available is calculated as the Average Accumulated Exceedance (AAE; Posch et al. 2001), i.e. area-weighted average of the exceedance of all critical loads in an area. The AAE can be computed for any region, i.e. for all natural areas in a country, for any class of natural areas (EUNIS classification) or for a subset of natural areas (e.g. Natura 2000 areas). Figure 1.1 illustrates the European ecosystem area, where critical loads are exceeded, and the AAE based on emission trends since 1880 (Schöpp et al. 2003), deposition patterns following different versions of the EMEP model (e.g. Hettelingh et al. 2013) and the most recent critical load database (Posch et al. 2012). Assuming the GP-CLE scenario to be implemented as of 2010, Figure 1.1 shows that both the percentage of the European ecosystem area of which critical loads for acidification are exceeded, i.e. the area at risk of
Figure 1.2. Average Accumulated Exceedance (AAE in eq ha–1yr–1) of critical loads for acidification in 1980
(top left), 1990 (top centre), 2000 (top right), 2010 (bottom left), 2020 under the revised Gothenburg protocol (GP-CLE scenario) emission reduction agreements (bottom centre), and in 2030 under Maximum Feasible Reductions (bottom right).
eq ha-1a-1 no exceedance <200 200 - 400 400 - 700 700 - 1200 > 1200 eq ha-1a-1 no exceedance <200 200 - 400 400 - 700 700 - 1200 > 1200 eq ha-1a-1 no exceedance <200 200 - 400 400 - 700 700 - 1200 > 1200 eq ha-1a-1 no exceedance <200 200 - 400 400 - 700 700 - 1200 > 1200 eq ha-1a-1 no exceedance <200 200 - 400 400 - 700 700 - 1200 > 1200 eq ha-1a-1 no exceedance <200 200 - 400 400 - 700 700 - 1200 > 1200 1980 1990 2000 2010 2020 2030 CCE
Dep-data: EMEP/MSCW Dep-data: EMEP/MSCWCCE Dep-data: EMEP/MSCWCCE CCE
Dep-data: EMEP/MSCW Dep-data: EMEP/MSCWCCE Dep-data: EMEP/MSCWCCE
acidification (%; left), as well as its AAE (eq ha–1yr–1;
right) in 2030 are similar to 1880, i.e. about 2% and 5 eq ha–1yr–1, respectively. The peaks of the acidified
area and AAE occur in 1980.
Figure 1.1. also illustrates that areas where critical loads of nutrient nitrogen are exceeded, continue to remain a serious issue under GP-CLE emissions. Eutrophication affects about 55% (54% in the EU28) of the European ecosystem area in year 2020 (target year for the Revised Gothenburg Protocol) with an AAE of about 144 eq ha–1yr–1 (159 eq ha–1yr–1 in the
EU28). In 2030, assuming a further implementation of GP-CLE abatement after 2020, the area at risk of eutrophication is slightly lower, i.e. 53% (51% in the EU28). Note that the European area at risk of eutrophication has increased in comparison to computations made with “old” (EMEP and critical loads) methods and data available for in support of the negotiations for the revised Gothenburg protocol, i.e. 42% with an AAE of 109 eq ha–1yr–1 on
the EMEP resolution of 50×50 km2 (Reis et al. 2012;
see also Table A.2 in the Annex to this chapter). Finally it can be noted from Figure 1.1, that computed eutrophication already existed in 1880. The area at
risk then is already exceeding 26%, which is likely to be caused by emissions of reduced N in particular (Kopáček and Posch, 2011). The peaks of eutro-phication come a decade later than acidification, due to the fact that policies focussed on sulphur reduction and not on curbing N emissions. N emission reduction seemed less urgent at the time and started later.
1.3 Maps and Tables of acidification
and eutrophication since 1980
In this section both maps and country tables of the CSI 005 indicator are provided for acidity and
eutrophication. The CSI 005 indicator (exposure) is characterised by both the magnitude (AAE; eq ha–1yr–1 )
as well as area (% of ecosystems) of critical load exceedance. The AAE is given for all ecosystem areas in Europe and for Natura 2000 areas in the EU28. The area at risk is expressed in this chapter as the percentage of the ecosystem area in a country where deposition exceeds critical loads. Results in the maps and tables in the following section are based on the GP-CLE and MFR scenarios for 2020 and 2030, respectively.
1.3.1 CSI 005 for acidification
Figure 1.2 shows the exposure and area at risk in
European countries in the EMEP domain as of 1980. The success of the reduction of acidifying emissions since 1980 is clearly demonstrated by a reduction of
Table 1.1. Ecosystems at risk of acidification (% of total ecosystem area) and the exceedance (AAE in eq ha–1yr–1) in each country between 1980 and 2030.
Acidification 1980 1990 2000 2005 2010 GP-CLE 2020 MFR 2030
Area AAE Area AAE Area AAE Area AAE Area AAE Area AAE Area AAE
Albania 0 0 0 0 0 0 0 1 0 0 0 0 0 0 Armenia 7 27 7 25 0 0 0 0 0 0 0 0 0 0 Austria 43 590 18 100 1 2 1 1 0 0 0 0 0 0 Azerbaijan 2 7 10 53 0 0 1 1 1 1 1 2 1 1 Belarus 76 736 73 671 18 52 15 38 12 28 6 10 5 7 Belgium 99 3411 95 1271 49 227 13 62 7 20 1 3 0 0 Bosnia-Herzegovina 31 528 25 386 16 90 12 61 10 41 2 1 1 0 Bulgaria 18 212 10 97 0 0 0 0 0 0 0 0 0 0 Croatia 35 442 11 98 4 26 5 32 4 17 2 3 0 0 Cyprus 0 0 0 0 0 0 0 0 0 0 0 0 0 0 Czech Republic 100 5123 100 3681 95 763 85 546 75 343 50 123 11 13 Denmark 96 1942 86 1066 49 317 36 112 20 26 1 2 0 0 Estonia 26 134 22 93 0 1 0 0 0 0 0 0 0 0 Finland 34 69 24 32 1 0 0 0 0 0 0 0 0 0 France 24 322 20 122 12 43 10 39 7 13 3 3 0 0 Georgia 13 47 11 28 0 0 3 4 3 4 4 7 3 4 Germany 95 4238 93 2299 47 230 28 89 18 47 5 13 0 1 Greece 10 65 7 43 2 7 3 19 2 9 1 1 0 0 Hungary 73 1898 55 780 24 105 22 90 8 38 5 11 1 1 Iceland 18 12 22 19 7 3 8 5 4 1 3 1 7 7 Ireland 33 153 19 63 14 38 3 3 0 0 0 0 0 0 Italy 18 219 12 77 3 12 1 4 0 1 0 1 0 0 Latvia 46 458 44 431 21 38 14 23 9 13 3 3 1 0 Lithuania 77 1123 71 1024 37 211 34 170 34 154 30 86 26 36 Luxembourg 86 1995 59 725 18 187 14 102 13 80 12 32 0 0 Macedonia, FYR 19 120 18 96 3 6 11 39 6 12 0 0 0 0 Moldova 33 404 30 160 1 2 1 2 0 0 0 0 0 0 Netherlands 87 6171 86 3687 82 1739 77 1192 74 864 63 518 52 321 Norway 35 215 37 219 21 76 8 13 5 6 2 1 2 1 Poland 100 3175 100 2451 65 419 46 243 43 217 24 74 5 7 Portugal 4 19 4 14 4 15 2 3 1 2 0 1 0 0 Romania 45 346 37 275 4 16 3 11 1 3 0 0 0 0 Russia 22 81 23 92 2 3 2 2 1 1 0 0 0 0
Serbia & Mont. 39 388 32 253 12 28 17 52 13 30 0 0 0 0
Slovakia 86 2471 83 1573 21 134 10 45 6 24 3 6 0 0 Slovenia 35 609 23 190 3 9 2 5 0 1 0 0 0 0 Spain 3 28 3 16 1 6 1 4 0 0 0 0 0 0 Sweden 59 366 59 311 36 107 12 18 9 11 6 4 5 3 Switzerland 49 700 26 191 7 29 12 52 9 32 5 18 3 12 Turkey 1 3 1 3 1 1 1 2 1 3 1 3 1 3 Ukraine 73 859 62 579 4 10 2 4 1 2 0 0 0 0 United Kingdom 76 774 53 323 26 115 14 37 7 17 3 6 1 1 EU281 43 758 37 464 18 82 10 39 7 26 4 9 2 3 Europe2 30 370 28 251 10 40 6 19 4 12 2 5 1 2
1The 28 countries of the European Union
the area with exceedances of, e.g., more than 1200 eq ha-1yr-1 (red shading) between 1980 and 2030.
The reduction of both the area at risk as well as of the magnitude of the exceedance of critical loads for acidification is confirmed in Table 1.1. The European area at risk of acidification is reduced from 30% (43% in the EU28) in 1980 to 2% in 2020 (4% in the EU28). Finally, in 2030 under MFR, only 1% of the ecosystems is computed to have an exceedance of critical loads for acidification.
As is shown in Table 1.2 the percentages do not significantly increase if the focus is on Natura 2000 areas. In Table 1.2 results are shown for the revised Gothenburg Protocol in the base year 2005, in 2010 and in the Protocol target year 2020. Application of MFR is shown for 2030. In 2005 the ecosystem area at risk (all EUNIS classes) in the EU28 is 10% (Table 1.1), while the percentage of Natura 2000 areas at risk in that year is 8% (Table 1.2). In 2020 the percentage Natura2000 areas at risk of acidification
Table 1.2. The Natura 2000 area (%) at risk of acidification and the exceedance (AAE in eq ha–1yr–1) in the
EU28 countries between 2005 and 2030.
Acidification 2005 2010 GP-CLE2020 MFR2030
Area AAE Area AAE Area AAE Area AAE
Austriaa – – – – – – – – Belgiuma – – – – – – – – Bulgariaa – – – – – – – – Croatiab – – – – – – – – Cyprusc 0 0 0 0 0 0 0 0 Czech Rep. 78 479 65 300 41 107 10 11 Denmarkc 23 67 12 19 1 1 0 0 Estoniac 0 0 0 0 0 0 0 0 Finlandc 0 0 0 0 0 0 0 0 France 10 40 7 13 3 3 0 0 Germany 27 79 16 40 4 11 0 0 Greecec 5 23 3 10 1 2 0 0 Hungaryc 15 43 3 11 1 3 0 0 Ireland 2 5 2 3 2 1 0 1 Italy 0 1 0 0 0 0 0 0 Latviac 14 24 9 14 4 5 3 1 Lithuaniac 41 192 40 170 35 90 30 33 Luxembourgc 28 206 27 164 25 65 1 1 Maltab – – – – – – – – Netherlands 76 1.046 73 732 62 401 48 223 Polanda – – – – – – – – Portugalc 2 5 1 3 1 2 1 1 Romaniac 3 13 1 4 0 0 0 0 Slovakiac 13 56 8 30 3 6 0 0 Slovenia 2 5 1 1 0 0 0 0 Spainc 1 2 0 0 0 0 0 0 Sweden 12 16 9 10 5 3 5 2 United Kingdoma – – – – – – – – EU28 8 32 5 16 2 6 1 2
aNFC submittd critical load, but did not distinguish Natura 2000 areas. bNo information on Natura 2000 areas (yet).
in the EU28 is 2%, which does not change in 2030 under MFR. Compared to 2005 the protection of Natura 2000 areas against acidification increases by 75% and 87% in 2020 and 2030, respectively.
1.3.2 CSI 005 for eutrophication
Figure 1.3 shows the exposure to eutrophication (AAE in eq ha–1yr–1) , and ecosystem area (all EUNIS
classes) at risk (%) in Europe as of 1980 to 2020 under GP-CLE and 2030 under MFR.
The trend of areas in Europe between 1980 and 2020 (GP-CLE) and 2030 (MFR) where critical loads for eutrophication are exceeded confirms the continued stress to European ecosystems, in Central Europe in particular (Figure 1.3). The broad Central European area of high exceedances in 1980 (red shading) is markedly reduced in 2020 under current legislation, but still occurs in western France and the border areas between the Netherlands, Belgium and Germany, as well as in northern Italy. These areas at relatively high risk are further reduced when N emissions are mitigated due to the application of maximal feasible reduction techniques in 2030.
The downward trend since 1980 of the area at risk of eutrophication is confirmed in Table 1.3. Since 1980 the area at risk of excessive N deposition has decreased from 75% to 55% in 2020 under the revised Gothenburg Protocol. The area at risk is reduced to about 49% when maximum feasible reductions are applied. The area at risk of
eutrophication in the EU28 decreases from 80% in 1980 to 67% in 2005 and further to 40% in 2030 when MFR would be applied.
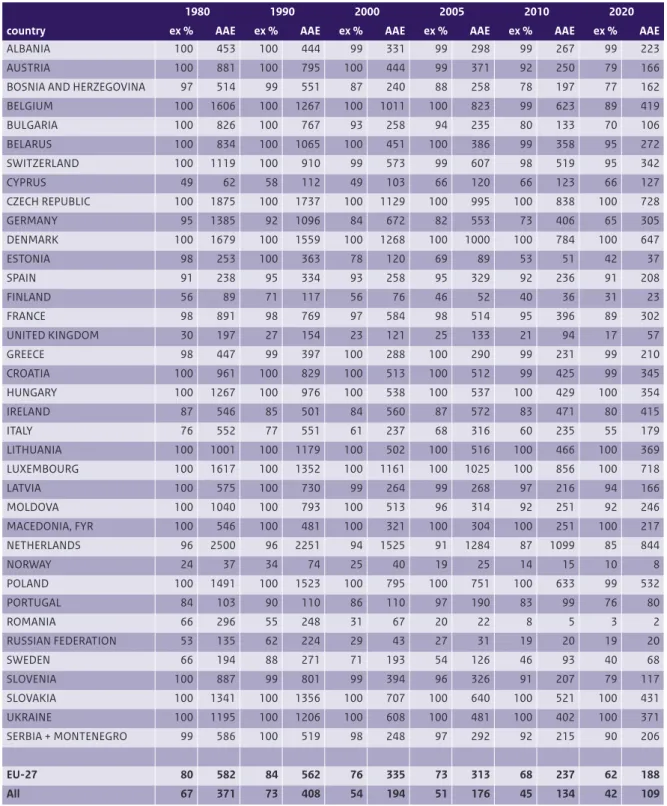
Note, that with the ‘old’ methods and data used to support the revision of the Gothenburg (Reis et al. 2012) the area at risk of eutrophication in the EU27 was computed to be higher than with the current methodology and data, i.e. 73% in 2005 and 62% in 2020 (see also Table A.2 in the Annex to this chapter).
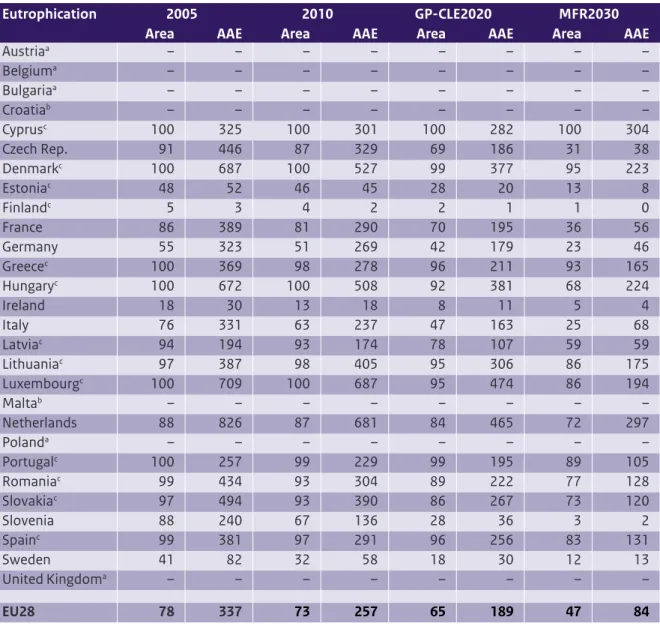
However, it turns out that the risk of eutrophication is significantly higher when computed for Natura 2000 areas (Table 1.4). In 2005 and 2020 the area at risk of Natura 2000 areas is computed to become 78% and 65% respectively. The risk of eutrophication in Natura 2000 areas in 2030 is reduced to 47% under MFR.
Figure 1.3 Average Accumulated Exceedance (AAE in eq ha–1 yr–1) of critical loads for eutrophication are
exceeded by N deposition between 1980 (top left), GP-CLE 2020 (bottom centre) and MFR 2030 (bottom right). eq ha-1a-1 no exceedance <200 200 - 400 400 - 700 700 - 1200 > 1200 1980 eq ha-1a-1 no exceedance <200 200 - 400 400 - 700 700 - 1200 > 1200 1990 eq ha-1a-1 no exceedance <200 200 - 400 400 - 700 700 - 1200 > 1200 2000 eq ha-1a-1 no exceedance <200 200 - 400 400 - 700 700 - 1200 > 1200 2030 eq ha-1a-1 no exceedance <200 200 - 400 400 - 700 700 - 1200 > 1200 2020 eq ha-1a-1 no exceedance <200 200 - 400 400 - 700 700 - 1200 > 1200 2010 CCE Dep-data: EMEP/MSCW CCE Dep-data: EMEP/MSCW CCE Dep-data: EMEP/MSCW CCE Dep-data: EMEP/MSCW CCE Dep-data: EMEP/MSCW CCE Dep-data: EMEP/MSCW
Table 1.3: Areas at risk (%) of eutrophication and the Average Accumulated Exceedance (AAE in eq ha-1yr-1)
from 1980 to 2030 for all EUNIS classes. The exceedances in 2020 and 2030 are computed according to the GP-CLE and MFR scenario, respectively.
Eutrophication 1980 1990 2000 2005 2010 GP-CLE 2020 MFR 2030
Area AAE Area AAE Area AAE Area AAE Area AAE Area AAE Area AAE
Albania 100 474 100 465 100 374 92 289 87 241 81 218 75 191 Armenia 99 456 99 571 97 315 100 383 100 414 100 455 100 442 Austria 100 749 100 675 99 411 81 316 70 230 51 134 16 19 Azerbaijan 97 332 100 515 95 256 100 321 100 350 100 397 100 356 Belarus 100 730 100 932 100 423 100 460 100 466 100 397 100 369 Belgium 74 289 50 95 37 61 4 7 2 3 1 1 0 0 Bosnia &Herzegovina 87 500 88 529 78 285 72 233 70 177 67 131 61 87 Bulgaria 100 728 100 667 91 181 77 165 63 123 38 52 27 18 Croatia 100 859 100 733 99 479 96 502 89 362 82 262 68 127 Cyprus 100 236 100 297 100 323 100 281 100 259 100 243 100 252 Czech Rep. 99 1275 99 1161 97 646 94 516 91 388 80 229 42 52 Denmark 100 1243 100 1147 100 1028 100 718 100 533 99 365 94 197 Estonia 61 130 76 200 48 75 37 38 35 33 18 16 10 8 Finland 24 20 33 33 26 23 11 7 8 4 3 1 2 0 France 100 726 99 623 97 485 89 437 84 333 74 230 43 72 Georgia 93 377 88 286 67 100 83 276 84 308 86 351 86 329 Germany 82 940 73 743 66 527 57 373 54 316 46 218 27 59 Greece 100 501 100 453 100 361 100 377 98 285 95 219 91 172 Hungary 100 1133 100 862 100 509 100 667 100 501 90 370 66 215 Iceland 0 0 0 0 0 0 0 0 0 0 0 0 0 0 Ireland 40 79 35 64 45 114 24 39 17 23 11 14 6 5 Italy 94 704 93 685 84 431 74 367 63 271 48 195 28 88 Latvia 99 500 100 642 93 251 93 201 92 179 75 112 56 63 Lithuania 100 825 100 977 99 412 98 390 99 416 97 318 85 184 Luxembourg 100 1499 100 1258 100 1154 100 727 100 699 97 504 92 235 Macedonia, FYR 100 537 100 472 100 345 91 280 83 216 73 151 60 113 Moldova 100 1004 100 768 100 492 100 407 100 347 100 309 93 272 Netherlands 96 1996 95 1793 93 1233 90 957 88 792 85 559 75 373 Norway 23 35 33 69 28 56 5 5 3 2 1 1 0 0 Poland 95 852 95 869 79 384 74 328 74 350 64 223 40 68 Portugal 100 302 100 305 100 304 100 264 100 234 99 194 86 98 Romania 100 931 100 858 98 552 99 493 96 356 92 269 83 165 Russia 64 159 71 221 51 88 48 78 45 67 40 52 39 51
Serbia & Mont. 100 585 100 516 97 274 83 345 80 275 74 196 62 127
Slovakia 100 1212 100 1223 100 677 98 524 95 415 89 287 77 129 Slovenia 99 807 99 722 96 384 91 265 75 157 34 42 4 3 Spain 99 370 100 464 100 396 99 400 96 308 95 273 85 143 Sweden 61 163 83 232 70 193 36 62 30 42 19 19 10 7 Switzerland 100 914 100 730 98 538 75 579 74 510 66 403 57 297 Turkey 99 198 99 255 99 258 99 269 100 288 100 292 100 341 Ukraine 100 1070 100 1055 100 619 100 520 100 489 100 424 100 388 United Kingdom 80 421 76 324 72 310 53 170 43 96 27 38 7 6 EU28 80 518 84 505 78 336 67 280 63 221 54 159 40 73 Europe 75 333 79 361 69 225 63 200 60 175 55 144 49 115
1.4 Tentatively assessing plant species
diversity in selected European
ecosystems
4Excessive nitrogen is known to affect plant species richness and a functional relationship between deposition and species richness can be derived (Bobbink et al. 1998; Stevens et al. 2004; Emmett et
4 This text relies upon Hettelingh et al. (2015). A summary has also
been published in WGE (2013a).
al. 2007), whereby species richness is considered a proxy for ecosystem multi-functionality.
The invitation by the Executive Body of the LRTAP Convention in 2007 to its Working Group on Effects “…to consider further quantification of policy relevant effect indicators such as biodiversity change, and to link them to integrated modelling work” (UNECE 2007) has stepped up work by International Cooperative Programmes to review biodiversity indicators (Hettelingh et al. 2009; WGE 2013a,b) and possibly apply them in scenario analyses.
Table 1.4. The Natura 2000 area (%) at risk of eutrophication and the AAE in the EU28 countries between 2005 and 2020.
Eutrophication 2005 2010 GP-CLE2020 MFR2030
Area AAE Area AAE Area AAE Area AAE
Austriaa – – – – – – – – Belgiuma – – – – – – – – Bulgariaa – – – – – – – – Croatiab – – – – – – – – Cyprusc 100 325 100 301 100 282 100 304 Czech Rep. 91 446 87 329 69 186 31 38 Denmarkc 100 687 100 527 99 377 95 223 Estoniac 48 52 46 45 28 20 13 8 Finlandc 5 3 4 2 2 1 1 0 France 86 389 81 290 70 195 36 56 Germany 55 323 51 269 42 179 23 46 Greecec 100 369 98 278 96 211 93 165 Hungaryc 100 672 100 508 92 381 68 224 Ireland 18 30 13 18 8 11 5 4 Italy 76 331 63 237 47 163 25 68 Latviac 94 194 93 174 78 107 59 59 Lithuaniac 97 387 98 405 95 306 86 175 Luxembourgc 100 709 100 687 95 474 86 194 Maltab – – – – – – – – Netherlands 88 826 87 681 84 465 72 297 Polanda – – – – – – – – Portugalc 100 257 99 229 99 195 89 105 Romaniac 99 434 93 304 89 222 77 128 Slovakiac 97 494 93 390 86 267 73 120 Slovenia 88 240 67 136 28 36 3 2 Spainc 99 381 97 291 96 256 83 131 Sweden 41 82 32 58 18 30 12 13 United Kingdoma – – – – – – – – EU28 78 337 73 257 65 189 47 84
aNFC submitted critical load, but did not distinguish Natura 2000 areas. bNo information on Natura 2000 areas available
This section describes a tentative assessment on a broad scale in Europe of adverse effects of N deposition on plant species richness by applying European nitrogen deposition to an available dose-response relationship for selected grasslands. This relationship has been taken from a European gradient study by Stevens et al. (2010a,b). The tentative percentages of species richness provided in this chapter are compared to a hypothetical 100% protection at zero N deposition. The values should be used in a relative rather than absolute context, i.e. for comparing N emission reduction scenarios with respect to species richness.
Stevens et al. (2010b) surveyed 153 semi-natural acid grasslands on a transect across the Atlantic
biogeographic zone of Europe with total atmospheric N deposition ranging from 2.4 to 43.5 kg N ha–1 yr–1, covering much of the range of
deposition found in the industrialised world. The surveyed grasslands were dominated by species such as Agrostis capillaris, Festuca ovina and F. rubra, Potentilla
erecta and Galium saxatile in Belgium, Denmark,
Germany, Ireland, Northern Ireland, the Isle of Man, the Netherlands, Norway, Sweden and Great Britain. The large number of sites surveyed in Great Britain
derives from the intensive national survey of the earlier work and from the fact that Violion caninae grasslands cover a much larger area than in other countries in the study (Stevens et al. 2004). All surveys were conducted between 2002 and 2007 and between May and September, using a consistent methodology; none was either fertilized or in the vicinity of a point source of nitrogen and many were in areas where nature conservation policies applied. Within each site, five randomly located 4 m2
vegetation quadrants were surveyed. Within each quadrant all vascular plants and bryophytes were identified to species and cover was estimated by eye according to the classical phyto-sociological
approach.
For all of the sites, well documented dispersion models were used for estimating the deposition of nitrogen (see Stevens et al., 2010b). Finally, the relationship between N deposition and species richness is fitted with a negative exponential curve (dose-response or D-R function).
The harmonized European land-cover map (Cinderby et al. 2007) was used for the regionalized application of the above-mentioned D-R function. The analysis
Figure 1.4. Species richness in grasslands (EUNIS classes E1, E2 and E3) in 1980 (top left), 1990 (top middle), 2000 (top right), in 2010 (bottom left), 2020 under the revised Gothenburg Protocol (bottom middle) and Maximum Feasible Reductions scenario in 2030 (bottom right).
Sprich% < 70 70 - 75 75 - 80 80 - 85 85 - 90 > 90 Sprich% < 70 70 - 75 75 - 80 80 - 85 85 - 90 > 90 Sprich% < 70 70 - 75 75 - 80 80 - 85 85 - 90 > 90 Sprich% < 70 70 - 75 75 - 80 80 - 85 85 - 90 > 90 Sprich% < 70 70 - 75 75 - 80 80 - 85 85 - 90 > 90 Sprich% < 70 70 - 75 75 - 80 80 - 85 85 - 90 > 90 CCE Dep-data: EMEP/MSCW CCE Dep-data: EMEP/MSCW CCE
Dep-data: EMEP/MSCW Dep-data: EMEP/MSCWCCE Dep-data: EMEP/MSCWCCE
CCE Dep-data: EMEP/MSCW 2020 2030 2000 1990 1980 2010
was carried out for EUNIS classes E1 (‘Dry grasslands’), E2 (‘Mesic grasslands’) and E3 (‘Seasonally wet and wet grasslands’) restricted to locations with precipitation between 490 and 1970 mm yr–1, altitude below 800 m and soil pH < 5.5. The
limitation of available precipitation data excluded areas located east of 32 ºE, resulting in a coverage of about 446,000 km2.
Figure 1.4 shows how the area with a computed species richness below 70% (red shading) in 1980 clearly diminishes in subsequent decades.
It should be noted that the outcome of regional assessments of species richness does not
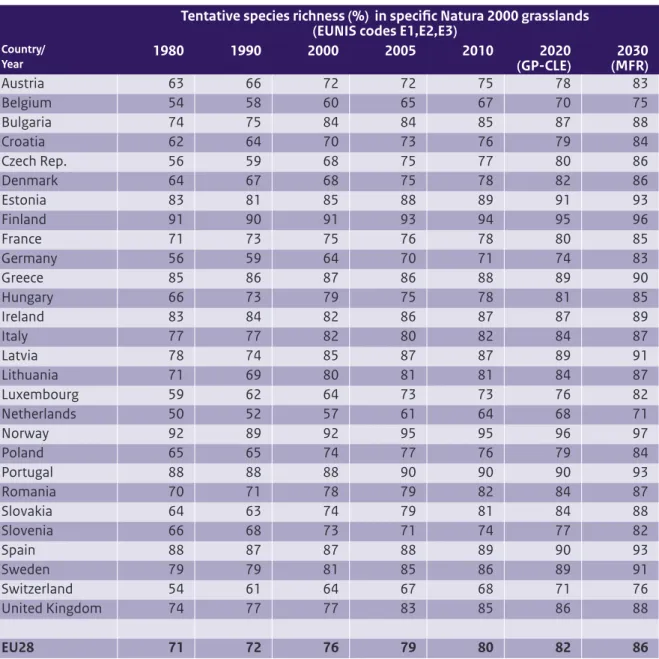
significantly change when the analysis is restricted to E1, E2 and E3 grasslands within Natura 2000 areas. Table 1.5 shows the area-weighted average species richness per country by overlaying Natura 2000 areas on the European background database (Reinds et al. 2008). It turns out that the overall area-weighted average species richness in E1, E2 and E3 grasslands in 1980 (high N deposition) is lower than in 2020 under GP-CLE, i.e. 82%. Application of MFR in 2030 is computed to lead to a further increase of
Table 1.5 Area-weighted average species richness per country in Natura 2000 areas with EUNIS classes E1, E2 and E3 grasslands west of 32ºE between 1980 and 2020 (GP-CLE scenario) and the MFR scenario for 2030 compared to a hypothetical species richness of 100% at zero N deposition.
Tentative species richness (%) in specific Natura 2000 grasslands (EUNIS codes E1,E2,E3)
Country/ Year 1980 1990 2000 2005 2010 (GP-CLE)2020 (MFR)2030 Austria 63 66 72 72 75 78 83 Belgium 54 58 60 65 67 70 75 Bulgaria 74 75 84 84 85 87 88 Croatia 62 64 70 73 76 79 84 Czech Rep. 56 59 68 75 77 80 86 Denmark 64 67 68 75 78 82 86 Estonia 83 81 85 88 89 91 93 Finland 91 90 91 93 94 95 96 France 71 73 75 76 78 80 85 Germany 56 59 64 70 71 74 83 Greece 85 86 87 86 88 89 90 Hungary 66 73 79 75 78 81 85 Ireland 83 84 82 86 87 87 89 Italy 77 77 82 80 82 84 87 Latvia 78 74 85 87 87 89 91 Lithuania 71 69 80 81 81 84 87 Luxembourg 59 62 64 73 73 76 82 Netherlands 50 52 57 61 64 68 71 Norway 92 89 92 95 95 96 97 Poland 65 65 74 77 76 79 84 Portugal 88 88 88 90 90 90 93 Romania 70 71 78 79 82 84 87 Slovakia 64 63 74 79 81 84 88 Slovenia 66 68 73 71 74 77 82 Spain 88 87 87 88 89 90 93 Sweden 79 79 81 85 86 89 91 Switzerland 54 61 64 67 68 71 76 United Kingdom 74 77 77 83 85 86 88 EU28 71 72 76 79 80 82 86
plant species richness, to reach 86% in acid grasslands.
Finally, it should be understood that this tentative assessment of species richness on a regional scale is quite uncertain. Uncertainties include the
appropriateness of:
(a) assuming species richness to be a suitable indicator for assessing scenario-specific “no net loss of biodiversity”;
(b) assuming 100% species richness at zero N deposition;
(c) applying on a regional scale, a dose-response relationship obtained from a gradient study of site specific information;
(d) having grasslands be the targeted receptor in all countries, while countries may in fact be interested in a favourable conservation status of the
biodiversity in other than grassland ecosystems; and (e) allowing an extrapolation from E1.7 and E1.9 to E1, E2 and E3 grasslands.
The CCE is currently collaborating with National Focal Centres of the ICP M&M to improve the choice of indicators for the assessment of “no net loss of biodiversity”. A call for data in this respect, to be conducted by the CCE, has been issued by the Working Group on Effects of the LRTAP Convention in 2012 with a deadline in 2014. Initial results of this call for data are described in Chapter 2 of this report.
1.5 Summary, conclusions and
recommendations
In this chapter the Core Set Indicator for the “Exposure of ecosystems to acidification,
eutrophication and ozone” (CSI 005) is reviewed with focus on acidification and eutrophication. Methods and data developed and used in 2013-2014 under the LRTAP Convention in the field of national emissions, atmospheric modelling and of critical loads were used to compute exceedances of critical loads for acidification and eutrophication. In addition, a dose-response relationship between N deposition and plant species richness, which has been scientifically established for specific sites, has tentatively been applied to selected European acid grasslands.
In this chapter information is provided on time series of the CSI 005 indicators for acidification and eutrophication in Europe as a whole since 1880, and for countries separately since 1980 for selected
years. However, the focus in this summary is on the effects of acidifying and eutrophying depositions due to emissions in the base year 2005 and target year 2020 of the revised Gothenburg Protocol established in 2012. In addition simulation results are shown for 2030 assuming an application of maximum feasible emission reductions.
The area at risk of acidification in Europe improves from 6 % (8% in Natura 2000 areas) in 2005 to 2 % (2% in Natura 2000 areas) in 2020. For
eutrophication these percentages are 63% (78% in Natura 2000 areas) and 55% (65% in Natura 2000 areas), respectively. The area at risk of
eutrophication would be further reduced to cover 49% in 2030 when maximum feasible emission reductions would be implemented. Finally, species richness in grasslands in Natura 2000 areas would increase from 71% in 1980 to 82% in 2020. In Chapters 3 and 4 of this report, methods are proposed for identifying indicators to assess
scenario-specific changes of biodiversity in European nature.
References
Bobbink R, Hornung M, Roelofs JGM, 1998. The effects of air-borne nitrogen pollutants on species diversity in natural and semi-natural European vegetation. Journal of Ecology 86, 717-738
Cinderby S, Emberson L, Owen A, Ashmore M, 2007. LRTAP land cover map of Europe. In: Slootweg J, Posch M, Hettelingh J-P (eds), op. cit, pp. 59-70 Davies CE and Moss D, 1999. EUNIS Habitat
Classification. Copenhagen: European
Environment Agency
EC, 1992, Council Directive 92/43/EEC of 21 May 1992 on the conservation of natural habitats and of wild fauna and flora, http://eur-lex.europa.eu/ legal-content/EN/TXT/
PDF/?uri=CELEX:01992L0043-20070101&from=EN
EEA, 2014. Effects of Air Pollution on European Ecosystems: Past and future exposure of European freshwater and terrestrial habitats to acidifying and eutrophying air pollutants, European Environment Agency, Technical report 11/2014 prepared by the CCE with contributions from the ETC-ACM and the EEA, http://www.eea. europa.eu/publications/
effects-of-air-pollution-on
Emmett B, Ashmore M, Britton A, Broadmeadow M, Bullock J, Cape N, Caporn SJM, Carroll JA, Cooper JR, Cresser MS, Crossley A, D’Hooghe P, De Lange I, Edmondson J, Evans CD, Field C, Fowler D, Grant H, Green E, Griffiths B, Haworth B, et
al., 2007. Terrestrial Umbrella: effects of
eutrophication and acidification on terrestrial
ecosystems. Final report. NERC/Centre for Ecology
& Hydrology, 288 pp. (CEH Project Number: C02613, DEFRA Contract No. CPEA 18) Gauger T, Anshelm F, Schuster H, Erisman JW,
Vermeulen AT, Draaijers GPJ, Bleeker A, Nagel H-D, 2002. Mapping of ecosystems specific long-term trends in deposition loads and concentrations of air pollutants in Germany and their comparison with critical loads and critical levels. Institut für Navigation. University of Stuttgart, Germany
Hettelingh J-P, Posch M, Slootweg J (eds.), 2009. Progress in the modelling of critical thresholds, impacts to plant species diversity and ecosystem services in Europe, CCE Status Report 2009, ISBN 978-90-78645-32-0, http://www.wge-cce. org/
Publications/
CCE_Status_Reports/Status_Report_2009
Hettelingh J-P, Posch M, Slootweg J, 2012. Assessing the effects of the Gothenburg protocol. In: Posch M, Slootweg J, Hettelingh J-P (eds), 2012. Modelling and mapping of atmospherically-induced ecosystem impacts in Europe, CCE Status Report 2012. ISBN: 978-90-6960-262-2, Bilthoven, pp. 13–20; http://www.wge-cce.org/ Publications/
CCE_Status_Reports/Status_Report_2012 Hettelingh J-P, Posch M, Velders GJM, Ruyssenaars P,
Adams M, De Leeuw F, Lükewille A, Maas R, Sliggers J, Slootweg J, 2013. Assessing interim objectives for acidification, eutrophication and ground-level ozone of the EU National Emission Ceilings Directive with 2001 and 2012 knowledge. Atmospheric Environment 75:129-140 Hettelingh J-P, Stevens CJ, Posch M, Bobbink R, De
Vries W, 2015. Assessing the impacts of nitrogen deposition on indicator values of plant species in Europe. Chapter 23 in De Vries W, Hettelingh J-P, Posch M (eds) Critical Loads and Dynamic Risk
Assessments of Nitrogen, Acidity and Metals for
Terrestrial and Aquatic Ecosystems. Springer (in press)
ICP M&M, 2013. Report by the Coordination Centre for Effects and the Task Force of the
International Cooperative Programme on Modelling and Mapping Critical Loads and Levels and Air Pollution Effects, Risks and Trends, presented at the 32nd session of the
Working Group on Effects, Geneva 12-13 September 2013, ECE/EB.AIR/WG.1/2013/10 Kopáček J, Posch M, 2011. Anthropogenic nitrogen
emissions during the Holocene and their possible effects on remote ecosystems. Global
Biogeochemical Cycles 25: GB2017 (16 pp)
MSC-W, 2013. Deposition files sent to the CCE in April 2013.
Posch M, Hettelingh J-P, De Smet PAM, 2001. Characterization of critical load exceedances in Europe. Water, Air and Soil Pollution 130:
1139-1144.
Posch M, Slootweg J, Hettelingh J-P (eds), 2012. Modelling and Mapping of atmospherically-induced ecosystem impacts in Europe: CCE Status Report 2012. RIVM Report 680359004, ISBN: 978-90-6960-262-2, Coordination Centre for Effects, Bilthoven, Netherlands, http://www. wge-cce.org/Publications/CCE_Status_Reports/ Status_Report_2012
Reinds GJ, Posch M, De Vries W, Slootweg J, Hettelingh J-P, 2008. Critical loads of sulphur and nitrogen for terrestrial ecosystems in Europe and Northern Asia using different soil chemical criteria. Water, Air and Soil Pollution 193, 269–287
Reis S, Grennfelt P, Klimont Z, Amann M, ApSimon H, Hettelingh J-P, Holland M, LeGall A-C, Maas R, Posch M, Spranger T, Sutton MA, Williams M, 2012. From acid rain to climate change. Science 338, 1153–1154
Schöpp W, Posch M, Mylona S, Johansson M, 2003. Long-term development of acid deposition (1880-2030) in sensitive freshwater regions in Europe. Hydrology and Earth System Sciences 7(4): 436-446
Simpson D, Benedictow A, Berge H, Bergström R, Emberson LD, Fagerli H, Flechard CR, Hayman GD, Gauss M, Jonson JE, Jenkin ME, Nyiri A, Richter C, Semeena VS, Tsyro S, Tuovinen J-P, Valdebenito A, Wind P, 2012. The EMEP MSC-W chemical transport model – technical
description. Atmospheric Chemistry and Physics 12, 7825–7865
Slootweg J, Posch M, Hettelingh J-P (eds), 2007. Critical Loads of Nitrogen and Dynamic Modelling: CCE Progress Report 2007. MNP Report 5000900001, ISBN 9789069601755, Coordination Centre for Effects, Bilthoven, Netherlands, http://www.wge-cce.org/ Publications/
CCE_Status_Reports/Status_Report_2007 Stevens CJ, Dise NB, Mountford JO, Gowing DJ, 2004. Impact of nitrogen deposition on the species richness of grasslands. Science 303, 1876-1879
Stevens CJ, Thompson K, Grime P, Long CJ, Gowing DJG, 2010a. Contribution of acidification and eutrophication to declines in species richness of calcifuge grasslands along a gradient of
atmospheric nitrogen deposition. Functional
Ecology 24, 478-484
Stevens CJ, Duprè C, Dorland E, Gaudnik C, Gowing DJG, Bleeker A, Diekmann M, Alard D, Bobbink R, Fowler D, Corcket E, Mountford JO, Vandvik V, Aarrestad PA, Muller S, Dise NB, 2010b. Nitrogen deposition threatens species richness of
grasslands across Europe. Environmental Pollution 158, 2940-2945
UNECE, 2007. Report of the Executive Body on its 25th session held in Geneva from 10 to 13
December 2007, ECE/EB.AIR/91, art.32, para. n UNECE, 2012a. United Nations Economic
Commission for Europe, Parties to UNECE Air Pollution Convention approve new emission reduction commitments for main air pollutants by 2020. Press release of 4 May 2012, available from http://www.unece.org/index.
php?id=29858.
UNECE, 2012b. United Nations Economic
Commission for Europe, Decision 2012/2 of the Executive Body (see ECE/EB.AIR/113/Add.1). Available from http://www.unece.org/env/ lrtap/executivebody/eb_decision.html. WGE, 2013a. Benefits of Air pollution control for
biodiversity and ecosystem services, Report prepared for the 32nd session of the Working
Group on Effects, Convention on Long-range Transboundary Air Pollution, Geneva 12-13 September 2012, ECE/EB.AIR/WG.1/2013/14 WGE, 2013b. Guidance document on health and environmental improvements using new knowledge, methods and data, Report prepared for the 32nd session of the Working
Group on Effects, Convention on Long-range Transboundary Air Pollution, Geneva 12-13 September 2012, Informal document 4
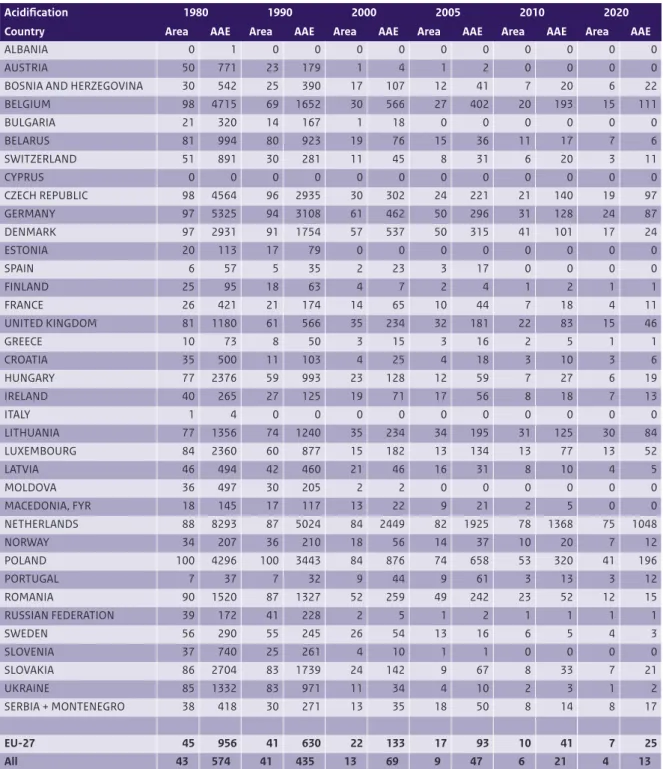
Annex 1.A: CSI 005 using ‘old’ methods
and data
This annex summarizes the CSI 005 indicator values, area at risk (%) and AAE (eq ha–1yr–1), computed with
the methods and data that have been used in
support of the revision of the Gothenburg Protocol (see Reis et al. 2012; Hettelingh et al. 2013) in 2012.
Table A.1: The ecosystem area at risk (% of total ecosystems) of acidification and the exceedance (AAE) in each country between 1980 and 2020.
Acidification 1980 1990 2000 2005 2010 2020
Country Area AAE Area AAE Area AAE Area AAE Area AAE Area AAE
ALBANIA 0 1 0 0 0 0 0 0 0 0 0 0
AUSTRIA 50 771 23 179 1 4 1 2 0 0 0 0
BOSNIA AND HERZEGOVINA 30 542 25 390 17 107 12 41 7 20 6 22
BELGIUM 98 4715 69 1652 30 566 27 402 20 193 15 111 BULGARIA 21 320 14 167 1 18 0 0 0 0 0 0 BELARUS 81 994 80 923 19 76 15 36 11 17 7 6 SWITZERLAND 51 891 30 281 11 45 8 31 6 20 3 11 CYPRUS 0 0 0 0 0 0 0 0 0 0 0 0 CZECH REPUBLIC 98 4564 96 2935 30 302 24 221 21 140 19 97 GERMANY 97 5325 94 3108 61 462 50 296 31 128 24 87 DENMARK 97 2931 91 1754 57 537 50 315 41 101 17 24 ESTONIA 20 113 17 79 0 0 0 0 0 0 0 0 SPAIN 6 57 5 35 2 23 3 17 0 0 0 0 FINLAND 25 95 18 63 4 7 2 4 1 2 1 1 FRANCE 26 421 21 174 14 65 10 44 7 18 4 11 UNITED KINGDOM 81 1180 61 566 35 234 32 181 22 83 15 46 GREECE 10 73 8 50 3 15 3 16 2 5 1 1 CROATIA 35 500 11 103 4 25 4 18 3 10 3 6 HUNGARY 77 2376 59 993 23 128 12 59 7 27 6 19 IRELAND 40 265 27 125 19 71 17 56 8 18 7 13 ITALY 1 4 0 0 0 0 0 0 0 0 0 0 LITHUANIA 77 1356 74 1240 35 234 34 195 31 125 30 84 LUXEMBOURG 84 2360 60 877 15 182 13 134 13 77 13 52 LATVIA 46 494 42 460 21 46 16 31 8 10 4 5 MOLDOVA 36 497 30 205 2 2 0 0 0 0 0 0 MACEDONIA, FYR 18 145 17 117 13 22 9 21 2 5 0 0 NETHERLANDS 88 8293 87 5024 84 2449 82 1925 78 1368 75 1048 NORWAY 34 207 36 210 18 56 14 37 10 20 7 12 POLAND 100 4296 100 3443 84 876 74 658 53 320 41 196 PORTUGAL 7 37 7 32 9 44 9 61 3 13 3 12 ROMANIA 90 1520 87 1327 52 259 49 242 23 52 12 15 RUSSIAN FEDERATION 39 172 41 228 2 5 1 2 1 1 1 1 SWEDEN 56 290 55 245 26 54 13 16 6 5 4 3 SLOVENIA 37 740 25 261 4 10 1 1 0 0 0 0 SLOVAKIA 86 2704 83 1739 24 142 9 67 8 33 7 21 UKRAINE 85 1332 83 971 11 34 4 10 2 3 1 2 SERBIA + MONTENEGRO 38 418 30 271 13 35 18 50 8 14 8 17 EU-27 45 956 41 630 22 133 17 93 10 41 7 25 All 43 574 41 435 13 69 9 47 6 21 4 13
Table A.2: The ecosystem area at risk (% of total ecosystems) of eutrophication and the exceedance (AAE) in each country between 1980 and 2020.
1980 1990 2000 2005 2010 2020
country ex % AAE ex % AAE ex % AAE ex % AAE ex % AAE ex % AAE
ALBANIA 100 453 100 444 99 331 99 298 99 267 99 223
AUSTRIA 100 881 100 795 100 444 99 371 92 250 79 166
BOSNIA AND HERZEGOVINA 97 514 99 551 87 240 88 258 78 197 77 162
BELGIUM 100 1606 100 1267 100 1011 100 823 99 623 89 419 BULGARIA 100 826 100 767 93 258 94 235 80 133 70 106 BELARUS 100 834 100 1065 100 451 100 386 99 358 95 272 SWITZERLAND 100 1119 100 910 99 573 99 607 98 519 95 342 CYPRUS 49 62 58 112 49 103 66 120 66 123 66 127 CZECH REPUBLIC 100 1875 100 1737 100 1129 100 995 100 838 100 728 GERMANY 95 1385 92 1096 84 672 82 553 73 406 65 305 DENMARK 100 1679 100 1559 100 1268 100 1000 100 784 100 647 ESTONIA 98 253 100 363 78 120 69 89 53 51 42 37 SPAIN 91 238 95 334 93 258 95 329 92 236 91 208 FINLAND 56 89 71 117 56 76 46 52 40 36 31 23 FRANCE 98 891 98 769 97 584 98 514 95 396 89 302 UNITED KINGDOM 30 197 27 154 23 121 25 133 21 94 17 57 GREECE 98 447 99 397 100 288 100 290 99 231 99 210 CROATIA 100 961 100 829 100 513 100 512 99 425 99 345 HUNGARY 100 1267 100 976 100 538 100 537 100 429 100 354 IRELAND 87 546 85 501 84 560 87 572 83 471 80 415 ITALY 76 552 77 551 61 237 68 316 60 235 55 179 LITHUANIA 100 1001 100 1179 100 502 100 516 100 466 100 369 LUXEMBOURG 100 1617 100 1352 100 1161 100 1025 100 856 100 718 LATVIA 100 575 100 730 99 264 99 268 97 216 94 166 MOLDOVA 100 1040 100 793 100 513 96 314 92 251 92 246 MACEDONIA, FYR 100 546 100 481 100 321 100 304 100 251 100 217 NETHERLANDS 96 2500 96 2251 94 1525 91 1284 87 1099 85 844 NORWAY 24 37 34 74 25 40 19 25 14 15 10 8 POLAND 100 1491 100 1523 100 795 100 751 100 633 99 532 PORTUGAL 84 103 90 110 86 110 97 190 83 99 76 80 ROMANIA 66 296 55 248 31 67 20 22 8 5 3 2 RUSSIAN FEDERATION 53 135 62 224 29 43 27 31 19 20 19 20 SWEDEN 66 194 88 271 71 193 54 126 46 93 40 68 SLOVENIA 100 887 99 801 99 394 96 326 91 207 79 117 SLOVAKIA 100 1341 100 1356 100 707 100 640 100 521 100 431 UKRAINE 100 1195 100 1206 100 608 100 481 100 402 100 371 SERBIA + MONTENEGRO 99 586 100 519 98 248 97 292 92 215 90 206 EU-27 80 582 84 562 76 335 73 313 68 237 62 188 All 67 371 73 408 54 194 51 176 45 134 42 109
Jaap Slootweg, Maximilian Posch, Jean-Paul Hettelingh
2.1 Introduction
At the 22nd CCE workshop and 28th session of the
Task Force on Modelling and Mapping (Warsaw, 16–19 April 2012) consensus was reached to propose a call for data to enable the regional assessment of country-specific endpoints for biodiversity. In response to this proposal the 31st session of the
Working Group on Effects stated:
‘Modelling air pollution impacts on vegetation and biodiversity required a broad agreement on biodiversity indicators. CCE and the ICP on Modelling and Mapping proposed a generic indicator to be chosen by a Party in view of its environmental requirements. The indicator should provide a metric for ’no net loss of biodiversity’ in regional (Task Force on Integrated Assessment Modelling)
assessments of emission reduction scenarios. The proposed call for data would focus on that simple generic biodiversity indicator. National Focal Centres would be encouraged to help develop simple ‘regional’ dose-response functions based on European Nature Information System (EUNIS) habitat classification and dynamic soil-vegetation
modelling.’ (ECE/EB.AIR/WG.1/2012/2). And, in the
same document: ‘the Working Group welcomed the
proposal for a call to National Focal Centres to help develop
a regional simple EUNIS class-specific “biodiversity
function”.’ Accordingly, in 2012 the CCE issued the Call
for Data, with a deadline in March 2014. The full text with instructions to the National Focal Centres (NFCs) can be found in Appendix A.
This chapter describes the results of the 2012–14 Call for Data. More detailed information on the national contributions – the national reports – can be found in Part 3.
2.2 A metric to describe loss of
biodiversity
Many indices for measuring loss of biodiversity have been proposed and applied both in literature and within bodies such as the Convention on Biological Diversity (CBD) and the International Union for Conservation of Nature (IUCN). At its 25th session in
2007 the Executive Body of the LRTAP Convention agreed to encourage the Working Group on Effects ‘to increase its work on quantifying effects
indicators, in particular for biodiversity.’ The effects community under the LRTAP Convention seeks to develop indicators that enable cross-border
comparisons of country impacts. Therefore, a metric
2
Summary of National
Data
needed to be developed to support the scenario analysis of biodiversity impacts in a similar way to that in which critical load exceedance is used in integrated assessment.
A possible way to achieve this was proposed in the Call for Data 2012–14 (see Appendix A) and is summarised as follows:
1. Select ecosystem types for which data is available for multiple sites in selected EUNIS classes and in related sites of special protection (Natura 2000) if possible.
2. Run a dynamic soil model to equilibrium (steady state) for a low (e.g. background deposition) and high (e.g. current legislation) nitrogen deposition scenario within each EUNIS class.
3. Apply a vegetation model to calculate plant species presence and calculate the chosen biodiversity index within each EUNIS class. The CCE divided all indices for a site by the maximum value of the index to normalise to one. Figure 2.1 (left) shows a possible time series of the computed biodiversity index for a low (red) and high deposition scenario.
Figure 2.1 (right) shows two points in a selected target year relating the biodiversity index
corresponding to the low deposition scenario and to that of the high nitrogen deposition scenario. The function connecting these points is considered the dose–response function (D–R function). The points are called dose–response points (D–R points).
In the call NFCs were asked to submit D–R points for the sites of their choice, grouped by EUNIS class, preferably at level 3. They were also asked to specify the plant species and their abundance, as well as a reference state. With these data it would be possible to (re)produce indices of all kinds, including those based on a reference state (e.g. Bray-Curtis index).
2.3 NFC submissions
Table 2.1 lists the countries and the EUNIS classes for which D–R points were submitted and the number of sites for each class. The Netherlands (NL) and the United Kingdom (GB) submitted data for different ecosystem types. All other countries provided date for forests (EUNIS class G) only, mostly ICP forest sites. Switzerland (CH) applied another approach to derive D–R functions for many sites in mountain hay
meadows (E2.3) and in evergreen alpine and subalpine heath and scrub (F2.2). A description of this approach can be found in their national report (see Part 3). Table 2.2 shows the methodology the countries applied. The CCE suggested running dynamic models up to 2100 for the scenarios:
• BKG – reducing all anthropogenic emissions to zero, leading to ‘background’ depositions • GP – implementing the Gothenburg Protocol and
keeping depositions constant until the last year of the simulation.
Other approaches are classified as: M – measured
O – other.
Figure 2.1 Example of the development over time of a biodiversity index for a low (red) and high deposition scenarios, each ending in an Dose-Response(D-R) point (left) and a graphic representation of the normali-sed D-R points (right).
t 2100 I /Imax Ndeposition 1.0 Index reflecting no net loss of biodiversity 1880
Some soil processes influencing pH and C:N ratio can take centuries to achieve equilibrium, but processes related to nitrogen concentration in the soil solution act relatively quickly. The vegetation models which need pH and/or C:N ratio require the soil chemistry
at long-term equilibrium. Therefore, most countries ran their soil model until 2050 or even 2500.
France and the Czech Republic determined their biodiversity index on relevées, sampled in recent years at corresponding deposition levels. The
Table 2.1 Number of sites submitted by the countries for each EUNIS class Austria
Switzer-land RepublicCzech Germany France KingdomUnited Italy Nether-lands
AT CH CZ DE FR GB IT NL Total B1.3 1 1 D1 1 1 D1.1 2 2 D1.2 2 2 D2 1 1 D2.2 2 2 E1.2 2 2 E1.7 2 2 E2.2 2 2 E2.3 133 133 E3.5 2 2 F2.2 37 37 F4.1 2 2 F4.2 2 1 3 G1.5 1 1 G1.6 1 17 4 22 G1.7 1 5 2 8 G1.8 2 1 1 4 G3.1 3 2 1 1 7 G3.2 1 1 G3.F 1 1 G4.6 1 2 3 Total 6 189 8 5 3 18 4 6 239
Table 2.2 Methodology applied by the countries Country Year AT CH CZ DE FR GB IT NL 1750 O 1880 BKG 1995 – 2009 M M 2010 O 2050 BKG,GP,O 2100 O BKG,GP,O BKG,GP BKG 2500 O
corresponding soil chemistry was obtained by measurements and calibration. This method focuses on the fast nitrogen processes only.
Note from Table 2.2 that both Switzerland (CH) and Italy (IT) used a historical year to obtain an
additional (reference) D–R point. This point has a very low deposition. The United Kingdom (GB) made scenario runs with zero deposition.
2.4 Submitted D–R functions
The submitted D–R points for each site are linearly connected; thus forming a D–R function. NFCs submitted two or three D–R points for each site and therefore the D–R function consists of one or two segments. Figure 2.2 shows all D–R segments for
non-forest ecosystems; Switzerland (CH), the
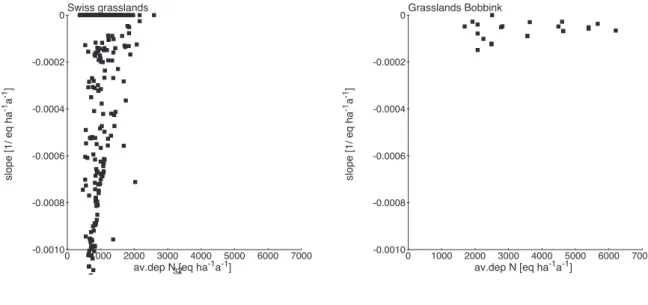
Netherlands (NL) and the United Kingdom (GB) submitted data for the EUNIS classes B (Coastal), D (Mire/Bog/Fen), E (Grass) and F (Heath/Scrubs). Nearly all segments have negative slopes; higher nitrogen deposition results in fewer (typical) species. Most countries focused on forests; five of the eight submissions contained only data for forest
ecosystems. Figure 2.3 shows the D–R segments for forests. Most of the slopes are negative, but for many sites the index rises with an increasing nitrogen deposition.
The Netherlands and Switzerland chose a very low nitrogen deposition as a reference state.
Figure 2.2 The submitted D-R-points (connected per site) for non-forest ecosystems in Switzerland (top left), United Kingdom (top right) and the Netherlands
0 400 800 1200 1600 2000 2400 2800 3200 0.2 0.4 0.6 0.8 1.0CH 0 400 800 1200 1600 2000 2400 2800 3200 0.2 0.4 0.6 0.8 1.0GB 0 400 800 1200 1600 2000 2400 2800 3200 0.2 0.4 0.6 0.8 1.0NL