HAL Id: hal-00304660
https://hal.archives-ouvertes.fr/hal-00304660
Submitted on 1 Jan 2002HAL is a multi-disciplinary open access archive for the deposit and dissemination of sci-entific research documents, whether they are pub-lished or not. The documents may come from teaching and research institutions in France or abroad, or from public or private research centers.
L’archive ouverte pluridisciplinaire HAL, est destinée au dépôt et à la diffusion de documents scientifiques de niveau recherche, publiés ou non, émanant des établissements d’enseignement et de recherche français ou étrangers, des laboratoires publics ou privés.
British Columbia, Canada
A. Loukas, L. Vasiliades, N.R. Dalezios
To cite this version:
A. Loukas, L. Vasiliades, N.R. Dalezios. Climatic impacts on the runoff generation processes in British Columbia, Canada. Hydrology and Earth System Sciences Discussions, European Geosciences Union, 2002, 6 (2), pp.211-228. �hal-00304660�
Climatic impacts on the runoff generation processes in British
Columbia, Canada
Athanasios Loukas
1, Lampros Vasiliades
2and Nicolas R. Dalezios
31Department of Civil Engineering, University of Thessaly, Pedion Areos, 383 34 Volos, Greece
2Department of Management of Environment and Natural Resources, University of Thessaly, Fitoko, 384 46 N.Ionia, Greece 3Department of Agriculture, University of Thessaly, Fitoko, 384 46 N. Ionia, Greece
Email for corresponding author: [email protected]
Abstract
The potential impact of future climate change on runoff generation processes in two southern British Columbia catchments was explored using the Canadian Centre for Climate Modelling Analysis General Circulation Model (CGCMa1) to estimate future changes in precipitation, temperature and cloud cover while the U.B.C. Watershed Model was used to simulate discharges and quantify the separate runoff components, i.e. rainfall, snowmelt, glacier melt and groundwater. Changes, not only in precipitation and temperature but also in the spatial distribution of precipitation with elevation, cloud cover, glacier extension, altitude distribution of vegetation, vegetation biomass production and plant physiology were considered. The future climate of the catchments would be wetter and warmer than the present. In the maritime rain-fed catchment of the Upper Campbell, runoff from rainfall is the most significant source of flow for present and future climatic conditions in the autumn and winter whereas runoff from groundwater generates the flow in spring and summer, especially for the future climate scenario. The total runoff, under the future climatic conditions, would increase in the autumn and winter and decrease in spring and summer. In contrast, in the interior snow-covered Illecillewaet catchment, groundwater is the most significant runoff generation mechanism in the autumn and winter although, at present, significant flow is generated from snowmelt in spring and from glacier runoff in summer. In the future scenario, the contribution to flow from snowmelt would increase in winter and diminish in spring while the runoff from the glacier would remain unchanged; groundwater would then become the most significant source of runoff, which would peak earlier in the season.
Keywords: climatic change, hydrological simulation, rainfall, snowmelt, runoff processes
Introduction
The global atmospheric concentration of carbon dioxide (CO2) has increased dramatically over the last century and, at the present rate of increase, will double by the end of the century. Global circulation models (GCMs) have been used to study the effects of the increasing concentration of carbon dioxide and the other greenhouse gases on the Earth’s climate (Wilson and Mitchell, 1987; Johns et al., 1997; Boer
et al., 2000). The second generation of GCMs (Manabe and
Stouffer, 1996; Johns et al., 1997; Boer et al., 2000; Hirst
et al., 2000) are transient models and simulate the Earth’s
atmospheric circulation; they predict the changes in temperature, in the amount and distribution of precipitation and other climatic variables on the assumption of a rate of increase in CO2 concentration of 1% per annum from 1990 to 2100. Such a change in climate will have important
implications on the hydrological balance and water resources.
The most realistic and widely used approach to simulate the effect of future changes in climate on hydrological processes is to combine the output of the GCMs with a deterministic or conceptual hydrological model that contains physically-based mathematical descriptions of hydrological phenomena (Kite, 1993; Gellens and Roulin, 1998; Leung and Wigmosta, 1999; Hamlet and Lettenmaier, 1999). This approach is realistic, although there are inherent uncertainties about the details of regional climate changes. The major problem with the current generation of global climate models is the limitation in their spatial resolution and the resolution of the output. Usually, the output of GCMs is given for a much larger scale than that of even a large catchment. Interpolation techniques (McCabe and Wolock,
1999), statistical downscaling (Brandsma and Buishand, 1997; Wilby et al., 1999) and downscaling through coupling of GCM output and regional meteorological models (Leung and Wigmosta, 1999; Miller et al., 1999) are all methods that have been used to overcome the limitation of the spatial resolution of the GCMs (IPCC, 1999).
However, other uncertainties in the results of such coupled simulations may be due to errors in the GCM simulation and/or the hydrological simulation. The main sources of GCM uncertainty (IPCC, 1999) are: (a) uncertainty in the future greenhouse gas concentration and aerosol emissions, (b) uncertainty in global climate sensitivity assessed by different GCMs because of the way the physical processes and feedback mechanisms are simulated within the various GCMs, and (c) uncertainty in regional climate changes due to differences in the results of different GCMs for the same mean global warming. The uncertainty of the hydrological simulations results from: (d) the representation of the physical processes (model or parameter error), and (e) the data used to drive the hydrological model (data error) (Kaleris et al., 2001). Since this study examines the relative sensitivity of the runoff processes to the possible future climate change, it is assumed that the output of the GCM is reliable and the above uncertainties are not tested. On the other hand, the overall validity of the hydrological simulations is tested against historical flow data.
In Canada, most studies of the effects of climate change on catchment hydrology have concentrated on those where snowmelt is the major proportion of the streamflow, mainly because climate has a strong influence on snowpack, its melting rate and melting period. However, it is also important to analyse and compare the effects of climate change on rain-fed and snowmelt catchments. A few studies (Kite, 1993; Loukas and Quick, 1996, 1999) have considered the effects of climate change on vegetation distribution and transpiration as well as on changes in temperature and precipitation. Most studies assume that the basin itself remains unchanged and ignore changes in vegetation pattern and physiology as well as changes in meteorological variables, other than precipitation and temperature, that may result from climate change. For example, climate change will affect not only the precipitation and temperature but also the distribution of glaciers; soil processes such as drainage capacity and soil quality; land surface processes such as erosion; characteristics, type and coverage of vegetation. Furthermore, some meteorological variables may be affected by feedback mechanisms. For example, climate change would change not only the relative proportion of rain and snow but also the spatial distribution of precipitation and cloud cover.
This study investigates the possible impacts of climate
change on the runoff processes of two mountainous catchments located in different climatic regions of British Columbia, Canada, by considering the meteorological and vegetative factors that are likely to be affected by the climate change scenario. The latest version of the U.B.C. Watershed Model (Version 4) (Quick, 1995), used here to estimate the runoff from the catchments, can account for changes in the vegetation cover and physiology, elevation, aspect, cloud cover and other meteorological factors. The objectives of this study are:
1. to incorporate the most important meteorological and geophysical variables that, under an altered climate scenario, are likely to change and influence the runoff (i.e. precipitation, temperature, spatial distribution of precipitation with elevation, cloud cover, glacier extension, altitude distribution of vegetation, vegetation biomass production and plant physiology);
2. to determine the runoff generation processes in two basins located in two climatically different areas of British Columbia under present and future climate conditions;
3. to evaluate and compare the importance of the runoff generation processes for present and future climatic conditions.
Study areas and data base
The U.B.C. Watershed Model has been applied to two contrasting catchments in British Columbia, the Upper Campbell and the Illecillewaet. The Upper Campbell, a rugged 1194 km2 basin to the east of the Vancouver Island
Mountains, peaks at 2200 m with a mean basin elevation of 950 m and drains to the north and east into the Strait of Georgia (Fig. 1). The lower elevations of the catchment are dammed by a reservoir, 50 km long and 5 km wide, which controls the Upper Campbell and Buttle Lakes.
The climate is maritime with mild wet winters and warm dry summers. Most precipitation is generated by cyclonic frontal systems that develop over the North Pacific Ocean and travel eastwards. The mean annual precipitation is about 2000 mm, of which about 60% is rain. The wettest period, receiving 75% of the total annual precipitation, is between November and March. Significant snowpacks accumulate, especially at upper elevations; some melt occurs even during the accumulation period from October to April and from May onwards until the disappearance of snow at the higher elevations, usually by mid-August, melt occurs rapidly.
Although measurements were made at two meteorological stations in the catchment at 370 m and 1470m, daily
precipitation readings from only the lower station were used because data from the upper station were unreliable during intense snowstorms mainly due to ice-capping of the gauge. Daily maximum and minimum temperatures from both meteorological stations were used. Streamflow was measured at the exit from the catchment. At three snowcourse sites, Lower Wolf Creek, Middle Wolf Creek, and Upper Wolf Creek at elevations of 640 m, 1070 m, and 1490 m, the snowpack accumulation observed was compared with that simulated. Figure 1 shows the locations of the streamflow gauge, the snow courses and the meteorological stations.
The second catchment is the Illecillewaet, 1150 km2 in
extent at altitudes from 1000 to 2250 m, located on the western slopes of the Selkirk Mountains in southeastern British Columbia. The Illecillewaet River is a tributary of the Columbia River and contributes to the Arrow Lakes reservoir (Fig. 1). The climate of the area is continental with cold winters and warm summers with frequent hot days. The basin is 500 km inland from the Coast Mountains and its climate is influenced primarily by the maritime Pacific Ocean air masses and by weather systems moving eastwards. The long-term average precipitation ranges from 950 mm at Revelstoke at 443 m, close to the mouth of the catchment, to 2160 mm at Glacier Mount Fidelity station at 1875 m.
The water equivalent of the average annual snowfall at these stations is 445 mm and 1518 mm, respectively. In winter, substantial snowpacks develop at all elevations in the basin. The snowpack in the valley bottom at Revelstoke is usually depleted by the end of April but permanent snowfields and a 76 km2 glacier exist at the highest elevations.
In this basin, daily precipitation and temperature measurements were available at meteorological stations at Revelstoke (443 m), Glacier Rogers Pass (1323 m) and Glacier Mount Fidelity (1875 m). Snowcourse observations at Glacier (1250 m), Glacier Mount Fidelity (1875 m) and Mount Abbott (1980 m) were compared with the simulated snowpack. Streamflow observations at the mouth of the catchment are compared to the simulated runoff from the catchment. Figure 1 shows the location of these stations.
Climate inputs
Simulated climatic data for present and future scenarios were obtained from the second-generation Canadian Centre for Climate Modeling and Analysis GCM (CGCMa1) (Boer et
al., 2000). The CGCMa1 is a spectral model with ten
atmospheric levels and a resolution equivalent to 3.75o of
latitude by 3.75o of longitude. The ocean component is based
on the Geophysical Fluid Dynamics Laboratory MOM1.1 Vancouver Alberta U.S.A. Alaska Yukon Upper Campbell Illecillewaet 0 10 20 km
UPPER CAMPBELL WATERSHED
ILLECILLEWAET WATERSHED C olumbia R iver Revelstoke Upper A rro w L ake Campbell River Strait of Georgia Upper Campbell Lake Buttle Lake Meteorological Station Snowcourse Streamflow Station City
N
model with a resolution of roughly 1.8o of latitude by 1.8o
of longitude and 29 vertical levels.
The CGCMa1 simulations used in this study are transient. Each simulation includes observed increases in atmospheric concentration of CO2 from 1900 to 1989 and subsequent increases in atmospheric concentration of CO2 of 1% per year to the end of this century. Compared to the decade of the 1980s, this implies a doubling of CO2 near the year 2050 and a tripling of CO2 near the year 2100. The CGCMa1 simulations also include the direct effects of sulphate aerosols.
For the year 2100, the output from this model shows a globally averaged surface temperature increase of 2.7oC and
a 4% increase in precipitation. These values are consistent with the predictions of other second generation transient GCMs (IPCC, 1999).
Using the model, monthly values of climatological variables such as precipitation, minimum and maximum temperature and cloud cover were estimated for the period 1970 to 1990 (present climate) and for 2080–2100 (future climate) at a number of grid points near the study basins. Although the output of GCMs is considered to be a realistic representation of the response of the atmosphere to the increase in concentration of greenhouse gases, there are still many uncertainties in climatic simulations from GCMs. This is particularly true for mountainous regions such as British Columbia where the GCM uses an over-smoothed terrain rather than detailed topographical features. Hence, to develop regional GCM-based scenarios at the sub-grid scale, a procedure known as “downscaling” has been adopted (IPCC, 1999); it includes interpolation techniques (McCabe and Wolock, 1999), statistical downscaling (Brandsma and Buishand, 1997; Wilby et al., 1999), spatial disaggregation (Mehrotra and Singh, 1998) and downscaling through coupling of GCM output and regional meteorological models (Leung and Wigmosta, 1999; Miller et al., 1999).
However, statistical downscaling of GCM predictions and downscaling of GCM simulations through regional meteorological modelling driven by the GCM boundary conditions in the Pacific Northwest (Hamlet and Lettenmaier, 1999) showed that these methods cannot reproduce the decadal and interannual climatic variability and, consequently, the observed streamflow. Also, the GCM simulations are not, in general, synchronised with observed historic events. Hence, in the present study, only the spatially averaged changes of the CGCMa1-estimated monthly values of precipitation, minimum and maximum temperature for the present climate (1970–1990) and the predicted future climate (2080–2100) were used in the comparison. Then, the historically recorded daily station measurements for the period 1970–1990 were adjusted by these monthly changes to produce climatic estimates for the period 2080–2100. This procedure is often called the “delta” method of downscaling of GCM simulations, because it superimposes the predicted changes on the historical records. This relatively simple downscaling approach alters the long-term mean of the climatic data for each month, while preserving most aspects of the observed variability (Hamlet and Lettenmaier, 1999). Hay et al., 2000 compared downscaled GCM output using the “delta” method with a statistical downscaling technique in three mountainous catchments in the USA and showed that the simple “delta” method gives reasonable results.
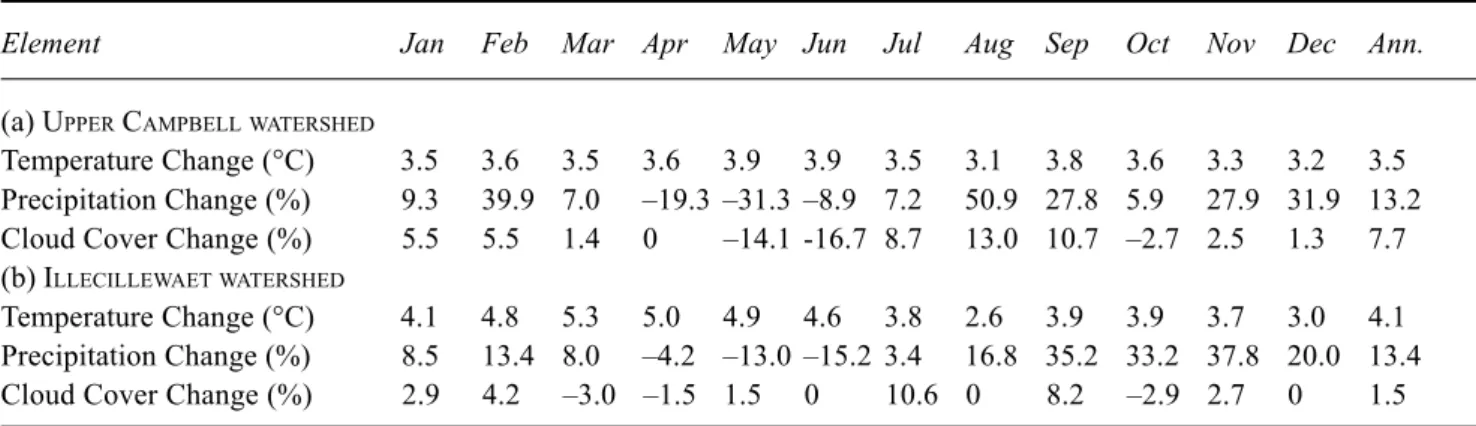
Table 1 summarises the average monthly change in mean temperature, precipitation and cloud cover for the two basins studied. For Upper Campbell, the GCM predicts a temperature increase for every month, which varies little from month to month, and averages 3.5oC over the year.
The mean annual precipitation increases by about 13.2%; the largest increase is in August (50.9%) and the largest decrease in May (–31.3%). The mean annual cloud cover increases by 7.7%, with the largest increase in August (13%) and the largest decrease in June (–16.7%).
Table 1. The effect of climate change on mean temperature, precipitation and cloud cover from the output of CGCMa1 for
the two study catchments (present climate 1970-1990, future climate 2080-2100)
Element Jan Feb Mar Apr May Jun Jul Aug Sep Oct Nov Dec Ann.
(a) UPPER CAMPBELLWATERSHED
Temperature Change (°C) 3.5 3.6 3.5 3.6 3.9 3.9 3.5 3.1 3.8 3.6 3.3 3.2 3.5
Precipitation Change (%) 9.3 39.9 7.0 –19.3 –31.3 –8.9 7.2 50.9 27.8 5.9 27.9 31.9 13.2
Cloud Cover Change (%) 5.5 5.5 1.4 0 –14.1 -16.7 8.7 13.0 10.7 –2.7 2.5 1.3 7.7
(b) ILLECILLEWAETWATERSHED
Temperature Change (°C) 4.1 4.8 5.3 5.0 4.9 4.6 3.8 2.6 3.9 3.9 3.7 3.0 4.1
Precipitation Change (%) 8.5 13.4 8.0 –4.2 –13.0 –15.2 3.4 16.8 35.2 33.2 37.8 20.0 13.4
The results for the Illecillewaet show similar changes (Table 1). The annual average temperature increases by 4.1oC with larger increases during the winter and spring
months. The average annual precipitation increases by 13.4% with November exhibiting the largest increase (37.8%) and June the largest decrease (–15.2%). The mean annual increase in cloud cover is small (1.5%) but it varies monthly from 10.6% in July to –3% in March.
Hydrological model — modelling
approach
The U.B.C. Watershed Model (Quick and Pipes, 1976) with subsequent updates has been used to simulate the effect of climate change on the runoff of the two catchments. This model has been shown to be applicable to diverse climatic regions, ranging from coastal to inland mountain regions of British Columbia including the Rocky Mountains and the subarctic region of Canada (Assaf and Quick, 1991a; Hudson and Quick, 1997; Micovic and Quick, 1999; Druce, 2001). The model has also been successful in the Himalayas and Karakoram ranges in India and Pakistan, the Southern Alps in New Zealand and the Snowy Mountains in Australia (Khan, 1995; Singh and Kumar, 1997).
From input data of precipitation and maximum and minimum air temperatures, the U.B.C. calculates daily or hourly streamflow. Originally designed to simulate streamflow from mountainous catchments, where runoff from snowpack and glacier melt may be important, the model conceptualises the catchments as a number of altitude bands, since meteorological and hydrological processes are functions of elevation in upland catchments; indeed, orographic gradients of precipitation and temperature are major determinants of hydrological behaviour in mountainous catchments. These gradients are assumed to behave similarly for each storm event so that, based on temperature, the model estimates whether precipitation falls as rain or snow and estimates snowpack accumulation as a function of elevation. A simplified energy budget approach, based only on data of maximum and minimum temperature is used to estimate snowmelt (Quick, 1995). Furthermore, the geophysical characteristics of each elevation band in a catchment, such as impermeable area, forested areas, vegetation density, open areas, aspect and glaciated areas can be estimated from maps or remotely sensed data, on the assumption of homogeneity of the characteristics within each elevation band.
For each band, the runoff from rainfall, snowmelt and glacier melt is distributed into four runoff components by a soil moisture control mechanism which represents the non-linear behaviour of the catchment. This mechanism
apportions the water from rainfall, snowmelt and glacier melt into fast or surface runoff, medium or interflow runoff, slow or upper zone groundwater runoff and the very slow or deep zone groundwater runoff. For each elevation band, the water that reaches the soil surface, after interception and sublimation, is divided into fast surface runoff and infiltrated water. The water infiltrated satisfies the soil moisture deficit and the evapotranspiration and then passes to groundwater or runs off as interflow. The groundwater is further divided into upper and lower groundwater zones. When the soil moisture accounting sub-routine has been applied to all the elevation bands, each runoff component is routed to the catchment outlet by the flow routing sub-routine.
The flow routing uses the linear reservoir cascade technique, which simplifies, significantly, the model structure, conserves the water mass, and provides a simple and accurate water budget balance. The flow routing variables are: the snowmelt and rainfall fast runoff time constants, the snowmelt and rainfall interflow time constants, the glacier time constant, the upper groundwater time constant and the deep zone groundwater time constant. The summation of the runoff from all bands and for all runoff components gives the catchment runoff for the time step. Apart from the total runoff, the U.B.C. model provides information on snow-covered area, snowpack water equivalent, potential and actual evapotranspiration, soil moisture, interception losses, groundwater storage, surface and subsurface runoff for each elevation band separately and for the whole catchment.
In the present study, the Canadian Centre for Climate Modeling Analysis GCM (CGCMa1) has estimated the changes in precipitation, temperature, and cloud cover. The changes in tree cover, density and physiology as well as the changes in the areal extension of glacierised areas have been estimated using contemporary methods. The key features of the model are its capability to incorporate changes in tree cover and density and cloud cover in calculating the resulting change in radiation energy exchange. The following can be computed:
1. Changes in the form of precipitation from snow to rain and the corresponding changes in precipitation gradients with altitude in the catchments;
2. Changes in snowmelt between forested and open areas, including the effects of north and south aspect, calculation of modifications in albedo and cloud cover and the consequent short-wave energy changes. The energy budget routine is especially important for this type of study and has been well proven in other studies (Assaf et al., 1995; Micovic and Quick, 1999);
3. Changes in glacial melt, which depend on the energy budget and are particularly sensitive to early melting of the seasonal snowcover on the glacier;
4. Changes in evapotranspiration estimated according to vegetation and temperature, but modified by the enhanced CO2 effect on stomata.
TEMPERATURE
In the U.B.C. model, the temperature data are distributed over the elevation range of the catchment according to two temperature lapse rates, one for the maximum temperature and one for the minimum temperature. Furthermore, the model distinguishes rainy conditions from clear sky and dry weather conditions. In rainy conditions, the lapse rate is the saturated adiabatic rate, while in dry weather the lapse rate is the dry adiabatic rate during the warm part of the day but at night, it is low and occasionally zero. The lapse rate is calculated for each day using the diurnal temperature range as an index (Quick, 1995). The historical temperature data are adjusted by the mean monthly temperature changes predicted by the GCM (Table 1) to produce the future climate temperature estimates.
PRECIPITATION AND ITS SPATIAL DISTRIBUTION The average monthly changes of precipitation (Table 1) were applied to the daily meteorological measurements used in this study to estimate precipitation under the altered climatic conditions. However, in addition to the changes in precipitation amount, global warming would increase the rainfall and reduce the snowfall so that the spatial distribution of precipitation and the runoff response will be affected. Storr and Ferguson (1972) studied three Alberta catchments and concluded that the altitudinal gradient of snowfall was ten times that of rainfall. Similar conclusions have been reached in another study in coastal British Columbia (Schaefer and Nikleva, 1973). The U.B.C. model calculates the precipitation in any elevation band using the equation, 100 , , 1 , , (1 ) elev l j i l j i PR GRADRP PR ∆ + = ⋅ + (1)
where PRi,j,l is the precipitation from meteorological station
i for day j and elevation band l, GRADRP is the percentage
precipitation gradient, and ∆elev is the elevation difference between the meteorological station and the elevation band. The U.B.C. model, then, adjusts the precipitation gradient according to the temperature,
) (
' GRADRP ST T
GRADRP= − (2)
where ST(T) is affected by the stability of the air mass. The
ST(T) parameter is related (Quick, 1995) to the square of
the ratio of the saturated, LS, and dry, LD, adiabatic lapse rates: i.e. L L S D 2 . A plot of L L S D 2 versus temperature reveals an almost linear variation between -30oC and +20oC
with a gradient of 0.01. Hence, ST(T) can be estimated as,
mean T T
ST( )= 010. ⋅ (3)
where Tmean is the mean daily temperature.
Due to the change in the form of precipitation from snow to rain under the future climate and the different gradients used for the distribution of rainfall and snowfall over the elevation range of the catchment, the average basin values of total precipitation produced by the hydrological simulations, differ from those based on the station data. Thus, the average future precipitation change may not agree with the estimates obtained by imposing the CGCMa1 output on the historic station data.
CLOUD COVER
Another meteorological variable that changes under the climate change scenario is cloud cover, which controls the incoming solar radiation and long wave radiation from the clouds. Changes in these variables affect the energy balance on the Earth’s surface, which influences the temperature, evapotranspiration and snowmelt rates. In British Columbia an increase of 25% in cloud cover caused the snowpack to melt about 15 to 20 days early (Assaf and Quick, 1991b). Although cloud cover is an output parameter of the GCM, in the U.B.C. model the cloud cover is calculated using air temperature data.
The U.B.C. model calculates the cloud cover, CLL, as a function of the daily maximum and minimum temperature,
Tmax and Tmin as:
R L DT T T CL =1− max− min (4)
where DTR is the diurnal temperature range for open sky conditions. This daily cloud cover, calculated for present climatic conditions is, then, modified by the monthly changes of cloud cover estimated by the CGCMa1 output for present (1970–1990) and future (2080–2100) climates (Table 1), to produce the cloud cover for the future climatic scenario.
VEGETATION
Vegetation exerts a major influence on the microclimate of a particular site, regulating the temperature, moisture and wind regime; this, in turn, influences the quantity and quality of runoff. Changes in vegetation can decrease evapotranspiration, increase erosion and degrade water quality. These changes in evapotranspiration can then increase the availability of water and hence the runoff from a particular site. Also, the vegetation coverage affects the interception losses and the antecedent soil moisture conditions.
Recent studies have dealt with the effects of climate change on vegetation. Those identified so far are a decrease in transpiration due to stomatal closure (Cure and Acock, 1986; Parry, 1992), an increase in the production of biomass (Post et al., 1992) which may offset the decrease of transpiration due to stomatal closure and areal and altitudinal redistribution of vegetation. Zoltai (1988) estimated that there would be only a small areal change in the Pacific Cordilleran ecoclimatic region, which covers western British Columbia, and in the Cordilleran ecoclimatic province, which covers the Rocky Mountains and the northern interior of British Columbia; hence, any change in these two regions should be restricted to altitudinal shift in the vegetation. Recent studies (Ozenda and Borel, 1990; Fanta, 1992) indicated that a 1oC rise in temperature would raise the
altitudinal boundaries of the tree line by 100–180 m in the European Alps and the Central European Mountains so that trees would occupy most of the present alpine zone (Korner, 1992).
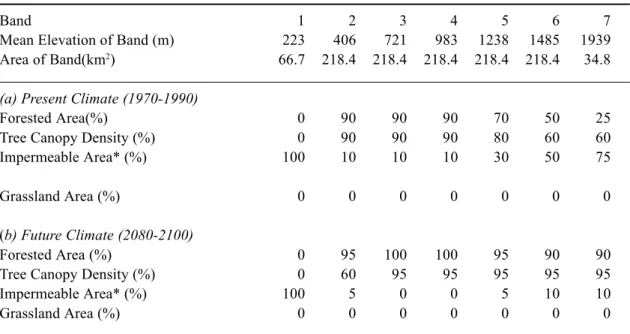
In the present study, the mean annual change in temperature for the future climate scenario was used to calculate the upward shift of vegetation. Tables 2 and 3 list the percentages of land use in each elevation band for each climate scenario in each catchment. In the Upper Campbell, the first elevation band is occupied by the Upper Campbell and Buttle lakes, which are classed with rock outcrops in the UBC model as impermeable areas. Under the future climate scenario, the second elevation band will be occupied by deciduous trees like arbutus and garry oak which now occupy the coastal fringe of the southeast Vancouver Island; also, a reduction of the impermeable area is expected because of the increase in the vegetation coverage (Table 2).
In the Illecillewaet, at the two lowest elevation bands, the grass area expands at the expense of the forest and the impermeable area (Table 3). These changes in land use are consistent with the results of previous studies (Smith et al., 1992; Kite, 1993; Loukas and Quick, 1999).
In agreement with previous plant physiological (Cure and Acock, 1986; Parry, 1992) and hydrological studies (Wigley and Jones, 1985; Kite, 1993), an increase of 30% in CO2 concentration will reduce transpiration from the vegetation due to the closure of stomata. Also, increased net ecosystem production results from the increase in the forested area and the tree canopy density (Tables 2 and 3). However, these changes are highly qualitative since there is no way of expressing more quantitatively the effect of climate change on biomass production.
Table 2. Description of land uses by elevation band of Upper Campbell catchment
Band 1 2 3 4 5 6 7
Mean Elevation of Band (m) 223 406 721 983 1238 1485 1939
Area of Band(km2) 66.7 218.4 218.4 218.4 218.4 218.4 34.8
(a) Present Climate (1970-1990)
Forested Area(%) 0 90 90 90 70 50 25
Tree Canopy Density (%) 0 90 90 90 80 60 60
Impermeable Area* (%) 100 10 10 10 30 50 75
Grassland Area (%) 0 0 0 0 0 0 0
(b) Future Climate (2080-2100)
Forested Area (%) 0 95 100 100 95 90 90
Tree Canopy Density (%) 0 60 95 95 95 95 95
Impermeable Area* (%) 100 5 0 0 5 10 10
Grassland Area (%) 0 0 0 0 0 0 0
GLACIERS
Glaciers will be strongly affected by changes in precipitation, temperature and energy balance. Lauman and Reeh (1993) studied the sensitivity to climate change of three glaciers in southern Norway; they concluded that the glacier at lowest elevation would eventually disappear while the others would lose significant mass. In Greenland, Braithwaite and Olesen (1989) reported that 3oC and 5oC
increases in mean annual temperature would increase glacier ablation by 150–170% and 200–240% respectively. The specific values of glacier ablation depend on the geographical area. In two studies near the two catchments in the present study, Pelto (1989) and Moore (1992) reported a decrease in size of the glaciers since the middle of the 20th
century.
The 76 km2 glacier in the higher elevation band of the
Illecillewaet River catchment was estimated to shrink by 33%, to 51 km2 (Table 3), as a result of a mean annual
temperature change of 4.1oC (Oerlemans and Wegener
1989).
Application — method of analysis
To be useful in climate change studies, a catchment model should be able to reproduce reasonably well the historical streamflow record as well as to simulate the runoff in
different climatic regions. In this study, the U.B.C. model was calibrated using historical daily streamflow measurements for the Upper Campbell basin for the years 1983 – 1990, and for the Illecillewaet for the years 1970 – 1990, respectively. These databases include dry and wet years.
The statistics used to validate the performance of the model are: the mean observed and the mean simulated flow, the runoff volume difference, the coefficient of determination (r2), and the Nash-Sutcliffe efficiency (Eff) (Nash and
Sutcliffe, 1970) defined as:
(
)
(
)
∑
∑
= = − − − = n 1 i 2 i n 1 i 2 i i Qobs Qobs Qsim Qobs 1 Eff (5)where, Qobsiis the observed flow on day i, Qsimiis the
simulated flow on day i and Qobs is the average observed
flow for the simulation period.
For the Upper Campbell, the Nash-Sutcliffe efficiency for the calibration period is 0.73, the coefficient of determination is 0.73, the mean absolute percentage error is 20% and the runoff volume difference is 0.90%. For the Illecillewaet, the Nash-Sutcliffe efficiency is 0.93, the coefficient of determination is 0.93, the mean absolute
Table 3. Description of land uses by elevation band of Illecillewaet catchment
Band 1 2 3 4 5 6 7 8
Mean Elevation of Band (m) 1000 1360 1540 1650 1790 1915 2085 `2250
Area of Band (km2) 230 115 115 115 115 115 115 230
(a) Present Climate (1970-1990)
Forested Area(%) 90 90 90 90 90 50 50 17
Tree Canopy Density (%) 99 99 99 99 99 99 99 60
Impermeable Area* (%) 10 10 10 10 10 40 45 50
Glacial Area (%) 0 0 0 0 0 0 0 33
Grassland Area(%) 0 0 0 0 0 10 5 0
(b) Future Climate (2080-2100)
Forested Area (%) 0 0 95 95 95 95 95 70
Tree Canopy Density (%) 0 0 99 99 99 99 99 70
Impermeable Area* (%) 10 10 5 5 5 5 5 8
Glacial Area (%) 0 0 0 0 0 0 0 22
Grassland Area(%) 90 90 0 0 0 0 0 0
percentage error is 21% and the runoff volume difference is –0.73 %. These runoff statistics and the comparison of simulated and observed hydrographs for wet and dry years indicate that the model simulates the recorded streamflow well.
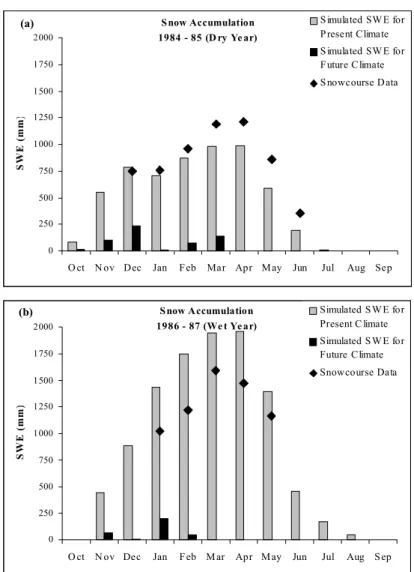
To test the model’s ability to simulate snow accumulation, the simulated snow accumulation was compared with observations from snowcourses. Of course, the simulated values are averaged over the area of the elevation band or bands, whereas the observations represent the accumulation at the location of the snowcourse. Only the comparisons with the snowcourses at the higher elevations where deep snowpacks are observed and their melting affects the runoff volume and its distribution in the two catchments are presented here.
For the Upper Campbell, the simulated snow accumulation in elevation band 6 (mean elevation 1485 m) was compared with measurements at the Upper Wolf Creek snowcourse
Snow Accumulation 1984 - 85 (D ry Ye ar) 0 250 500 750 1000 1250 1500 1750 2000
O ct N ov Dec Jan Feb Mar Apr M ay Jun Jul Aug Sep
S
W
E
(mm
)
Simulated SWE for Present Climate Simulated SWE for Future Climate Snowcourse Data Snow Accumulation 1986 - 87 (We t Ye ar) 0 250 500 750 1000 1250 1500 1750 2000
O ct N ov Dec Jan Feb M ar Apr M ay Jun Jul Aug Sep
S
W
E
(mm
)
Simulated SWE for Present C limate Simulated SWE for Future Climate Snowcourse Data
(a)
(b)
Fig. 2. Comparison between the simulated snow accumulation for present and future climate and
the observed data from Upper Wolf Creek snowcourse – Upper Campbell catchment.
(1490 m) in the driest recorded year 1984–85 (Fig.2a) and the wettest year 1986–87 (Fig. 2b). The U.B.C. model simulates the snowpack accumulation and its subsequent melting reasonably well.
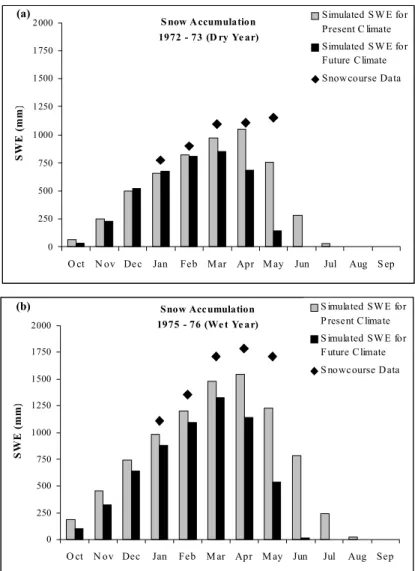
For the Illecillewaet, the simulated snow accumulation in elevation bands 6 (1915 m) and 7 (2085 m) was compared with snow data from the snowcourse at Mount Abbot, (1980 m) for the driest (1972–73) and wettest years (1975– 76) of the 20 year record. (Fig. 3a and b) Again, the U.B.C. model estimates the snow accumulation reasonably well. In the absence of data for the melting period, no comparison between simulation and observation of the snow-water-equivalent of the snowpack is possible. However, the comparison of the simulated and observed snowpacks, together with the results of the flow calibration, indicate that the U.B.C. model is successful in simulating the runoff from both catchments using historical data for present climatic conditions.
The calibration results for the two catchments were used as the base simulation results for the present climate. With the meteorological and other parameters adjusted, the U.B.C. model was run in daily time steps to simulate the flow under the altered climate change scenario. The simulation results were averaged in monthly values for comparison and discussion.
Results
EFFECTS OF CLIMATE CHANGE ON THE
HYDROLOGY OF THE TWO STUDY CATCHMENTS The hydrological simulations for present and future climate conditions indicate similarities and differences in the overall responses of the two catchments. The GCM results showed that, in the Upper Campbell, the mean annual temperature for the future climate would increase by about 3.5oC,
whereas in the Illecillewaet, the mean annual temperature would increase by about 4.1oC (Table 1). The higher
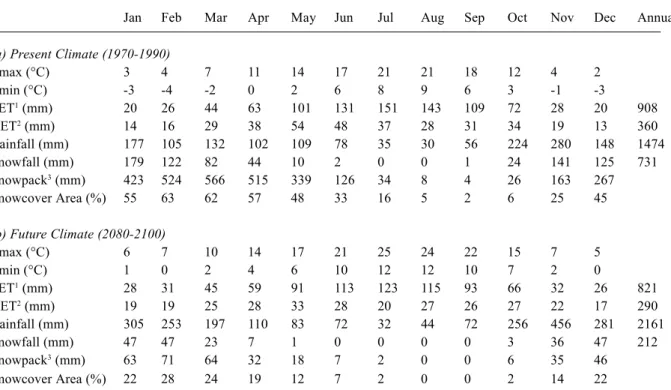
temperatures due to climate warming would affect the hydrological and meteorological variables directly. In the Upper Campbell, potential evapotranspiration (PET) would decrease by about 10% on an annual basis, whereas the average annual actual evapotranspiration (AET) would decrease by 19% (Table 4). In the Illecillewaet, the annual PET would decrease by 1% , from 578 mm to 571 mm but the annual AET would decrease by about 22%, from 381 mm to 296 mm (Table 5). Hence, the increased biomass of the vegetation due to climate change would compensate only partly for the decrease in evapotranspiration of 30% due to changes in the physiology of the vegetation (stomatal closure).
In the Upper Campbell, on the Pacific coast of British Columbia, the change in the global climate would result in
S now Accumulation 1972 - 73 (D ry Ye ar) 0 250 500 750 1000 1250 1500 1750 2000
O ct N ov Dec Jan Feb M ar Apr M ay Jun Jul Aug S ep
S W E (mm ) Simulated SW E for Present C limate Simulated SW E for Future Climate Snowcourse Data Snow Accumulation 1975 - 76 (We t Ye ar) 0 250 500 750 1000 1250 1500 1750 2000
O ct N ov Dec Jan Feb M ar Apr M ay Jun Jul Aug Sep
S
W
E
(mm
)
S imulated SWE for P resent Climate S imulated SWE for F uture Climate S nowcourse Data
(a)
(b)
Fig. 3. Comparison between the simulated snow accumulation for present and future climate
Table 4. Average model results for present and future climate scenarios for the Upper Campbell catchment
Jan Feb Mar Apr May Jun Jul Aug Sep Oct Nov Dec Annual
(a) Present Climate (1970-1990)
Tmax (°C) 3 4 7 11 14 17 21 21 18 12 4 2 Tmin (°C) -3 -4 -2 0 2 6 8 9 6 3 -1 -3 PET1 (mm) 20 26 44 63 101 131 151 143 109 72 28 20 908 AET2 (mm) 14 16 29 38 54 48 37 28 31 34 19 13 360 Rainfall (mm) 177 105 132 102 109 78 35 30 56 224 280 148 1474 Snowfall (mm) 179 122 82 44 10 2 0 0 1 24 141 125 731 Snowpack3 (mm) 423 524 566 515 339 126 34 8 4 26 163 267 Snowcover Area (%) 55 63 62 57 48 33 16 5 2 6 25 45 (b) Future Climate (2080-2100) Tmax (°C) 6 7 10 14 17 21 25 24 22 15 7 5 Tmin (°C) 1 0 2 4 6 10 12 12 10 7 2 0 PET1 (mm) 28 31 45 59 91 113 123 115 93 66 32 26 821 AET2 (mm) 19 19 25 28 33 28 20 27 26 27 22 17 290 Rainfall (mm) 305 253 197 110 83 72 32 44 72 256 456 281 2161 Snowfall (mm) 47 47 23 7 1 0 0 0 0 3 36 47 212 Snowpack3 (mm) 63 71 64 32 18 7 2 0 0 6 35 46 Snowcover Area (%) 22 28 24 19 12 7 2 0 0 2 14 22
1PET is the potential evapotranspiration; 2AET is the actual evapotranspiration; 3Snowpack is the snow water
equivalent of the snowpack at the end of each month.
Table 5. Average model results for present and future climate scenarios for the Illecillewaet catchment
Jan Feb Mar Apr May Jun Jul Aug Sep Oct Nov Dec Annual
(a) Present Climate (1970-1990)
Tmax (°C) -7 -5 -1 4 8 13 17 17 11 4 -4 -7 Tmin (°C) -12 -10 -7 -4 0 3 6 6 2 -2 -8 -12 PET1 (mm) 1 2 9 34 78 109 127 117 67 30 4 0 578 AET2 (mm) 0 1 5 29 64 83 77 57 33 27 4 0 381 Rainfall (mm) 0 0 4 22 52 95 89 92 75 46 10 1 487 Snowfall (mm) 210 170 128 68 27 15 3 3 15 80 180 224 1124 Snowpack3 (mm) 690 862 986 971 680 264 41 2 9 76 255 480 Snowcover Area (%) 98 100 100 100 96 75 31 4 1 8 42 82 (b) Future Climate (2080-2100) Tmax (°C) -3 0 5 9 13 17 20 19 15 8 0 -4 Tmin (°C) -8 -5 -2 1 5 8 10 9 6 2 -4 -9 PET1 (mm) 4 8 23 42 81 101 108 94 63 36 9 2 571 AET2 (mm) 2 5 15 30 48 52 41 46 29 21 6 1 296 Rainfall (mm) 25 45 70 63 66 92 94 112 119 128 78 18 910 Snowfall (mm) 200 145 74 27 4 1 0 0 3 43 186 253 936 Snowpack3 (mm) 698 777 694 455 112 2 0 2 14 154 464 600 Snowcover Area (%) 96 96 88 74 38 6 0 0 1 11 60 91
1PET is the potential evapotranspiration; 2AET is the actual evapotranspiration; 3Snowpack is the
an increase of mean annual precipitation of 7.6% with a marked change in the partition of precipitation between rain and snowfall. The annual rainfall would increase by about 47%, increasing in the autumn, winter and spring and decreasing in the summer (Table 4), while the annual snowfall would decrease dramatically by 71%. The change in the form of precipitation in winter would result from the higher winter temperatures (Table 4). In the Illecillewaet, mean annual precipitation would increase by 14.6%, with rainfall increasing by about 87% while snowfall decreased by 17%. Under the climate change scenario, rainfall would increase for all months except for June (Table 5).
The warmer future climate and the large decrease in the annual snowfall would result in a dramatic decrease of the snowpack (Figs. 2 and 3) and the snow-covered area (Tables 4 and 5). In the Upper Campbell basin the average maximum basin winter snowpack would decrease by more than 87% while the maximum snow-covered area of the basin decreases by 35%. In the Illecillewaet catchment, the climate change affects the average winter snowpack, which would decrease by 21%.
The accumulation and depletion periods of the accumulated snowpack would also alter. In the Upper Campbell, the snowpack under the future climate scenario would start accumulating in November rather than in October. The peak accumulation period would shift from March to February. However, these changes are overshadowed by a significant decrease in the snowpack (Fig. 2 and Table 4). The effects in the Illecillewaet would be smaller; although the peak accumulation period would shift from March to February, the snowpack would not decrease so dramatically as in the Upper Campbell. (Fig. 3; Table 5).
The large increase in rainfall and the dramatic decrease of the snowfall and snowpack accumulation in the Upper Campbell under future climatic conditions, affect the mean annual surface and interflow rainfall runoff directly which would increase by 30% and the mean annual surface and interflow snowmelt runoff would decrease by 83%, respectively (Fig. 4). Under the climate change scenario, the rainfall runoff would increase in winter and the late autumn and would decrease in spring and summer mainly because the precipitation in spring and summer would be less. Furthermore, the basin would become more permeable as the vegetation advanced to higher elevations and the surface runoff would decrease; interception by the vegetation would enhance the catch of rain and snow. This intercepted water is either evaporated or soaks into the soil and thus increases the soil moisture storage. Hence, runoff from groundwater would increase in the late autumn and winter months (Fig. 4). The overall effect of the above
changes would increase the total runoff of the Upper Campbell by 13%, mostly in the late autumn and winter months although runoff would be less in summer. (Fig. 6a). In the Illecillewaet basin, the mean annual runoff from the surface and interflow would decrease by about 21%, despite the 87% increase of rainfall. This can be attributed to the expansion of the vegetation in the alpine and sub-alpine zone and the reduction of the impermeable area under the future climatic conditions (Table 3). In consequence, a larger amount of rainwater would infiltrate the soil and contribute to the groundwater and less rain would flow over the soil surface and through the top soil layers. The rainfall runoff would increase slightly during the winter and spring months and decrease considerably during the summer and autumn months (Fig. 5) mainly because of the increase in rainfall during these months (Table 5).
The mean annual surface and interflow snowmelt runoff,
a) R ainfall R unoff 0 50 100 150 200 250 Ja n Feb M a r A pr M a y Jun Ju l A ug S ep Oc t No v D ec R u n o ff (m m ) Present C limate Future C limate b) Snowme lt R unoff 0 50 100 150 200 250 Ja n Feb M a r A pr M a y Jun Ju l A ug S ep Oc t No v D ec R u n o ff (m m ) Present Climate Future Climate c) Groundwate r Runoff 0 50 100 150 200 250 Ja n Feb M a r A pr M a y Jun Ju l A ug S ep Oc t No v D ec R u n o ff (m m ) Present Climate Future Climate
Fig. 4. Average model results for runoff generating processes for
a) R ainfall R unoff 0 50 100 150 200 250 300
Jan Feb M ar A p r M ay Ju n Ju l A u g Sep Oct N o v Dec
R u n off (m m ) Present Climate Future Climate b) Snowmelt R unoff 0 50 100 150 200 250 300
Jan Feb M ar A p r M ay Ju n Ju l A u g Sep Oct N o v Dec
R u n off (m m ) Present C limate Future C limate c) Glacie r R unoff 0 50 100 150 200 250 300
Jan Feb M ar A p r M ay Ju n Jul A ug Sep Oct No v D ec
R uno ff ( m m ) Present Climate Future Climate d) Groundwate r Runoff 0 50 100 150 200 250 300
Jan Feb M ar A p r M ay Jun Jul A ug Sep Oct N ov Dec
R u n o ff (m m
) Present ClimateFuture Climate
Fig. 5. Average model results for runoff generating processes for present and future climate scenarios – Illecillewaet catchment
a) Total R unoff - Uppe r Campbe ll wate rshe d
0 50 100 150 200 250 300 350 400
J an F eb M ar A pr M ay Jun J ul A ug Sep O ct Nov D ec
Ru n of f ( m m ) Present Climate Future Climate
b) Total R unoff - Ille cille wae t wate rs hed
0 50 100 150 200 250 300 350 400
Jan F eb M ar A p r M ay Ju n Ju l A u g Sep Oct No v Dec
R u n off (m m ) Present Climate Future Climate
Fig. 6. Average model results for total runoff for present and future
climate scenarios for the two study catchments
in the Illecillewaet basin, would decrease by 62% mainly because of the reduced snowfall and the increased permeability of the catchment. The snowmelt would increase slightly in the late fall, winter and spring because of the higher melt rates and would decrease in summer as the snowpack depleted earlier in the season (Fig. 5). The mean annual glacier runoff would decrease by about 26% and the area of the glacier would shrink by 33%. The higher melting rates of the glacier reflecting the higher summer temperatures would tend to offset the reduction in the glacier area (Fig. 5). Furthermore, the increased permeability of the Illecillewaet catchment would result in higher soil infiltration rates; higher contributions of rainfall and snowmelt to groundwater would double the mean annual runoff from groundwater. However, this increase is not evenly distributed throughout the year and the groundwater runoff would decrease during July and August (Fig. 5).
The above changes in the runoff generation processes affect the total runoff, which, under the altered climatic scenario, would increase, on an annual basis, by about 37%. Nevertheless, the most significant effect would be the change in the time distribution of the total runoff; the peak runoff would occur one month earlier, in May (Fig. 6b).
CONTRIBUTIONS OF THE RUNOFF GENERATION PROCESSES TO TOTAL RUNOFF
The above results show the changes in the amount and time distribution of the runoff generation for the present climatic conditions and for the altered future climatic conditions. This analysis does not show the significance of the individual contributions of the various runoff generation mechanisms to the total runoff, so the average monthly contribution of each runoff mechanism has been plotted as the percentage of the total (Figs. 7 and 8). Runoff in the Upper Campbell under present climatic conditions is generated mainly by surface and interflow rainfall runoff during the autumn and winter and by the surface and interflow snowmelt runoff during the spring and summer months (Figs. 7a and b). Furthermore, groundwater contributes more than 50% of the monthly total runoff except in the autumn when its contribution decreases to 25% (Fig. 7c).
Under future climatic conditions, the rainfall runoff contribution to total runoff would be unchanged over the year (Fig. 7a) but the snowmelt contribution would decrease to almost zero as the snowfall decreased (Fig. 7b). The significance of groundwater runoff would increase in spring
and summer when groundwater would account for more than 90% of the total runoff (Fig. 7c) and sustain low flows in summer.
In the Illecillewaet catchment under present climatic conditions, runoff occurs mainly from snowmelt in spring and early summer and from the glacier in late summer and early autumn, whereas the surface and interflow rainfall runoff contribution is marginal throughout the year (Figs. 8a, 8b and 8c). Furthermore, groundwater is a significant contributor to the total runoff, especially during the “dry” winter months when it is the only source of runoff. (Fig. 8d).
For future climatic conditions, the rainfall runoff contributions to total runoff would remain small throughout the year (Fig. 8a). Runoff from snowmelt would increase in winter and decrease in spring due to earlier melting of the
Fig. 7. Contribution of the runoff generation processes to total
runoff – Upper Campbell catchment
a) R ainfall R unoff 0 25 50 75 100
Jan F eb Mar Apr M ay Jun Jul Aug S ep Oct N ov Dec
T o ta l R u n o ff (% ) P resent Climate F uture C limate b) Snowmelt R unoff 0 25 50 75 100
Jan F eb Mar Apr M ay Jun Jul Aug Sep O ct N ov Dec
T o ta l R u no ff (% ) Present C limate Future Climate c) Groundwate r R unoff 0 25 50 75 100
Jan F eb Mar Apr M ay Jun Jul Aug S ep Oct N ov Dec
T o ta l R u n o ff (% ) P resent Climate F uture Climate a) R ainfall R unoff 0 25 50 75 100
Jan Feb Mar Apr M ay Jun Jul Aug Sep O ct N ov Dec
To ta l R u n of f (% ) Present C limate Future Climate b) Snowmelt R unoff 0 25 50 75 100
Jan F eb Mar Apr M ay Jun Jul Aug S ep Oct N ov Dec
Tot al R u n of f ( % ) P resent C limate F uture C limate c) Glacie r R unoff 0 25 50 75 100
Jan Feb Mar Apr M ay Jun Jul Aug Sep O ct N ov Dec
To ta l R u n of f ( % ) Present C limate Future C limate d) Groundwate r R unoff 0 25 50 75 100
Jan Feb M ar Apr M ay Jun Jul Aug Sep O ct N ov Dec
To ta l R u n of f (% ) Present Climate Future Climate
Fig. 8. Contribution of the runoff generation processes to total
snowpack (Fig. 8b). The total and monthly distribution of runoff from the glacier would be the same as at present and it would remain a significant contributor of the total runoff in summer and early autumn. (Fig. 8c).
Finally, the contribution of the groundwater to total runoff in future would increase during spring, summer and autumn and decrease in winter; overall, groundwater would supply approximately 80% of the total runoff. The monthly contribution to total runoff would be more uniform than at present (Fig. 8d).
Concluding remarks
This study shows how the potential climate change in the maritime rain-fed Upper Campbell catchment would increase the annual precipitation by 7.6% and the mean annual temperature by 3.5oC. The warmer climate and the
higher temperatures would change the form of the precipitation so that the annual rainfall would increase by 47% while the annual snowfall decreased by 71%. The snowpack would decrease dramatically and it would be depleted by June. Overall, the annual runoff from rainfall would increase by 30% while the annual snowmelt would decrease by 83%. Furthermore, under the climate change scenario, the Upper Campbell catchment would become more permeable as vegetation colonised higher elevations in the catchment so that more runoff would be generated by outflow of groundwater. In summer, runoff would decrease and, in the late autumn and winter, it would increase so that the mean annual total runoff would increase by 13%. Groundwater would be the most significant contributor of the total runoff, especially during the “low flow” summer months when its contribution would account for more than 90% of the total. Runoff from rainfall would remain the most significant contributor to the total runoff in the autumn. In contrast, in the interior snow-covered Illecillewaet basin, the increased concentration of CO2 would cause a warmer and wetter climate which would affect the form of precipitation. The mean annual rainfall would increase by 87% and the mean annual snowfall would decrease by 17%. Despite the large increase of the mean annual rainfall, the mean annual runoff from rainfall would decrease by 21% because of the higher permeability of the catchment but its contribution to the total runoff would remain small and unchanged. However, the contribution of the runoff from snowmelt would increase slightly in winter and significantly in spring and summer. Higher summer temperatures would increase the rate of melting of the glacier so that the mean annual glacier runoff would decrease by 26% from a glacier some 33% reduced in area; however, its contribution to total runoff would remain rather unchanged. Finally, the mean
annual groundwater runoff would double due to higher infiltration rates. This increase would be concentrated mainly in winter and spring whereas runoff from groundwater would decrease in summer. All these changes in the runoff generation processes would increase the runoff in the autumn, winter, and early spring and reduce it in summer, so that the runoff hydrograph would peak earlier in the season. The mean annual total runoff would increase by 37%.
The coupling of a GCM output with the hydrological model used in this study is more realistic than other modelling approaches, although inherent uncertainties remain, largely in the global circulation and hydrological modelling. The global circulation modelling uncertainty is due to the assumptions of future greenhouse gas concentrations and aerosol emissions, to uncertainty in the modelling of the various atmospheric physical processes and feedback mechanisms, and uncertainty in the representation of the regional climate changes due to the coarse spatial resolution of the GCM. Overall, the possible errors introduced to the hydrological simulation could be large (IPCC, 1999; Kaleris et al., 2001). Also, the relatively simple “delta” method of downscaling the CGCMa1 output was adopted. Given the large uncertainties in the effects of global warming on temperature and precipitation at the basin scale, using a more complex methodology of downscaling would have added little meaningful detail. However, this relatively simple downscaling approach has been shown to provide an appropriate level of detail in the greater region of Pacific Northwest in the vicinity of British Columbia (Hamlet and Lettenmaier, 1999).
On the other hand, an attempt was made to minimise the uncertainties of the hydrological modelling by performing a good calibration of the U.B.C. model with historical data. Overall, the statistics for the calibration period show that the simulation for the Illecillewaet catchment is better than that for the Upper Campbell basin. The mean absolute percentage error of the U.B.C. model for the Upper Campbell is around 20%. Most of the relative changes in the hydrological regime of this maritime basin are larger than 20%. Hence, the U.B.C. model is able to detect changes in most of the hydrological variables and, especially, in the runoff components, for which the mean absolute changes are larger than 30%. However, the hydrological modelling uncertainty for the Upper Campbell is higher than that for the Illecillewaet for the calibration period of which the mean absolute error is 21%. This hydrological modelling error is less than the estimated changes of the hydrological variables in the catchment. Moreover, earlier successful applications of the U.B.C. model to geographical regions with climates different from the climate of British Columbia suggest that
the model is able to simulate runoff in a variety of climates. Nevertheless, there remain uncertainties in the description of the future vegetation and glacier coverage in the catchments under study. It is hoped that these uncertainties have been minimised since the values of the geophysical parameters adopted in the hydrological modelling have been estimated by contemporary methods, models and the results of physical experiments. In conclusion, the hydrological modelling approach can detect, with reasonable certainty, most of the changes for the future climate hydrological regime, always assuming the reliability of the average changes in the meteorological variables (precipitation, temperature, and cloud cover), estimated by CGCMa1. However, the output of the GCM is rather questionable, especially as regards precipitation and cloud cover (IPCC, 2001). If the GCM uncertainty is accounted for in the hydrological simulation then the above results are subjected to high uncertainty.
The findings of this study are important for future water resources management practices and design in the two catchments studied, since each contributes runoff to a major British Columbia reservoir. Also, the results of this analysis could be used, in a future study, to simulate climate change implications on the water quality of the total runoff.
Acknowledgements
The authors thank the three anonymous reviewers and the editor for their helpful comments, which improved the quality of the final manuscript. The authors also acknowledge the Guest Editor, Dr. A. Montanari, for the rigorous and timely handling of the reviewing process of the paper.
References
Assaf, H. and Quick, M.C., 1991a. Updating hydrological model forecasts. Can. J. Civil Eng., 18, 663–674.
Assaf, H. and Quick, M.C., 1991b. Updating snowpack forecasts.
Proc. 10th Canadian Hydrotechnical Conference, Canadian Society for Civil Engineering, Vancouver, June 1991, 419–428.
Assaf, H., Loukas, A. and Quick, M.C., 1995. Updating seasonal snowmelt estimates using snowcourse measurements. Proc. of
the 1995 Western Snow Conference, Reno-Sparks, April 1995,
21–28.
Boer, G.J., Flato, G., Reader, M.C. and Ramsden, D., 2000. A transient climate change simulation with greenhouse gas and aerosol forcing: experimental design and comparison with the instrumental record for the twentieth century. Climate Dynam., 16, 405–425.
Braithwaite, R.J. and Olesen, O.B., 1989. Calculation of glacier ablation from air temperature, West Greenland. In: Glacier
Fluctuations and Climatic Change, J. Oerlemans (Ed.), Kluwer,
Dordrecht, The Netherlands, 219–233.
Brandsma, T. and Buishand, T.A., 1997. Statistical linkage of daily precipitation in Switzerland to atmospheric circulation and temperature. J. Hydrol., 198, 98–123.
Cure, J.D. and Acock, B., 1986. Crop responses to carbon dioxide doubling: a literature survey. Agric. Forest Meteorol., 38, 127– 145.
Druce, D.J., 2001. Insights from a history of seasonal inflow forecasting with a conceptual hydrologic model. J. Hydrol., 249, 102–112.
Fanta, J., 1992. Possible impact of climatic change on forested landscapes in central Europe: A review. In: Greenhouse-Impact
on Cold Climate Ecosystems and Landscapes, Catena Supplement, 22, 133–151.
Gellens, D. and Roulin, E., 1998. Streamflow response of Belgian catchments to IPCC climate change scenarios, J. Hydrol., 210, 242–258.
Hamlet, A.F. and Lettenmaier, D.P., 1999. Effects of climate change on hydrology and water resources in the Columbia River basin, J. Amer. Water Resour. Ass., 35, 1597–1623.
Hay, L.E., Wilby, R.L. and Leavesley, G.H., 2000. A Comparison of delta change and downscaled GCM scenarios for three mountainous basins in the United States. J. Amer. Water Resour.
Ass., 36, 387–397.
Hirst, A.C., O’Farrell, S.P. and Gordon, H.B., 2000. Comparison of a coupled ocean-atmosphere model with and without oceanic eddy-induced advection. 1. Ocean spin-up and control integrations. J. Climate, 13, 139–163.
Hudson, R.O. and Quick, M.C., 1997. Component based water chemistry simulator for small subalpine watersheds. Can. Water
Res. J., 22, 299–325.
IPCC, 1999. Guidelines on the use of scenario data for climate
impact and adaptation assessment.Version 1, by T.R. Carter,
M. Hulme, and M. Lal, Intergovermental Panel on Climate Change, Task Group on Scenarios for Climate Impact Assessment. 69 pp.
IPCC, 2001. Climate change 2001-The scientific basis. Contribution of Working Group I to the Third Assessment Report of the Intergovernmental Panel on Climate Change (IPCC), J.T. Houghton, Y. Ding, D.J.Griggs, M. Noguer, P.J. van der Linden and D. Xiaosu (Eds.), Cambridge University Press, UK. 944 pp.
Johns, T.C., Carnell, R.E., Crossley, J.C., Gregory, J.M., Mitchell, F.B., Senier, C.A., Tett, S.F.B. and Woods, R.A., 1997. The second Hadley Centre coupled ocean-atmosphere GCM: Model description, spinup and validation. Clim. Dynam., 13, 103–134. Kaleris, V., Papanastasopoulos, D. and Lagas, G., 2001. Case study on impact of atmospheric circulation changes on river basin hydrology: uncertainty aspects. J. Hydrol., 245, 137–152. Khan, M.I., 1995. The effects of snow avalanches on the hydrologic
regime of the Kunhar river, Western Himalayan, Pakistan: analysis and application to river flow forecasting. M.A.Sc.
Thesis, Department of Civil Engineering, University of British Columbia, Vancouver, 148 pp.
Kite, G.W., 1993. Application of a land class hydrological model to climate change. Water Resour. Res., 29, 2377–2384. Korner, C., 1992. Response of alpine vegetation to global climate
change, In: Greenhouse-Impact on Cold Climate Ecosystems
and Landscapes, Catena Supplement, 22, 85–96.
Laumann, T. and Reeh, N., 1993. Sensitivity to climate change of the mass balance of glaciers in southern Norway. J. Glaciol., 39, 656–-665.
Leung, R.L. and Wigmosta, M.S., 1999. Potential climate change impacts on mountain watersheds in the Pacific Northwest. J.
Amer. Water Resour. Ass. 35, 1463–1471.
Loukas, A. and Quick, M.C., 1996. Effect of climate change on hydrologic regime of two climatically different watersheds. J.
Hydrol. Eng., 1, 77–87.
Loukas, A. and Quick, M.C., 1999. The effect of climate change on floods in British Columbia. Nordic Hydrol., 30, 231–256. Manabe, S. and Stouffer, R.J., 1996. Low frequency variability
of surface air temperature in a 1,000-Year integration of a coupled atmosphere-ocean-land surface model. J. Climate, 9, 376–393.
McCabe, G.J. and Wolock, D.M., 1999. General-Circulation-Model simulations of future snowpack in the western United States. J. Amer. Water Resour. Ass., 35, 1473–1484.
Mehrotra, R. and Singh, R.D., 1998. Spatial disaggregation of rainfall data. Hydrolog. Sci. J., 43, 91–102.
Micovic, Z. and Quick, M.C., 1999. A rainfall and snowmelt runoff modelling approach to flow estimation at ungauged sites in British Columbia. J. Hydrol., 226, 101–-120.
Miller, N.L., Kim, J., Hartman, R.K. and Farrara, J., 1999. Downscaled climate and streamflow study of the southwestern United States. J. Amer. Water Resour. Ass., 35, 1525–1537. Moore, R.D., 1992. The influence of glacial cover on the variability
of annual runoff, Coast mountains, British Columbia, Canada.
Can. Water Resour. J., 17, 101–109.
Nash, J.E. and Sutcliffe, J.V., 1970. River flow forecasting through conceptual models. Part-1 A discussion of principles, J. Hydrol. 10, 282–290.
Oerlemans, J. and Wegener, A., 1989. On the response of valley glaciers to climatic change. In: Glacier Fluctuations and
Climatic Change, J. Oerlemans (Ed.), Kluwer, Dordrecht, The
Netherlands, 353–371.
Ozenda, P. and Borel, J.J., 1990. The possible responses of vegetation to a global climatic change. In: Scenarios for Western
Europe with Special Reference to the Alps. Proc. European
Conference on Landscape Ecological Impact of Climatic Change, IOS Press, Amsterdam, Netherlands, 221–249. Parry, M., 1992. The potential effect of climate changes on
agriculture and land use. Adv. Ecol. Res., 22, 63–91.
Pelto, M.S., 1989. Time-series analysis of mass balance and local climatic records from four northwestern North American glaciers. In: Snow Cover and Glacier Variations, IAHS Publ.
no. 183, 95–102.
Post, W.M., Pastor, J., King, A.W. and Emanuel, W.R., 1992. Aspects of the interaction between vegetation and soil under global change. Water Air Soil Pollut., 64, 345–363.
Quick, M.C., 1995. U.B.C. Watershed Model Manual-Version 4.0. Dept. of Civil Engineering, University of British Columbia, Vancouver, B.C., Canada.
Quick, M.C. and Pipes, A., 1976. A combined snowmelt and rainfall-runoff model. Can. J. Civil Eng., 3, 449–460. Schaefer, D.G. and Nikleva, S.N., 1973. Mean precipitation and
snowfall maps for a mountainous area of potential urban development. Proc. of the 1973 Western Snow Conference, 80– 89.
Singh, P. and Kumar, N., 1997. Impact assessment of climate change on the hydrological response of a snow and glacier melt runoff dominated Himalayan river. J. Hydrol., 193, 316–350. Smith, T.M., Shugart, H.H., Bonan, G.B. and Smith, J.B., 1992.
Modeling the potential response of vegetation to global climate change. Adv. Ecol. Res., 22, 93–116.
Storr, D. and Ferguson, H.L., 1972. The distribution of precipitation in some mountainous Canadian watersheds. In:
Distribution of Precipitation in Mountainous Areas, WMO, Vol.
II, 241–263.
Wigley, T.M.L. and Jones, P.D., 1985. Influences of precipitation
changes and direct CO2 effects on streamflow. Nature, 314, 149–
152.
Wilby, R.L., Hay, L.E. and Leavesley, G.H., 1999. A comparison of downscaled and raw GCM output: implications for climate change scenarios in the San Juan River basin, Colorado. J.
Hydrol., 225, 67–91.
Wilson, C.A. and Mitchell, J.F.B., 1987. A doubled CO2 climate
sensitivity experiment with a global climate model including a simple ocean. J. Geophys. Res., 92, 13315–13343.
Zoltai, S.C., 1988. Ecoclimatic provinces of Canada and man-induced climatic change. Newslett. Can. Comm. Ecol. Land