HAL Id: hal-02404721
https://hal.archives-ouvertes.fr/hal-02404721
Submitted on 31 Dec 2020HAL is a multi-disciplinary open access archive for the deposit and dissemination of sci-entific research documents, whether they are pub-lished or not. The documents may come from teaching and research institutions in France or abroad, or from public or private research centers.
L’archive ouverte pluridisciplinaire HAL, est destinée au dépôt et à la diffusion de documents scientifiques de niveau recherche, publiés ou non, émanant des établissements d’enseignement et de recherche français ou étrangers, des laboratoires publics ou privés.
Promoting carboxylate salts in the ESI source to
simplify positive mode MS/MS sequencing of
acid-terminated encoded polyurethanes
Salomé Poyer, Benoit Eric Petit, Sofia Telitel, Denise Karamessini,
Jean-François Lutz, Laurence Charles
To cite this version:
Salomé Poyer, Benoit Eric Petit, Sofia Telitel, Denise Karamessini, Jean-François Lutz, et al.. Promot-ing carboxylate salts in the ESI source to simplify positive mode MS/MS sequencPromot-ing of acid-terminated encoded polyurethanes. International Journal of Mass Spectrometry, Elsevier, 2020, 448, pp.116271. �10.1016/j.ijms.2019.116271�. �hal-02404721�
1
Promoting carboxylate salts in the ESI source to simplify positive mode
MS/MS sequencing of acid-terminated encoded polyurethanes
Salomé Poyer,1 Benoit Eric Petit,2 Sofia Telitel,2 Denise Karamessini,2 Jean-François Lutz,2* and Laurence Charles1*
1 Aix Marseille Univ, CNRS, ICR, Institut de Chimie Radicalaire, Marseille – France 2 Université de Strasbourg, CNRS, Institut Charles Sadron UPR22, Strasbourg, France
* To whom correspondence should be addressed. E-mail: laurence.charles@univ-amu.fr
Phone: +33 491 28 8678. Fax: +33 491 28 2897. Email: jflutz@unistra.fr. Phone: +33 388 41 4016. Fax: +33 388 41 4099.
Published in International Journal of Mass Spectrometry, 448, 116271 (2020)
2
Abstract
Synthetic polymers prepared by solid-phase processes are often released from the solid support by hydrolysis, leading to an acidic α chain-end which can usefully be employed to perform mass spectrometry experiments in the negative ion mode. This is the case for sequence-defined polyurethanes, which exhibit very simple MS/MS pattern as deprotonated species in great contrast to data obtained in the positive ion mode. Indeed, after deprotonation of their acidic end-group, collision induced dissociation (CID) of these polymers proceeds via competitive cleavages of all carbamate bonds. This leads to a unique series of anionic fragments spaced by the mass of one of the other coding co-monomer, enabling their sequence to be readily deciphered. However, as their size increases, polyurethanes are best ionized in the positive mode but their dissociation pattern is far more complicated, with four to five fragmentation routes depending on the adducted cation. This spectral complexity could however be highly reduced when selecting precursor ions that have experienced H/Na (or any other alkali) exchange in their acidic α end-group: in these conditions, only one reaction is observed and yields pairs of complementary products. Mechanisms could be proposed to explain how, although part of an end-group, the acidic proton had a key role in the dissociation processes of polyurethane chains. Exchange of this proton was then further optimized by proper selection of the X– anion in the NaX salt supplemented to the electrosprayed solution. By allowing simplification of MS/MS data while avoiding signal dilution over multiple ion series, CID of these [M – H + zNa](z–1)+ permitted to envisage
3
1. Introduction
Tandem mass spectrometry (MS/MS) has proved to be an unrivaled technique to decipher binary information encoded in the backbone of sequence-defined polymers [1]. Such macromolecules are typically composed of co-monomers of different mass arranged in a controlled manner throughout the chain [2-4]. For example, digital polymers can be prepared with two co-monomers arbitrarily defined as the 0- and 1-bit of the ASCII code. However, reliable decoding of such digital messages requires MS/MS data to allow full coverage of the binary sequence regardless of the chain length. This means that the same dissociation reactions should occur in all repeating units, independently of their coding moiety. As previously demonstrated in the field of DNA storage, long messages are preferentially composed of individual chains containing about 100 coded residues rather than written in very long chains [5]. To achieve de novo sequencing in this size range, the number of fragmentation pathways should be limited to avoid extensive dilution of total ion signal. Since the types of backbone bonds dictate the dissociation behavior of synthetic macromolecules [6], the structure of sequence-defined polymers has to be optimized to control their dissociation extent [7].
To prevent sequence-dependent reactions, chemical groups of low MS/MS reactivity have to be selected to implement the code, such as the simple H/CH3 variation in alkyl segments
used in most digital polymers developed in our group [8-10]. Beside the nature of coding moiety, two main strategies can be envisaged to design the polymeric skeleton. One can first focus on developing synthesis protocols for production of highly monodisperse samples of long polymeric chains, which molecular structure can be further optimized to ensure their MS/MS readability [11]. For example, this approach was successfully implemented for sequence-defined poly(phosphodiester)s. These species were first synthesized as defect-free chains with degrees of polymerization (DP) above 100 using an automated synthesis protocol to implement phosphoramidite chemistry [12]. However, while readily ionized in the negative mode electrospray ionization (ESI), collisional activation of poly(phosphodiester)s led to very complex MS/MS data due to efficient cleavage of all phosphate bonds. Abundance of the resulting eight fragment series, also dispersed in terms of charge state, was too weak to allow full sequence coverage of chains with DP above 50 [11]. Specific phosphoramidite reagents were then prepared to introduce, between each group of 8 coded bits (i.e., one byte), an alkoxyamine linkage which cleavage required much lower energy compared to phosphate bonds. As a result, successful decoding of long byte-truncated poly(alkoxyamine
4
phosphodiester)s could be achieved by performing a first activation stage to specifically induce homolysis of these C–ON bonds, followed by a second activation stage to sequence so-formed (small) single byte containing fragments [13]. The alternative bottom-up strategy consists of (i) selecting candidates based on high MS/MS readability demonstrated for short oligomers and (ii) dedicating further efforts to maintain their simple dissociation pattern while increasing their chain length. This approach is explored here for sequenced-defined polyurethanes (PUs). When subjected to collision-induced dissociation (CID), PU oligomers with DP=4-12 exhibited very simple MS/MS pattern which revealed that only one reaction occurred in all repeating units, giving rise to a single fragment series due to a fixed negative charge in the oligomer α end-group [14]. As a result, coded sequences could be literally read from peak-to-peak distance in MS/MS spectra and a simple algorithm was created for automated extraction of digital data [15]. Alternatively, the code could be graphically read using Kendrick mass defect plots [16]. Although optimal for straightforward MS/MS decoding in the negative ion mode, sequence-defined PUs exhibited decreasing ionization yield as their chain length increased. This issue could be solved by performing positive mode ESI, but CID of cationized PUs led to more complex MS/MS data, as previously reported for related species [17-19]. Because the nature of activated precursors was previously reported to highly influence CID outputs for some synthetic polymers [20-22], different cationic adducts were investigated for their influence on the MS/MS behavior of PUs.
2. Experimental section
2.1. Chemicals
HPLC-grade solvents used to prepare sequence-defined PU samples (methanol, water, tetrahydrofuran) were purchased from Carlo Erba (Peypin, France). Salts used to promote formation of PU cationic adducts were ammonium acetate, sodium chloride, lithium fluoride, potassium iodide, rubidium bromide, cesium chloride, all obtained from Sigma (Saint Louis, MO) and used without further purification. Sequence-defined PUs used in this study (Supporting Information Table S1) were prepared according to a synthesis protocol published elsewhere [9]. Each PU sample (a few mg) was dissolved in THF and further diluted in methanolic solutions of different salts (see text).
2.2. Mass spectrometry
MS and MS/MS experiments were carried out a hybrid Q-TOF mass spectrometer Synapt G2-HDMS instrument (Waters, Manchester, UK). The ESI source was operated at 50°C, with
5
a desolvation gas temperature of 100°C, using the following settings: i) negative ion mode: capillary voltage, –2.3 kV; sampling cone, –35-120 V depending on PU chain length; extraction cone, –4.0 V; ii) positive ion mode: capillary voltage, +2.8 kV; sampling cone, +30-80 V depending on the species (see text); extraction cone, +4.0 V. All ions were accurately mass measured using the orthogonal acceleration (oa) time of flight (TOF) mass analyzer, with external calibration based on sodium acetate clusters in the MS mode or using the precursor ion as an internal standard in the MS/MS mode. MS/MS experiments were performed by subjecting selected precursor ions upon collisions with argon in a collision cell. Instrument control, data acquisition and data processing of all experiments were achieved with the MassLynx 4.1 programs provided by Waters. MSn experiments were performed with
a QTrap3200 mass spectrometer (Applied Biosystems Sciex, Concord, ON, Canada) equipped with an ESI source operated in positive ion mode, using a capillary voltage of +5.5 kV and a cone voltage of +75 V. Zero-grade air was used as the nebulizing gas (at a pressure of 10 psi) whereas nitrogen was used as the curtain gas (at a pressure of 20 psi) as well as the collision gas. In this instrument, precursor ions selected by a quadrupole and activated in a collision cell led to fragments that were further selectively sampled in a linear ion trap for a second activation stage. Instrument control, data acquisition and data processing of all experiments were achieved using Analyst software (version 1.4.1) provided by Applied Biosystems.
3. Results and discussion
3.1. CID of PUs: positive vs negative ion mode
Sequence-defined PUs were prepared using a chemoselective multistep-growth process implemented on a hydroxyfunctionalized crosslinked polystyrene resin, and their cleavage from the solid support led to an acid moiety at their α chain-end [9]. This enabled their deprotonation in the negative mode ESI, which happened to be extremely useful for their MS/MS sequencing. Indeed, as detailed in a previous study [14], deprotonated PUs experienced one bond cleavage per unit upon CID, leading to very simple MS/MS data composed of a single series of fragments spaced by the mass of one of the other co-monomers (115.0 Da for bit-0 vs 129.1 Da for bit-1). These ai– product ions were formed upon cleavage
of the O–CO bond in each carbamate group and all contained the deprotonated α termination, as exemplified in Supporting Information Fig. S1 with the 4-mer named P1. Accordingly, the
0001 sequence of P1 could be readily re-constructed from the peak-to-peak m/z distance equal
6
kept unchanged for longer PUs, deprotonation yield strongly decreased as the chain length increased. For the P2 16-mer shown in Supporting Information Fig. S2, acquisition time had to be increased by a factor of 50 in the MS/MS mode to ensure detectability of all fragments. This was no longer compatible with high throughput reading of low amounts of coded polymers and did not offer interesting perspectives for sequencing of much longer chains. In contrast, high ion current was recorded in the positive ion mode for PU oligomers. For example, a nearly 20-fold enhancement was measured for the doubly charged 16-mer P2 compared to the deprotonated molecule (Supporting Information Fig. S3). However, CID spectra recorded in the positive mode exhibited dissociation patterns far more complex than that observed for deprotonated PUs. As shown in Fig. 1(a), dissociation of protonated P1 was observed to proceed by cleavage of all bonds in the carbamate moieties, conducted to four product ion series (Supporting Information Table S2). Restricting the nomenclature proposed by Wesdemiotis et al. [6] to the sole carbamate moiety, fragments containing the left-hand side group were named αi+ when formed after cleavage of the CH2–O bond and ai+ when
resulting from the cleavage of the O–(CO) bond, while xj+ and yj+ ions both containing the
termination arose from cleavage at the O–(CO) and the (CO)–NH bonds, respectively (Fig. 1, top scheme). Although coverage of the 0001 sequence of P1 was achieved with each ion series observed in Fig.1(a), this made these MS/MS data highly redundant. Moreover, product ions were also dispersed in terms of charge states when formed from multiply protonated species generated upon ESI of long PUs. In addition, at the energy levels requested to produce all fragments for full sequence coverage of increasing length PUs, extensive secondary dissociation occurred and further increased CID data complexity (Supporting Information Fig.
S4 and Table S3). Alkali adducts could also be easily formed in the positive mode ESI since
PUs contain carbonyl and ether oxygen atoms. However, their activation led to even more complex MS/MS spectra compared to protonated species, with an additional series of wj+ ions
(containing the end-group and formed after cleavage of the CH2–O bond) as illustrated in
Fig. 1(b) for [P1 + Na]+. Lithiated P1 exhibited the same dissociation behavior whereas CID of [P1 + K]+, [P1 + Rb]+ or [P1 + Cs]+ conducted to the release of the naked alkali (Supporting Information Fig. S5), as commonly reported for polyethers where the strength of alkali adduction was shown to decrease for increasing size cations [20, 21]. In great contrast, highly simplified CID data were recorded for [P1 – H + 2Na]+ ions, i.e., sodium adducts of P1 in which H/Na exchange has occurred in the carboxylic acid group of the α termination (Fig.
1(c)). A major complete distribution of ai+ fragments was observed, together with a few (less
7
precursors containing alternative alkali, regardless of their size (Supporting Information Fig.
S6). These last results suggested that the adducted cation was more tightly bound to the alkali
carboxylate form of P1 compared to its acidic form. Interestingly, the same simple dissociation behavior still applied as the chain size was increased (vide infra), permitting to anticipate high benefits for full sequence coverage of much larger PUs.
Fig. 1. ESI-MS/MS spectra of (a) [P1 + H]+ at m/z 607.4 (X=H), (b) [P1 + Na]+ at m/z 629.3 (X=H) and (c) [P1 – H + 2Na]+ at m/z 651.3 (X=Na). Top: dissociation scheme with X = H or Na. Peaks annotated in grey correspond to secondary fragments. # designates dehydration products while the peak annotated with a black triangle in part b) correspond to a sodiated monomer (see text). For the sake of clarity, most minor peaks were not annotated but a complete list of fragments is reported in Supporting Information Table S2 for [P1 + H]+,
Table S4 for [P1 + Na]+ and Table 1 for [P1 – H + 2Na]+. These experiments were performed with the Synapt G2-HDMS mass spectrometer. Activation energies are given in the center-of-mass frame.
8
before HDX after HDX
composition m/zth m/zexp composition m/zth m/zexp
a1+ C6H11O3Na2+ 177.0498 177.0501 C6H10DO3Na2+ 178.0561 178.0566 a2+ C11H20NO5Na2+ 292.1131 292.1134 C11H18D2NO5Na2+ 294.1257 294.1260 a3+ C16H29N2O7Na2+ 407.1765 407.1758 C16H26D3N2O7Na2+ 410.1953 410.1953 a4+ C21H38N3O9Na2+ 522.2398 522.2401 C21H34D4N3O9Na2+ 526.2649 526.2659 x1+ C6H11NO2Na+ 152.0682 n.d. C6H10DNO2Na+ 153.0745 n.d. x2+ C11H20N2O4Na+ 267.1315 267.1306 C11H18D2N2O4Na+ 269.1441 n.d. x3+ C16H29N3O6Na+ 382.1949 382.1944 C16H26D3N3O6Na+ 385.2137 385.2139 x4+ C21H38N4O8Na+ 497.2582 497.2585 C21H34D4N4O8Na+ 501.2833 501.2831
Table 1. Accurate mass measurement of fragments formed in CID of sodiated P1-Na (Fig. 1(c)) using the precursor ion (C27H49N4O11Na2+, m/z 651.3188 before H/D exchanges, left;
C27H44D5N4O11Na2+, m/z 656.3502 after H/D exchanges, right) as an internal standard. n.d.:
not detected
Overall, MS/MS data recorded for the salt form of P1 (Fig. 1(c)) strongly suggested that the acidic proton of the α end-group played a key role in the dissociation of [P1+H]+ (Fig.
1(a)) and of [P1+Na]+ (Fig. 1(b)). This is similar to reported works on unsaturated fatty acids, where formation of [M – H + 2X]+ ions (with X = alkali) by Hsu and Turk [23] or of [M – H + Ba]+ ions by Volmer et al. [24] was shown to inhibit fragmentation mechanisms driven by the carboxylate while promoting charge-remote fragmentation along the hydrocarbon backbone to yield useful information about double bond location. These reactions were further investigated in order to understand the influence of the carboxylate α termination on CID of PUs, using the example of the small P1 4-mer for the sake of clarity.
3.2. Mechanistic study of PU dissociation
In order to understand how the nature of the dissociating precursor influenced its dissociation pathways, complementary experiments were performed to rationalize MS/MS data of Fig. 1. Hydrogen/deuterium exchanges (HDX) were promoted by preparing PU solutions in deuterated methanol. In such conditions, P1 had six protons exchanged to deuterium, one in the α carboxylic acid function, one in the alcohol group and one in each carbamate moiety. CID spectra were hence recorded for [P1-d6 + D]+ at m/z 614.4, [P1-d6 + Na]+ at m/z 635.4 and [P1-d6 – D +2Na]+ at m/z 656.4. All CID fragments detected before or
9
after HDX were accurately mass measured. MS3 experiments were also conducted to check
whether product ions were primary or secondary fragments or to distinguish consecutive from competitive pathways.
Production of wj+ fragments was only observed upon activation of [P1 + Na]+ (Fig. 1(b)),
indicating that their formation required both the acidic proton of the α end-group and an adducted sodium. Moreover, MS3 experiments showed that they were formed according to a consecutive process (Supporting Information Fig. S7). Accordingly, the mechanism depicted in Scheme 1 was proposed, where solvation of the adducted sodium by oxygen atoms of the first units of P1 would favor the transfer of the α-end acidic proton onto the first carbonyl oxygen, leading to the formation of w4+ after elimination of the 114.0 Da caprolactone.
Scheme 1. Mechanism proposed to account for the formation of wj+ fragments upon CID of
[P1 + Na]+ at m/z 629.3.
Then, similar sodium solvation in w4+ would allow the first coding unit to be released as a
cyclic 115.0 neutral to yield w3+. Iteration of the latter reaction would conduct to w2+ and w1+.
Detection of the cyclic monomer at m/z 138.1 when adducted to sodium (designated by a black triangle in Fig. 1(b)) would further support such a multiple step process. Of note, the sodiated caprolactone expected as a complementary m/z 137.1 fragment in the first step of
Scheme 1 could not be distinguished from the α1+ fragment of the same C6H10O2Na+
10
experiments, showing that each wj+ ion was formed upon D-transfer (Supporting Information
Table S4).
The lack of αi+ and yj+ fragments in the CID spectrum of [P1 – H + 2Na]+ (Fig. 1(c))
indicated that the α acidic proton also had a key role in the formation of these product ions. Indeed, when generated from [P1 + Na]+ (Fig. 1(b)), yj+ ions were detected as sodiated
species, strongly suggesting that the dissociating m/z 629.3 precursor was a sodium adduct of P1 rather that the protonated form of P1 having a sodium carboxylate as the α termination. HDX experiments indicated that αi+ species lacked one exchangeable proton while yj+ ions
had gained one (Supporting Information Table S2 and Table S4). Accordingly, proposed mechanisms involved a structure with intra-molecular hydrogen bonds which would favor i) transfer of the α acidic proton to a carbamate NH group (Scheme 2, pathway 1 in blue) or ii) abstraction of the carbamate proton of one unit by the NH moiety of the next one (Scheme 2, pathway 2 in red). Both reactions would eliminate CO2 and produce either αi+ or yj+
depending on the location of the adducted cation.
Scheme 2. Mechanism proposed to explain the formation of αi+ or yj+ fragments upon CID of
precursor ions holding the acidic α termination such as [P1 + H]+ at m/z 607.4 and [P1 + Na]+ at m/z 629.3.
The same mechanism could apply when starting from either protonated or sodiated precursors. However, relative intensity of yj+ ions was very different in each case. When
generated from [P1 + H]+, yj+ ions exhibited a Gaussian-like distribution (Fig. 1(a)), and MS3
experiments showed that they were formed according to a consecutive process (Supporting Information Fig. S8(a)). In contrast, when formed from [P1 + Na]+, abundance of yj+
fragments strongly increased as their size decreased (Fig. 1(b)). As shown in MS3, monomer elimination was indeed a minor dissociation pathway for yj+ formed from [P1+Na]+
11
(Supporting Information Fig. S8(b)). Alternatively, these yj+ ions were readily generated as
secondary fragments after loss of CO2 from wj+ ions, as supported by MS3 data (Supporting
Information Fig. S7).
Finally, CID data of Fig. 1 showed that ai+/xj+ product ions were detected regardless of the
type of precursor ion. However, relative ion abundance measured in these two ion series slightly varied as a function of the dissociating species. As previously shown in the case of deprotonated PUs [14], multiple reactions could be envisaged for the formation of these fragments. Exploring all these processes is beyond the scope of this study which, instead, focused on the case of [P1 – H + 2Na]+. Because ai+ and xj+ ions obtained upon cleavage of
the same O–CO bond in this m/z 651.3 precursor were measured with very different abundances (see a1+ vs x4+, a2+ vs x3+, a3+ vs x2+, a4+ vs x1+ in Fig. 1(c)), they were not
envisaged as complementary fragments formed during a charge-remote reaction but, instead, as ions produced via two distinct mechanisms. Since all ai+ ions contained two Na (Table 1),
they were proposed to be formed upon successive elimination of cyclic monomers after transfer of the terminal hydroxy proton onto the ether oxygen (activated by the adducted sodium) of the preceding carbamate group (Scheme 3, pathway 1 in red).
Scheme 3. Proposed mechanisms for the dissociation of [P1 – H + 2Na]+ species: pathway 1 (in red) could rationalize consecutive production of ai+ ions, whereas pathway 2 (in pink) and
pathway 3 (in blue) would account for the competitive formation of xj+ ions.
In contrast, to account for the decreasing abundance of xj+ ions as their size decreased,
competitive reactions involving a 1,3-proton transfer were considered, as proposed by Gies and Hercules for related species [19]. Consistent with HDX experiments (Table 1), a proton would be transferred either from the NH group onto the ether oxygen of the same carbamate moiety (Scheme 3, pathway 3 in blue). Alternatively, one could also consider transfer of the
12
hydroxyl proton in the enol form of a carbamate group, as illustrated by pathway 2 (in pink,
Scheme 3). The latter reaction was also proposed since the enol form of carbamate moieties
was evidenced in the formation of internal fragments at m/z 160.0, m/z 174.1 and m/z 275.1 (annotated in grey in Fig. 1(c)), as described in Supporting Information Scheme S1. None of the reactions depicted in Scheme 3 produced the complementary fragments expected at m/z 152.1 (sodiated unit 1) and m/z 138.1 (sodiated unit 0) in pathway 1, m/z 292.1 in pathway 2 and m/z 177.1 in pathway 3. This result is consistent with the proposed strong solvation of the adducted cation by multiple oxygen atoms of P1 (Scheme 3), which would also prevent release of the naked alkali, regardless of its size (Supporting Information Fig. S6). In contrast, presence of the acidic α termination in [P1 + Na]+ would favor the formation of a hydrogen bond network (as proposed in Scheme 2), preventing strong interaction with the adducted alkali and its facile release as its size increased, as observed when activating P1 cationized with K+, Rb+ or Cs+ (Supporting Information Fig. S5).
3.3. Promoting formation of PU salts
Although [P1 – H + 2Na]+ ions exhibited a highly promising CID behavior for MS/MS sequencing of larger PUs, it should be acknowledged that abundance of these species remained minor (about 30%) compared to [P1 + Na]+, when employing a 1 mM NaCl
solution. Due to the low volatility of sodium salts, the amount of NaCl could only be increased up to 3 mM but with no significant improvement of the absolute (or relative) intensity of the [P1 – H + 2Na]+ signal. Optimizing the declustering potential (DP) that
governed ion sampling from the ESI atmospheric pressure into the vacuum side of the mass spectrometer allowed an overall signal enhancement although it was not specific to the sodium salt form of PUs: as observed for the P3 8-mer of sequence 01000010, increasing DP from 20 to 60 V allowed ion abundance to be roughly increased by a factor of about 3 for both [P3 + 2Na]2+ at m/z 563.3 and [P3 – H +3Na]2+ at m/z 574.3 (Supporting Information Fig. S9). Different NaX salts were then tested in order to optimize production of [P – H +zNa](z–1)+ species, using the P4 8-mer of sequence 01000100 as a model. The best salt to use was found to be NaOH because it is both basic and highly dissociated in polar solvents, and hence allowed the [P4 – H + 3Na]2+ ion at m/z 574.3 to be obtained with maximal absolute abundance (Fig. 2(a)). Addition of 1 mM NaOH in the electrosprayed solution did not induce major loss of sensitivity, as shown in Fig. 2(b) by similar abundances measured for [P4 + 3Na]2+ when using NaI and [P4 – H + 3Na]2+ when using NaOH.
13
Fig. 2. (a) Absolute abundance of the [P4 – H + 3Na]2+ ion at m/z 574.3 (grey bars, with
average values on top) as a function of the NaX salt supplemented to the electrosprayed solution. Error bars as standard deviation of 3 replicates. (b) ESI(+) mass spectra (m/z 550-580) showing relative abundance of [P4 + 2Na]2+ (m/z 563.3) and [P4 – H + 3Na]2+ (m/z
574.3) when using NaI, NaCH3COO and NaOH as the cationization agent (each at 1 mM).
Absolute abundance of these two species is indicated into parentheses. These experiments were performed with the Synapt G2-HDMS mass spectrometer.
3.4. Sequencing of long PU oligomers
These optimal conditions were then used for positive mode sequencing of the P2 16-mer. When prepared in a methanolic solution of NaOH (1 mM), this oligomer was readily electrosprayed as the doubly charged [P2 – H + 3Na]2+ species and was observed to dissociate into the two main aiz+ and xjz+ ion series (Fig. 3(a) and Supporting Information Table S5).
Using low activation energy level (e.g., 40 eV laboratory frame for data shown in Fig. 3(a)) permitted to minimize secondary fragments (annotated in grey) while achieving full coverage of P2 sequence with the complete series of aiz+ ions (annotated in blue), detected with z = 1
from i = 1-12 and z = 2 from i = 10-16. The 1101001011011000 code written in the backbone of P2 was best read after charge state deconvolution of these MS/MS data (Fig. 3(b)). Starting
14
from a1 always expected with a 154.0 Da mass since it does not contain any coding moiety
(Fig. 1, top scheme), the sequencing task simply consisted of searching for the next ai+1 signal
by adding either 115.1 Da (mass of the 0-bit) or 129.1 Da (mass of the 1-bit). As a result, following blue arrows in Fig. 3(b) allowed the binary message to be readily deciphered. The partial sequence reconstructed when using xj species had, instead, to be read from the right- to
the left-hand side (as indicated by red arrows below the x-axis of Fig. 3(b)) and was used as a validation tool.
Fig. 3. (a) ESI(+)-MS/MS of [P2 – H + 3Na]2+ at m/z 1076.6, using a 1.45 eV activation energy (center-of-mass frame). In the associated dissociation scheme (inset), singly and doubled charged fragments are respectively designated with single and double pattern, in blue for aiz+ and in red for xjz+. Grey # symbols designate secondary fragments, including the two
internal m/z 160.0 and m/z 174.0 ions. (b) Charge-deconvoluted MS/MS spectrum with masses of ai and xj species annotated in blue and red, respectively. Unlabelled minor peaks
15
correspond to secondary fragments. In both spectra, the y-axis has been expanded by a factor of 3 for the sake of clarity. These experiments were performed with the Synapt G2-HDMS mass spectrometer.
4. Conclusion
The dissociation pattern of sequence-defined PUs in the positive ion mode could be strongly modified when changing their acidic α termination into a carboxylate moiety. This H/Na (or other alkali) exchange was easily performed in solution and permitted to efficiently suppress all reactions involving the carboxylic acid α group of these polymers. Collisional activation of carboxylate-terminated PUs mainly induced cleavage of the O–(CO) bond of carbamate group present in each repeating unit, which led to the formation of two fragment series only and hence fulfilled conditions requested for full sequence coverage by MS/MS. This is another example of the “MS/MS design” approach which aims at optimizing the structure of encoded polymers to control their dissociation behavior and hence improve their sequencing. However, in contrast to previously reported cases where synthesis works were requested, changing a carboxylic acid into its carboxylate form was readily achieved in the electrosprayed solution supplemented with the appropriate alkali salts. Thank to multiple charging during ESI, PUs of increasing length were efficiently ionized in the positive ion mode and exhibited the same simple MS/MS pattern regardless of their charge state. With this new methodology in hand, production of sequence-defined polymers to store multiple bytes of information can now be envisaged.
Acknowledgments
L.C. and J.-F.L. thank the French National Research Agency (ANR project 00111001, grant numbers ANR-16-CE29-0004-01 and ANR-16-CE29-0004-02) for financial support. L.C. also acknowledges support from Spectropole, the Analytical Facility of Aix-Marseille University, by granting a special access to the instruments purchased with European Funding (FEDER OBJ2142-3341).
16
References
[1] L. Charles. Tandem mass spectrometry sequencing of controlled and sequence-defined synthetic polymers. In: Sequence controlled polymers, J.-F. Lutz, Ed. Wiley: 2018; pp 479-504.
[2] H. Colquhoun, J.-F. Lutz. Information-containing macromolecules. Nat. Chem. 6 (2014) 455-456.
[3] J.-F. Lutz. Coding Macromolecules: Inputting Information in Polymers Using Monomer-Based Alphabets. Macromolecules 48 (2015) 4759-4767.
[4] M. Rutten, R.W. Vaandrager, J. Elemans, R.J.M. Nolte. Encoding information into polymers. Nat. Rev. Chem. 2 (2018) 365-381.
[5] G.M. Church, Y. Gao, S. Kosuri. Next-generation digital information storage in DNA. Science 337 (2012) 1628-1628.
[6] C. Wesdemiotis, N. Solak, M.J. Polce, D.E. Dabney, K. Chaicharoen, B.C. Katzenmeyer, Fragmentation pathways of polymer ions. Mass Spectrom. Rev. 30 (2011) 523-559. [7] L. Charles, G. Cavallo, V. Monnier, L. Oswald, R. Szweda, J.-F. Lutz. MS/MS-Assisted
Design of Sequence-Controlled Synthetic Polymers for Improved Reading of Encoded Information. J. Am. Soc. Mass Spectrom. 28 (2017) 1149-1159.
[8] R.K. Roy, A. Meszynska, C. Laure, L. Charles, C. Verchin, J.-F. Lutz. Design and synthesis of digitally encoded polymers that can be decoded and erased. Nat. Commun. 6 (2015) 7237.
[9] U.S. Gunay, B.E. Petit, D. Karamessini, A. Al Ouahabi, J.-A. Amalian, C. Chendo, M. Bouquey, D. Gigmes, L. Charles, J.-F. Lutz. Chemoselective Synthesis of Uniform Sequence-Coded Polyurethanes and Their Use as Molecular Tags. Chem 1 (2016) 114-126.
[10] G. Cavallo, A. Al Ouahabi, L. Oswald, L. Charles, J.-F. Lutz. Orthogonal Synthesis of "Easy-to-Read" Information-Containing Polymers Using Phosphoramidite and Radical Coupling Steps. J. Am. Chem. Soc. 138 (2016) 9417-9420.
[11] J.-A. Amalian, A. Al Ouahabi, G. Cavallo, N.F. Konig, S. Poyer, J.-F. Lutz, L. Charles. Controlling the structure of sequence-defined poly(phosphodiester)s for optimal MS/MS reading of digital information. J. Mass Spectrom. 52 (2017) 788-798.
[12] A. Al Ouahabi, M. Kotera, L. Charles, J.-F. Lutz. Synthesis of Monodisperse Sequence-Coded Polymers with Chain Lengths above DP100. ACS Macro Lett. 4 (2015) 1077-1080.
17
[13] A. Al Ouahabi, J.-A. Amalian, L. Charles, J.-F. Lutz. Mass spectrometry sequencing of long digital polymers facilitated by programmed inter-byte fragmentation. Nat. Commun. 8 (2017) 967.
[14] J.-A. Amalian, S. Poyer, B.E. Petit, S. Telitel, V. Monnier, D. Karamessini, D. Gigmes, J.-F. Lutz, L. Charles. Negative mode MS/MS to read digital information encoded in sequence-defined oligo(urethane)s: A mechanistic study. Int. J. Mass Spectrom. 421 (2017) 271-278.
[15] A. Burel, C. Carapito, J.-F. Lutz, L. Charles. MS-DECODER: Milliseconds Sequencing of Coded Polymers. Macromolecules 50 (2017) 8290-8296.
[16] S. Poyer, T. Fouquet, H. Sato, J.-F. Lutz, L. Charles. Convenient graphical visualization of messages encoded in sequence-controlled synthetic polymers using Kendrick mass defect analysis of their MS/MS data. Macromol. Chem. Phys. 219 (2018) 1800173. [17] V. Mass, W. Schrepp, B. Von Vacano, H. Pasch. Sequence analysis of an isocyanate
oligomer by MALDI-TOF mass spectrometry using collision induced dissociation. Macromol. Chem. Phys. 210 (2009) 1957-1965.
[18] A.P. Gies, W.H. Heath, R.J. Keaton, J.J. Jimenez, J.J. Zupanic. MALDI-TOF/TOF CID study of polycarbodiimide branching reactions. Macromolecules 46 (2013) 7616-7637. [19] A.P. Gies, D.M. Hercules. Collision induced dissociation study of ester-based
polyurethane fragmentation reactions. Anal. Chim. Acta 808 (2014) 199-219.
[20] R.P. Lattimer. Tandem mass spectrometry of lithium-attachment ions from polyglycols. J. Am. Soc. Mass Spectrom. 3 (1992) 225-234.
[21] R.P. Lattimer. Tandem mass spectrometry of poly(ethylene glycol) lithium-attachment ions. J. Am. Soc. Mass Spectrom. 5 (1994) 1072-1080.
[22] A. Tintaru, C. Chendo, Q. Wang, S. Viel, G. Quelever, L. Peng, P. Posocco, S. Pricl, L. Charles. Conformational sensitivity of conjugated poly(ethylene oxide)-poly(amidoamine) molecules to cations adducted upon electropsray ionization. A mass spectrometry, ion mobility and molecular modelling study. Anal. Chim. Acta 808 (2014) 163-174.
[23] F.F. Hsu, J. Turk. Distinction among isomeric unsaturated fatty acids as lithiated adducts by electrospray ionization mass spectrometry using low energy collisionally activated dissociation on a triple stage quadrupole instrument. J. Am. Soc. Mass Spectrom. 10 (1999) 600-612.
[24] N. Zehethofer, D.M. Pinto, D.A. Volmer. Plasma free fatty acid profiling in a fish oil human intervention study using ultra-performance liquid chromatography/electrospray
18
ionization tandem mass spectrometry. Rapid Commun. Mass Spectrom. 22 (2008) 2125-2133.
Supporting information
S1
Promoting carboxylate salts in the ESI source to simplify positive mode
MS/MS sequencing of acid-terminated encoded polyurethanes
Salomé Poyer,1 Benoit Eric Petit,2 Sofia Telitel,2 Denise Karamessini,2 Jean-François Lutz,2* and Laurence Charles1*
1 Aix Marseille Univ, CNRS, ICR, Institut de Chimie Radicalaire, Marseille – France 2 Université de Strasbourg, CNRS, Institut Charles Sadron UPR22, Strasbourg, France
Content Page
Table S1. Structural description of PU oligomers used in this study ……….. S2 Fig. S1. ESI(–)-MS/MS of deprotonated P1 ……….………... S2 Fig. S2. ESI(–)-MS/MS of deprotonated P2 ……….………... S2 Fig. S3. Relative abundance of PUs in positive vs negative mode ESI …….……….. S3 Table S2. Accurate mass measurements of fragments of [P1+H]+ ………... S4 Fig. S4. ESI(+)-MS/MS of doubly protonated P2 ……….………... S5 Table S3. Accurate mass measurements of fragments of [P2+2H]2+ …………... S6 Fig. S5. ESI(+)-MS/MS of [P1+Alk]+, Alk=Li, K, Rb, Cs ……….………. S7 Fig. S6. ESI(+)-MS/MS of [P1–H+2Alk]+, Alk=Li, K, Rb, Cs ………….……….. S7 Table S4. Accurate mass measurements of fragments of [P1+Na]+ ………..…... S8 Fig. S7. ESI(+)-MS3 of [P1+Na]+: dissociation of w
j+ ions ……….……… S9 Fig. S8. ESI(+)-MS3 of [P1+Na]+: dissociation of y
j+ ions ……….………. S10 Scheme S1. Internal fragments of [PU–H+2Na]+ ……… S10 Fig. S9. Influence of DP on abundance of [P3+2Na]2+ and [P3–H+3Na]2+ ……….………… S11 Table S5. Accurate mass measurements of fragments of [P2–H+3Na]2°………. S12
Supporting information
S2
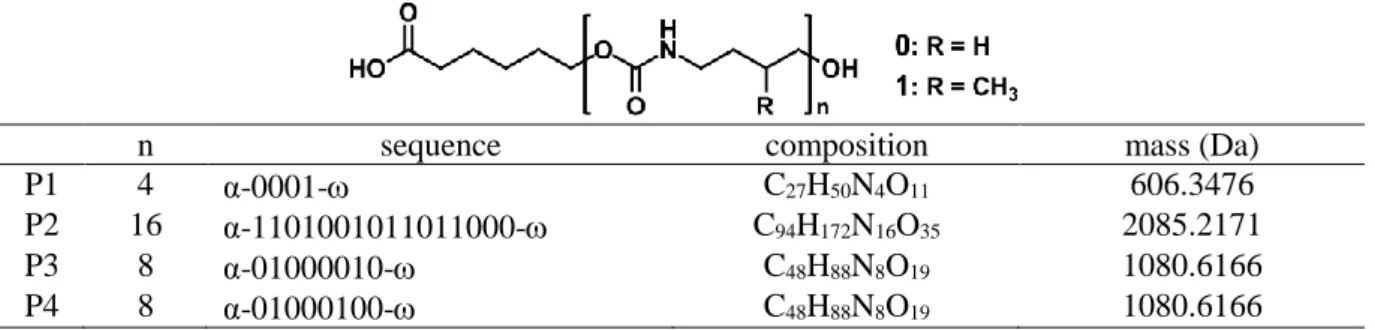
n sequence composition mass (Da)
P1 4 α-0001- C27H50N4O11 606.3476
P2 16 α-1101001011011000- C94H172N16O35 2085.2171
P3 8 α-01000010- C48H88N8O19 1080.6166
P4 8 α-01000100- C48H88N8O19 1080.6166
Table S1. Structural description of PU oligomers used in this study.
Fig. S1. ESI(–)-MS/MS of the deprotonated P1 oligomer of sequence 0001 (top structure) detected at
m/z 605.3. Activation energy is given in the center-of-mass frame. Starting from the a1– ion always detected at m/z 131.1 since this ion does not contain any coding moiety, the 0001 sequence of P1 is re-constructed from the peak-to-peak distance equal to the mass of the 0-bit (115.0 Da) or of the 1-bit (129.0 Da): Δm/z (a2–/a1–) = 115.0, Δm/z (a3–/a2–) = 115.1, Δm/z (a4–/a3–) = 115.1 and Δm/z ([PU-1 – H]–/a4–) = 129.0. This experiment was performed with the Synapt G2-HDMS mass spectrometer.
Fig. S2. ESI(–)-MS/MS of the deprotonated P2 oligomer of sequence 1101001011011000 (top structure) detected at m/z 2084.2. Activation energy is given in the center-of-mass frame. This experiment was performed with the Synapt G2-HDMS mass spectrometer.
Supporting information
S3
Fig. S3. Relative intensity of some PUs when adducted to one (black dots) or two (white dots)
sodium cations compared to deprotonated molecules obtained in the negative ion mode, as a function of their polymerization degree, n. These experiments were performed with the Synapt G2-HDMS mass spectrometer.
Supporting information
S4
before HDX after HDX
composition m/zth m/zexp composition m/zth m/zexp
α-con tai ni ng fr ag m ent s a1+ C6H13O3+ 133.0859 133.0860 C6H10D3O3+ 136.1048 136.1051 a2+ C11H22NO5+ 248.1492 248.1489 C11H18D4NO5+ 252.1744 252.1749 a3+ C16H31N2O7+ 363.2126 363.2124 C16H26D5N2O7+ 368.2440 368.2439 a4+ C21H40N3O9+ 478.2759 478.2756 C21H34D6N3O9+ 484.3136 484.3138 α1+ C6H11O2+ 115.0754 115.0755 C6H10D1O2+ 116.0816 116.0827 α2+ C11H20NO4+ 230.1387 230.1386 C11H18D2NO4+ 232.1512 232.1515 α3+ C16H29N2O6+ 345.2020 345.2020 C16H26D3N2O6+ 348.2208 348.2204 α4+ C21H38N3O8+ 460.2653 460.2651 C21H34D4N3O8+ 464.2904 464.2906 -con ta ini n g fr ag m ent s x1+ C6H12NO2+ 130.0863 130.0852 C6H10D2NO2+ 132.0988 132.1008 x2+ C11H21N2O4+ 245.1496 245.1495 C11H18D3N2O4+ 248.1684 248.1691 x3+ C16H30N3O6+ 360.2129 360.2123 C16H26D4N3O6+ 364.2380 364.2381 x4+ C21H39N4O8+ 475.2762 475.2762 C21H34D5N4O8+ 480.3076 480.3080 y1+ C5H14NO+ 104.1070 104.1068 C5H10D4NO+ 108.1321 108.1315 y2+ C10H23N2O3+ 219.1703 219.1700 C10H18D5N2O3+ 224.2017 224.2014 y3+ C15H32N3O5+ 334.2336 334.2331 C15H26D6N3O5+ 340.2713 340.2716 y4+ C20H41N4O7+ 449.2970 449.2966 C20H34D7N4O7+ 456.3409 456.3432
Table S2. Accurate mass measurement of fragments formed in CID of protonated P1 using the precursor ion (C27H51N4O11+, m/z 607.3549 before
Supporting information
S5
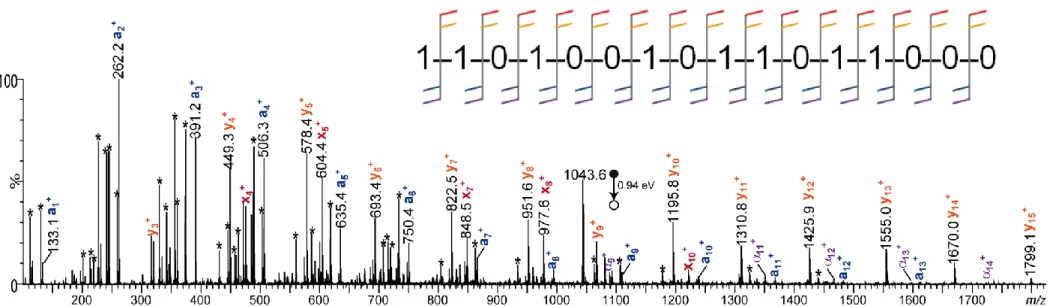
Fig. S4. ESI(+)-MS/MS of the doubly protonated P2 detected at m/z 1043.6, allowing full coverage of the 1101001011011000 sequence, as
depicted by the inset scheme. However, the sequencing task was made difficult by numerous secondary fragments (designated by asterisks) of particularly high abundance in the low m/z range of the MS/MS spectrum. All peaks were not annotated for the sake of clarity but fragments useful for sequencing are all reported in Table S3. Activation energy is given in the center-of-mass frame. This experiment was performed with the Synapt G2-HDMS mass spectrometer.
Supporting information
S6
α-containing product ions -containing product ions
aiz+ ions xiz+ ions
i composition m/zth m/zexp composition m/zth m/zexp 1 C6H13O3+ 133.0859 133.0850 C5H10NO2+ 116.0706 116.0710 2 C12H24NO5+ 262.1649 262.1658 C10H19N2O4+ 231.1339 231.1334 3 C18H35N2O7+ 391.2439 391.2432 C15H28N3O6+ 346.1973 346.1968 4 C23H44N3O9+ 506.3072 506.3080 C21H39N4O8+ 475.2762 475.2773 5 C29H55N4O11+ 635.3862 635.3874 C27H50N5O10+ 604.3552 604.3557 6 C34H64N5O13+ 750.4495 750.4488 C32H59N6O12+ 719.4185 719.4221 7 C39H73N6O15+ 865.5128 865.5103 C38H70N7O14+ 848.4975 848.4976 8 C45H84N7O17+ 994.5918 994.5902 C44H81N8O16+ 977.5765 977.5791 9 C50H93N8O19 + 1109.6552 1109.6582 C 49H90N9O18+ 1092.6398 1092.6423 C50H94N8O192+ 555.3312 555.3334 C49H91N9O182+ 546.8236 546.8214 10 C56H104N9O21 + 1238.7341 1238.7306 C 55H101N10O20+ 1221.7188 1221.7178 C56H105N9O212+ 619.8707 619.8729 C55H102N10O202+ 611.3630 611.3624 11 C62H115N10O23 + 1367.8131 1367.8116 C 60H110N11O22+ 1336.7821 1336.7800 C62H116N10O232+ 684.4102 684.4101 C60H111N11O222+ 668.8947 668.8962 12 C67H124N11O25 + 1482.8764 1482.8787 C 65H119N12O24+ 1451.8455 1451.8480 C67H125N11O252+ 741.9419 741.9420 C65H120N12O242+ 726.4264 726.4264 13 C73H135N12O27 + 1611.9554 1611.9526 C 71H130N13O26+ 1580.9244 1580.9332 C73H136N12O272+ 806.4813 806.4844 C71H131N13O262+ 790.9659 790.9698 14 C79H146N13O29 + 1741.0344 1741.0328 C 76H139N14O28+ 1695.9878 1695.9958 C79H147N13O292+ 871.0208 871.0197 C76H140N14O282+ 848.4975 848.4976 15 C84H156N14O312+ 928.5525 928.5551 C82H151N15O302+ 913.0370 913.0364 16 C89H165N15O332+ 986.0842 986.0862 C88H162N16O322+ 977.5765 977.5791 αiz+ ions yiz+ ions 1 C6H11O2+ 115.0754 115.0763 C4H12NO+ 90.0913 90.0913 2 C12H22NO4+ 244.1543 244.1539 C9H21N2O3+ 205.1547 205.1541 3 C18H33N2O6+ 373.2333 373.2327 C14H30N3O5+ 320.218 320.2183 4 C23H42N3O8+ 488.2966 488.2977 C20H41N4O7+ 449.297 449.2979 5 C29H53N4O10+ 617.3756 617.3787 C26H52N5O9+ 578.376 578.3771 6 C34H62N5O12+ 732.4389 732.4427 C31H61N6O11+ 693.4393 693.4413 7 C39H71N6O14+ 847.5023 847.5001 C37H72N7O13+ 822.5183 822.5180 8 C45H82N7O16+ 976.5813 976.5745 C43H83N8O15+ 951.5972 951.5962 9 C50H91N8O18 + 1091.6446 1091.6497 C 48H92N9O17+ 1066.6606 1066.6587 C50H92N8O182+ 546.3259 546.3278 C48H93N9O172+ 533.8339 533.8307 10 C56H102N9O20 + 1220.7236 1220.7241 C 54H103N10O19+ 1195.7395 1195.7408 C56H103N9O202+ 610.8654 610.8681 C54H104N10O192+ 598.3734 598.3763 11 C62H113N10O22 + 1349.8025 1349.8071 C 59H112N11O21+ 1310.8029 1310.8035 C62H114N10O222+ 675.4049 675.4178 C59H113N11O212+ 655.9051 655.8975 12 C67H122N11O24 + 1464.8659 1464.8668 C 64H121N12O23+ 1425.8662 1425.8635 C67H123N11O242+ 732.9366 732.9335 C64H122N12O232+ 713.4367 713.4415 13 C73H133N12O26 + 1593.9449 1593.9575 C 70H132N13O25+ 1554.9452 1554.9419 C73H134N12O262+ 797.4761 797.4739 C70H133N13O252+ 777.9762 777.9720 14 C79H144N13O28 + 1723.0238 1723.0527 C 75H141N14O27+ 1670.0085 1670.0164 C79H145N13O282+ 862.0156 862.0173 C75H142N14O272+ 835.5079 835.5067 15 C84H154N14O302+ 919.5472 919.5516 C81H153N15O292+ 900.0474 900.0472 16 C89H163N15O322+ 977.0789 977.0735 C87H164N16O312+ 964.5869 964.5881
Table S3. Accurate mass measurement of fragments formed in CID of [P2 + 2H]2+ (Figure S4) and used to recover the 1101001011011000 sequence, using the precursor ion (C94H174N16O352+, m/z 1043.6158) as an internal standard.
Supporting information
S7
Fig. S5. ESI(+)-MS/MS of P1 when adducted with (a) Li+ at m/z 613.4, (b) K+ at m/z 645.3, (c) Rb+ at m/z 691.3 and (d) Cs+ at m/z 739.3. Activation energies are given in the center-of-mass frame. Peaks annotated in grey correspond to secondary fragments. These experiments were performed with the Synapt G2-HDMS mass spectrometer.
Fig S6. ESI(+)-MS/MS of (a) [P1 – H +2Li]+ at m/z 619.4, (b) [P1 – H +2K]+ at m/z 683.3, (c) [P1 – H +2Rb]+ at m/z 775.2 and (d) [P1 – H +2Cs]+ at m/z 871.2. Activation energies are given in the center-of-mass frame. Peaks annotated in grey correspond to secondary fragments. These experiments were performed with the Synapt G2-HDMS mass spectrometer.
Supporting information
S8
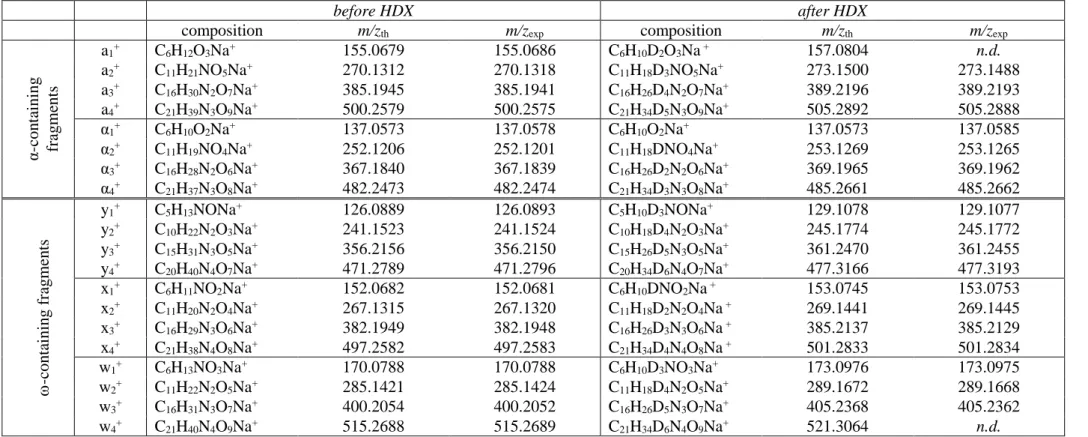
before HDX after HDX
composition m/zth m/zexp composition m/zth m/zexp
α-con tai ni ng fr ag m ent s a1+ C6H12O3Na+ 155.0679 155.0686 C6H10D2O3Na + 157.0804 n.d. a2+ C11H21NO5Na+ 270.1312 270.1318 C11H18D3NO5Na+ 273.1500 273.1488 a3+ C16H30N2O7Na+ 385.1945 385.1941 C16H26D4N2O7Na+ 389.2196 389.2193 a4+ C21H39N3O9Na+ 500.2579 500.2575 C21H34D5N3O9Na+ 505.2892 505.2888 α1+ C6H10O2Na+ 137.0573 137.0578 C6H10O2Na+ 137.0573 137.0585 α2+ C11H19NO4Na+ 252.1206 252.1201 C11H18DNO4Na+ 253.1269 253.1265 α3+ C16H28N2O6Na+ 367.1840 367.1839 C16H26D2N2O6Na+ 369.1965 369.1962 α4+ C21H37N3O8Na+ 482.2473 482.2474 C21H34D3N3O8Na+ 485.2661 485.2662 -con ta ini n g f rag m en ts y1+ C5H13NONa+ 126.0889 126.0893 C5H10D3NONa+ 129.1078 129.1077 y2+ C10H22N2O3Na+ 241.1523 241.1524 C10H18D4N2O3Na+ 245.1774 245.1772 y3+ C15H31N3O5Na+ 356.2156 356.2150 C15H26D5N3O5Na+ 361.2470 361.2455 y4+ C20H40N4O7Na+ 471.2789 471.2796 C20H34D6N4O7Na+ 477.3166 477.3193 x1+ C6H11NO2Na+ 152.0682 152.0681 C6H10DNO2Na + 153.0745 153.0753 x2+ C11H20N2O4Na+ 267.1315 267.1320 C11H18D2N2O4Na + 269.1441 269.1445 x3+ C16H29N3O6Na+ 382.1949 382.1948 C16H26D3N3O6Na + 385.2137 385.2129 x4+ C21H38N4O8Na+ 497.2582 497.2583 C21H34D4N4O8Na + 501.2833 501.2834 w1+ C6H13NO3Na+ 170.0788 170.0788 C6H10D3NO3Na+ 173.0976 173.0975 w2+ C11H22N2O5Na+ 285.1421 285.1424 C11H18D4N2O5Na+ 289.1672 289.1668 w3+ C16H31N3O7Na+ 400.2054 400.2052 C16H26D5N3O7Na+ 405.2368 405.2362 w4+ C21H40N4O9Na+ 515.2688 515.2689 C21H34D6N4O9Na+ 521.3064 n.d.
Table S4. Accurate mass measurement of fragments formed in CID of sodiated P1 using the precursor ion (C27H50N4O11Na+, m/z 629.3368
Supporting information
S9
Fig. S7. MS3 experiments performed for [P1 + Na]+ at m/z 629.3, showing that consecutive dissociation of wj+ fragments (in pink) at (a) m/z 515.3 (w4+), (b) m/z 400.2 (w3+) and (c) m/z
285.1 (w2+) led to wj-1+ lower congeners as well as yj+ ions (in orange) and xj-1+ ions (in red).
Supporting information
S10
Fig. S8. MS3 experiments showing that (a) dissociation of yj+ produced from for [P1 + H]+ at
m/z 607.4 mainly led to yj-1+, whereas (b) yj+ produced from [P1 + Na]+ at m/z 629.3 required
highly energetic activation to generate wj-1+ (in pink) and, to a lower extent, xj-1+ (in red) and
yj-1+ (in orange) ions. These experiments were performed with the QTrap 3200 mass
spectrometer.
Scheme S1. Mechanism proposed to account for internal fragments generated upon CID of
Supporting information
S11
Fig. S9. Influence of the declustering potential (DP) on the abundance of [P3 + 2Na]2+ at m/z
563.3 (in blue) and of [P3 – H +3Na]2+ at m/z 574.3 (in green). Error bars as standard deviation of 3 replicates. These experiments were performed with the Synapt G2-HDMS mass spectrometer.
Supporting information
S12
aiz+ ions xjz+ ions
composition m/zth m/zexp i↓ P2 j↑ m/zexp m/zth composition
C6H11O3Na2+ 177.0498 177.0486 1 α C12H22NO5Na2+ 306.1288 306.1263 2 1 16 999.5544 999.5585 C88H160N16O32Na22+ C18H33N2O7Na2+ 435.2078 435.2040 3 1 15 935.0143 935.0190 C82H149N15O30Na22+ C23H42N3O9Na2+ 550.2711 550.2673 4 0 14 870.4756 870.4795 C76H138N14O28Na22+ C29H53N4O11Na2+ 679.3501 679.3465 5 1 13 812.9430 812.9478 C71H129N13O26Na22+ C34H62N5O13Na2+ 794.4134 794.4096 6 0 12 1473.8174 1473.8274 C65H118N12O24Na+ C39H71N6O15Na2+ 909.4767 909.4727 7 0 11 1358.7594 1358.7641 C60H109N11O22Na+ C45H82N7O17Na2+ 1038.5557 1038.5612 8 1 10 1243.6989 1243.7008 C55H100N10O20Na+ C50H91N8O19Na2+ 1153.6190 1153.6168 9 0 9 1114.6183 1114.6218 C49H89N9O18Na+ C56H102N9O21Na2+ 1282.6980 1282.7000 10 1 8 999.5544 999.5585 C44H80N8O16Na+ C62H113N10O23Na32+ 717.3831 717.3796 11 1 7 870.4756 870.4795 C38H69N7O14Na+ C67H122N11O25Na32+ 774.9148 774.9111 12 0 6 741.3952 741.4005 C32H58N6O12Na+ C73H133N12O27Na32+ 839.4543 839.4505 13 1 5 626.3334 626.3372 C27H49N5O10Na+ C79H144N13O29Na32+ 903.9938 903.9894 14 1 4 497.2544 497.2582 C21H38N4O8Na+ C84H153N14O31Na32+ 961.5254 961.5212 15 0 3 368.1763 368.1792 C15H27N3O6Na+ C89H162N15O33Na32+ 1019.0571 1019.0555 16 0 2 253.1169 253.1159 C10H18N2O4Na+ - - - n.e. 0 1 n.d. 138.0525 C5H9NO2Na+
Table S5. Accurate mass measurement of aiz+ and xjz+ fragments formed in CID of [P2 – H +3Na]2+ (Figure 3) using the precursor ion
(C94H171N16O35Na32+, m/z 1076.5887) as an internal standard. Sequence of P2 is 1101001011011000, with 0: C5H9NO2 and 1: C6H11NO2. N.e.:
![Fig. 1. ESI-MS/MS spectra of (a) [P1 + H] + at m/z 607.4 (X=H), (b) [P1 + Na] + at m/z 629.3 (X=H) and (c) [P1 – H + 2Na] + at m/z 651.3 (X=Na)](https://thumb-eu.123doks.com/thumbv2/123doknet/14654075.552312/8.892.98.796.299.763/fig-esi-ms-ms-spectra-na-na-na.webp)
![Fig. 3. (a) ESI(+)-MS/MS of [P2 – H + 3Na] 2+ at m/z 1076.6, using a 1.45 eV activation energy (center-of-mass frame)](https://thumb-eu.123doks.com/thumbv2/123doknet/14654075.552312/15.892.116.792.357.955/fig-esi-using-activation-energy-center-mass-frame.webp)


![Fig S6. ESI(+)-MS/MS of (a) [P1 – H +2Li] + at m/z 619.4, (b) [P1 – H +2K] + at m/z 683.3, (c) [P1 – H +2Rb] + at m/z 775.2 and (d) [P1 – H +2Cs] + at m/z 871.2](https://thumb-eu.123doks.com/thumbv2/123doknet/14654075.552312/26.892.106.791.617.1141/fig-s-esi-ms-ms-li-rb-cs.webp)
![Fig. S7. MS 3 experiments performed for [P1 + Na] + at m/z 629.3, showing that consecutive dissociation of w j + fragments (in pink) at (a) m/z 515.3 (w 4 + ), (b) m/z 400.2 (w 3 + ) and (c) m/z 285.1 (w 2 + ) led to w j-1 + lower congeners](https://thumb-eu.123doks.com/thumbv2/123doknet/14654075.552312/28.892.113.788.84.923/experiments-performed-showing-consecutive-dissociation-fragments-lower-congeners.webp)
![Fig. S8. MS 3 experiments showing that (a) dissociation of y j + produced from for [P1 + H] + at m/z 607.4 mainly led to y j-1 + , whereas (b) y j + produced from [P1 + Na] + at m/z 629.3 required highly energetic activation to generate w j-1 + (in](https://thumb-eu.123doks.com/thumbv2/123doknet/14654075.552312/29.892.106.788.102.639/experiments-dissociation-produced-produced-required-energetic-activation-generate.webp)
