3rdInternational Conference on Bio-Based Building Materials
June 26th - 28th 2019
Belfast, UK
ID_ II239
ADHESION AND RHEOLOGY OF FRESH MORTAR JOINTS:
EFFECTS OF ORGANIC ADDITIONS
R. Bouras1, C. Si Hadj Mohand 2, M. Sonnebi 2
1 Laboratoire de Modélisation Expérimentale et Numérique des Matériaux et Structure en Génie
CivilUniversity Mouloud Mammeri of TiziOuzou, Algeria
2 Department of Mechanical Engineering, University Bouira
1 School of Natural and Built Environment, Queens University Belfast, Belfast, BT7 5AG, UK
*Corresponding author; e-mail: r_bouras@yahoo.fr
Abstract
An adhesive mortar in fresh state is considered as a granular suspension in a complex fluid. The study of the rheological behavior of such materials involves the rheology of complex fluids, including granular suspensions, colloidal dispersions, etc... To characterize the rheological behavior of an adhesive mortar, in quasi-static regime, we use a three-parameter behavior law that includes a yield stress, a viscosity coefficient and a fluidity index. The adhesiveness of the mortar can be characterized by identifying the evolution of the adhesive force, the cohesive force and the adherence force. The mortar characteristics are measured by a commercial rheometer from Texas Instruments (TA). In this study, we use a plane-plane geometry for the Probe Tack Test to determine the adhesiveness of the materials. The rheological property of the mortar is investigated using the Vane-Cylinder geometry. The mechanisms of separation and rupture in a tensile material confined between two parallel plates are studied theoretically and experimentally. This study is conducted for a materials selected for his rheological behavior (Herschel Buckley). We studied the rheological behavior and the influence of additions of organic additives on the rheological parameters intrinsic to the material, and the failure mechanisms. This study has allowed us to observe the different types of rupture.
Keywords:
Rheology, adhesion, cohesion, tack test
1 INTRODUCTION
The pressure sensitive adhesive (PSA) materials bond to a surface instantly by applying pressure as, for example, the scotch tape. The tack of a material is its ability to adhere to a surface instantly. For an adhesive to be effective, it must be liquid to wet, and strong to maintain some restraint once the bonds are formed. These two opposite properties imply that the adhesive must be viscoelastic materials. The properties of tack adhesive are difficult to predict. They depend on the rheological properties of the material especially at high strain rate, the surfaces on which the material is deposited and the technique of measure. Under these conditions, many studies have been made to explain some behavior in the field of membership. This study identifies the failure mechanisms that may occur in case of a viscoelastic material with yield stress type Herschel Buckley (mortar). The cement mortars have a Newtonian behavior with viscoelastic behavior and a flow threshold. We seek to identify the occurrence of failure mechanisms that may occur during the pullout process. The tear test (probe tack test) is often used to characterize the adhesion of different material properties. This test was used to study the adhesion
properties of soft materials such as adhesive polymers [1-5]. The accession of these materials based copolymers involves two phenomena: cavitation and viscoelastic dissipation. For an adhesive to be effective, it must be liquid to wet at the surface when the bond is formed and strong in order to maintain a certain level of stress during the pullout process [6-7]. Recently, the adhesive properties of pastes minerals (clay mud) [8] and granular materials (adhesive mortars without fibers) [9] have been studied using this. Tile adhesive mortar is used to bond the bottom of the tile to a surface called the setting bed. In recent years, the improvements in adhesives mortar make it easier for people to lay tile themselves, without contracting the job out to a professional. There are numerous types of tile adhesives (ceramic, wall, porcelain, granite, etc.) and each has a specific application. Different types of additives are added if required for special performance. This mortar fulfill technical requirements such as good
workability characteristics, good water-retention
capability, long open time, etc. After curing, the mortar must provide good adhesive and cohesive bond strength. However, to the best of our knowledge, the measurement of adhesive property is often performed in plastic and hardened state.
2 ADHESIVE, COHESIVE AND ADHERENCE FORCE
Figure 1 represents the typical shape of the force curves (stretching force versus instantaneous gap thickness) obtained in the tack tests. The force first increases (zone 1), passes through a maximum Fmax and then decreases (zone 2) reaching finally a plateau (zone 3). In zone 1 the mortar displays mainly elastic and then visco-elastic behaviours. The force peak determines the adhesive strength of the material. In zone 2 one has irreversible rupture and inward flow of the sample towards the plates centre. Analysis of the force decay in this zone allows characterizing rupture dynamics of the mortar. Zone 3 starts as soon as the rupture process is completed. The average value of the force plateau is related to the amount of material remained stuck onto the mobile plate. This gives the adherence strength of the mortar relative to the surface of this plate. The cohesion force is the value of the force peak when the velocity tends to zero (Figure 1b).
Fig. 1: Analysis of the tack test results. (a) General shape of the tack force curves; (b) evolution of the
force peak versus stretching velocity.
3 MATERIALS AND EXPERIMENTAL SETUP 3.1 Material
The mortar formulation is chosen depending on the objectives of the study. However, in general, the constituents of the mortar include cement and/or lime, sand, and admixtures. The admixtures can be a combination of several types of polymers. The binder comprises cement type Lafarge NA442 CEM II/B-L 42.5 N.
We use standard sand CEN EN 196-1 ISO 679 in order to minimize phase separation. The CEN standard sand (sand ISO standard) is natural sand, silica especially in its finer fractions.
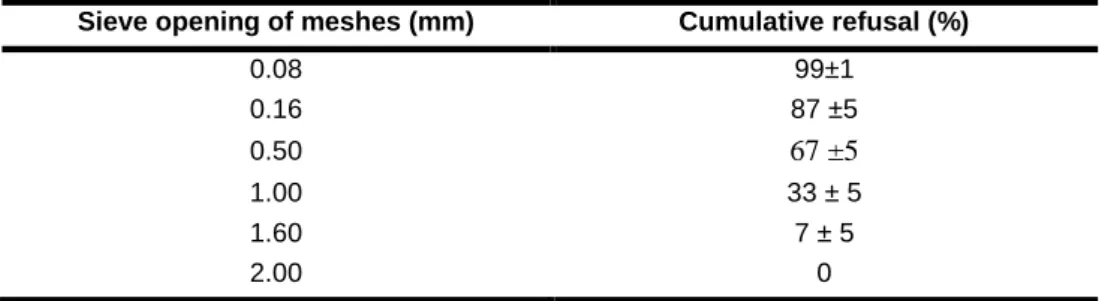
It is clean; the grains are isometric and rounded shape generally. It is dried, screened and prepared in a modern workshop with all guarantees of quality and consistency. Table 1 shows its particle size determines by sieving complies with standards EN 196-1 and ISO 679.
It indicates that the cumulative refusal of the sand remaining on the sieve size of 1.6 mm is 7 ‒ 5 %, whereas the remaining sand on the sieve size of 2 mm is 0 %. This explains the choice of the tested mortar layer that the taken thickness must be sufficient for the mortar to flow during the experiments. It is chosen 3 mm in tack tests and 8 mm in rheological measurements.
Methocel (from Dow Chemicals company) is used as thickeners, binders, film formers, and water-retention agents. In this ARTICLE, we have investigated the fresh state properties of mortar using a particular type with the trade name “ Methocel 10-0353 ”. The typical viscosity of it in a certain condition of (Brookfield RVT, 20 rpm, 20°C, 2% in water) is 15.000 mPa.s. This is advised to use for base plaster, absorbent substrate and decorative render by the producer. Methocel helps increasing the workability and the consistency of the used mortar.
3.2 Mixture
The adhesive mortars are mainly composed of cement, sand and organic additives (Cellulose ether). These materials are used in practice as thin joints to bind construction blocks (bricks, stones, etc.) together or to fix tiles on horizontal or vertical surfaces. The
following table gives the composition of the material used.
3.3 Equipment
In our study, we have used a rheometer, a mixer and two balances for investigating the properties of mortar in fresh state. To measure rheological properties of mortars, flow tests were performed using a high accuracy rheometer (a rheometer model AR2000ex from TA) It includes an ultra-low inertia drag cup motor a porous carbon air bearings for controlling stress, direct strain and controlled rate performance. The high resolution optimal encoder and high stiffness low inertia design make the AR2000ex extremely versatile and appropriate for a wide variety of applications including characterization of delicate structures in fluids of any viscosity, polymer melts, solids and reactive materials. This rheometer is capable of continuous shear rate sweep, stress sweep strain sweep torque, angular velocity sweep and other parameters.
3.4 Procedure
To determine the mortar failure modes, we used the test probe tack. It is was developed by Hammond in 1964 [10] to test "POLYKEN probe tack" to characterize its adhesive properties. After this technic has been largely employed during formulation of polymer pastes [11,12], subsequently, several improvements were made by Zosel [13]. More recently, to investigate the normal force and possible failure modes of smectite muds [8]. However, to the best of our knowledge, few authors had performed the pull-off test for the cases of fresh mortar. This method allows dissociating several aspects of practical interest, related to adhesive properties of fresh mortar, including cohesion, adhesion and interface adherence [9]. The probe tack test usually takes place in three stages (see figure 2):
1- The mortar pastes are inserted between two parallel plates with rough surfaces (to minimize wall-slippage) and squeezed out at a given velocity Va (500
reach an initial gap thickness of 3 mm (see Figure 2b) or until the upper plate exerts a nominal contact force Fc. The diameter of the mortar sample (the same than the upper plate) is 40 mm. Since the initial gap thickness is much smaller than the diameter of the sample, one can assume that, at least in the beginning of the stretching test, the flow is a priori dominated
2- Relaxation In order to erase eventual memory effects, the material is let to relax for tc (in our case tc = 3 min)
before starting the tack test. This step is conventionally carried out either at constant displacement (the displacement of the movable platen stops when F = Fc) or Fc constant strength.
3- Pulling: The upper plate is moved away at a constant speed V.
By varying the parameters V (from 10 to 1000m/s) and the percentage of the polymer (from 0,22% to 0,44% by weight) independently of each other at in each step, the force and the position of the movable platen with respect to time is measured.
Fig. 2: Experimental tack curve obtained during the probe tack experiment with plane geometry. In this test, two geometries are used, the portion of the mobile plate in contact with the material can be planar or spherical. It keeps the parallelism between the top plate the material and the confinement of the sample. These can influence the type of failure mechanisms occurring during the pulling process [17]. For very soft or viscoelastic materials, the choice of a planar geometry is preferred. In fact, the stress distribution is relatively uniform with this geometry at the contact, the deformation of the material during the separation is fairly homogeneous and understanding of the mechanism of fracture is facilitated.
4 RESEARCH RESULTS
4.1 Determination of the rheological properties
The rheological properties of the mortars are determined using the same rheometer equipped with a 4-blades vane geometry. Vane geometry is recognized to be suitable for granular pastes like mortars since with this system wall-slippage is minimized (the material is sheared in volume) [17-18]. The gap thickness (distance between the periphery of the vane tool and the outer cylinder) is 8.3 mm, which is more than an order of magnitude higher than the maximum size of the grains (0.5 mm). Then, the measurements may not be sensitive to the discrete aspect of the mortar composition. On the other hand, since the gap thickness is not sufficiently smaller than the vane tool diameter, the variation of the shear rate and shear stress throughout the gap space cannot be neglected. Therefore the fundamental rheological quantities cannot be determined straightforwardly from the measured torque and the rotational velocity of the vane tool. A calibration method, which is described in details in [19], is then used. 80 160 240 320 400 480 560 640 2 4 6 8 10 0.055 % 0.11 % 0.22 % 0.33 % 0.44 % Str es s ( Pa ) shear rate (s-1)
Fig 3: Flow curves of the mortars for different polymer concentrations.
Figure 3 represents the flow curves of the mortar pastes for different polymer concentrations.
For low polymer concentrations (0.055% and 0.11%) the pastes display essentially a plastic-like behaviour. That is: below a certain value of the applied stress (yield stress) the paste responds elastically (zero shear rate), once this value is exceeded the stress becomes independent upon the shear-rate. Such behaviour is akin to that of a dry granular media.
Fig. 4: Evolution of the stretching force versus time for different velocities (in m/s) for the 0.22% polymer
paste.
Figure 4, represents in a semi-logarithmic scale the evolution of the stretching force versus time (or instantaneous gap thickness) for different velocities and respectively for 0,22% of polymer. In contrast to other types of materials, PSAs [1, 2] polymer solutions [14,6] and even Newtonian fluids [18], the overall behaviour of the stretching force is quite simple The curves rise, passé through a maximum and monotonically decrease to zero. The tackiness of the pastes can be characterized by two different parameters that can be inferred from the force curves. The maximum value Fmax reached by the force (referred to hereafter as the adhesive force) and the characteristic time (d) of the
debonding process.
The curve of the tack presents the change force tack during pulling step. It can be defined by the raw coordinates, the force versus time, or by using the standard parameters. The stress is defined as the value of the force divided by the actual contact surface, or alternatively, by the total area of the punch surface (S), and the displacement (h) as the product of time by the
0 0.5 1 1.5 2 2.5 100 101 102 103 104 10 30 50 100 200 500 1000 Time (s) Compression at a speed of Step 2: Compression of the
Step 3: relaxation Step 4: stretching Stretching with a
speed separation (Figure 4). The strength of tack (F) is defined as the maximum force curve. When the separation is complete, at t2, the measured force is zero
and the displacement corresponding to hb is maximal.
The integral of the area under the curve of force versus time represents the energy of tack, W, the energy required for the separation system. This curve is used to quantify the properties of tack through values F and W.
The energy needed for completing the pull-off test is calculated by the following equation:
(1) ) ( ) ( ) ( 2 m S N F Pa (2) Where hband haare respectively the gap distance at the beginning and that at the finishing of the separation process. It can be rewritten as:
1 2 ) ( t t Fvdt J W (3) Where v is the separation velocity and F is the recorded normal force during the separation process which starts at t1and lasts for (t2-t1)(second). The moment of t2corresponds to the finishing of the separating process. Figure 5 represents the calculation of the adhesive failure energy in experiment. In general, it is determined by the area formed by the force curve obtained in the test and the horizontal axis.
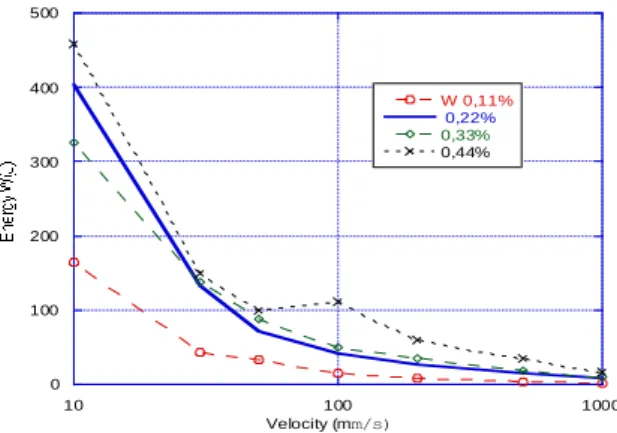
Fig. 5: Tack curve. Determination F and W Figure 6 represents the calculation of the failure energy for different polymer concentrations. We notice that the more traction and speed are applied, the greater the energy required to tear is large. The failure mode in this case is failure cavitations.
We also observe that the higher the % of incorporated polymer, the higher the energy is important. The failure mode in this case is without cavitations.
Fig. 8: Evolution of the energy needed to pull versus the velocity for different polymer concentrations
5 CONCLUSION
Modeling the behavior of mortars during the separation is based on the fundamental relationship Wc / E (or Wc/G '), where Wc is the critical energy value above which the separation takes place by crack propagation and E (or G ') is the elastic modulus of the adhesive (in the frequency biasing of the adhesive),. tThe ratio Wc / E quantifies the relationship between the energy dissipated at the interface and the elastic energy stored in the volume of the adhesive mortar. Comparing the curves of tack and separation mechanisms leads to the following conclusions:
- When Wc / E is low, the energy crack Wc is low and is reached before the critical stress cavitations
this case, the separation process is exclusively interfacial without cavitations process figure 6b. - When Wc / E is high, the cavities formed in the growing volume of the adhesive until reaching of very large deformations by fibrillation, in which case, the rupture is adhesive and the measured tack energy is high
- Wc / E intermediate, stress cavitations is reached in the volume of the adhesive, the cavitations process is used to dissipate the energy of deformation and competes with the crack formed. When the energy exceeds the value of Wc, the cavity walls stand quickly and there is interfacial fracture figure 6a.
- Wc / E very high, the same phenomena are observed previously, however fibrillation continues to very large deformations, the rupture is cohesive figure 6a. Thus, the values of Wc and E (or G ') predict the shape of the curve tack and the separating mechanism of the adhesive. The three steps are: formation of crack or cavitations, followed by the fibrillation process and finally cohesive or adhesive failure.
6 REFERENCES
[1] H. Lakrout, P. Sergot and C. Creton, « Direct observation of cavitation and fibrillation in a probe tack experiment on model acrylic pressure-sensitive adhesives », J. Adhesion 69, 307-359 (1999)
[2] D. Derks, A. Lindner, C. Creton and D. Bonn, « Cohesive failure of thin layers of soft model adhesives under tension », J. Appl. Phys. 93, 1557-1566 (2003) [3] R Bouras, A Kaci, M Chaouche« Relationship Between the Rheological and the Adhesive Properties
Time (or displacement)
0 100 200 300 400 500 10 100 1000 W 0,11% 0,22% 0,33% 0,44% Velocity (mm/s) b a b a h h dh h m S h h Fdh J W( ) ( 2) ( )
of Cementitious Pastes ». AIP Conference Proceedings 1027 (1), 809-811 (2008)
[4] Hammond, F. H. Jr., « Tack. Advances in Pressure Sensitive Adhesive Technology », D. Satas, ed., Satas& Associates, Warwick, RI, 32-49, (1982).
[5] Zosel, A.,« Fracture Energy and Tack. in Advances in Pressure Sensitive Adhesive Technology » - 1,D. Satas, ed., Satas& Associates, Warwick, RI, pp. 92-127, (1992).
[6] Lindner, D. Derks and J.M. Shelly, « Stretch flow of thin layers of Newtonian liquids: fingering patterns and lifting forces », Phys. Fluids 17, paper 072107 (2005) [7] Zosel, A, « The Effect of Bond Formation on the Tack of Polymers ». Journal of Adhesion Science and Technology, 11, 1447-1457, (1997).
[8] S Kawashima, M Chaouche, DJ Corr, SP Shah« Influence of purified attapulgite clays on the adhesive properties of cement pastes as measured by the tack test » Cement and Concrete Composites 48, 35-41 (2014).
[9] A. Kaci, R. Bouras, M. Chaouche, P-A. Anderiani and H. Brossas « Adhesive and rheological properties of mortar joints» Appl. Rheol. 19 (2009) 51970
[10] J. Chopin, R. Villey, D. Yarusso, E. Barthel, C. Creton, M. Ciccotti« Nonlinear Viscoelastic Modeling of Adhesive Failure for Polyacrylate Pressure-Sensitive Adhesives » Macromolecules American Chemical Society (2018)
[11] C. Creton, L. Leibler. « How does tack depend on time of contact and contact pressure? » Journal of Polymer Science: Part B: Polymer Physics, 34:545-554,1996
[12] A. Zosel « Adhesion and Tack of Polymers: Influence of Mechanical Properties and Surface
Tensions » Colloid. polymer Scince. Vol. 263, pp. 541-553, 1985.
[13] JingyiGuo, Mincong Liu, Alan T Zehnder, Jingwen Zhao, Tetsuhara Narita, CostantinoCreton, Chung-Yuen Hui « Fracture mechanics of a self-healing hydrogel with covalent and physical crosslinks: A numerical study » , Journal of the Mechanics and Physics of Solids (2018)
[14] H. LakroutSergeot P., C. Creton « Direct observation of cavitation and fibrillation in a probe tack experiment on model acrylic pressure-sensitive adhesives » J. Adhesion 69, 307-359, 1999.
[15] Tordjman Ph. E. Papon, villenave JJ, « Tack properties of pressure-sensitive adhesives » J. polymer. Sci. Part B polymer. Phys. 38 1201-1208, 2000. [16] Portigliatti M., H. Hervet Light L. « Nanotack test: adhesive behavior of single latex particles » C.R. Acad. Sci. Paris, t 01, Series IV, 1187-1196, 2000
[17] Crosby, shull KR Lakrout H., C. Creton, « Deformation and failure modes of adhesives bonded elastic layers » j. appl., physic 88. 5. 2956-2966 (2000) [18] E. Bauer, J.G.G. de Sousa, E. A. Guimarães and F. G. S. Silva. « Study of the laboratory Vane test on mortars» Building and Environment, 42 (1), pp. 86-92, (2007).
[19] J.R. Stokes and J.H. Telford. «Measuring the yield behaviour of structured fluids » Journal of Non-Newtonian Fluid Mechanics. 124, pp. 137-146 (2004). [20] M. Bousmina, A. Ait-Kadi and J.B. Faisant, «Determination of shear rate and viscosity from batch mixer data » Journal of Rheology, 43, pp. 415-433 (1999)
[21] J. Teisseire « Tack de matériaux modèles » Ph.D. Thesis (in French), Université de Bordeaux, 2006. Table 1: The size distribution of standard sand.
Table 2: Proportion of constituents of the joint mortar.
Constituent Cement Sand Cellulose Ether Water
% (by Weight) 30 70 Varied 0,22 to 0,44 30
Sieve opening of meshes (mm) Cumulative refusal (%)
0.08 99±1 0.16 87 ±5 0.50 67 ±5 1.00 33 ± 5 1.60 7 ± 5 2.00 0