HAL Id: hal-00328438
https://hal.archives-ouvertes.fr/hal-00328438
Submitted on 30 May 2006
HAL is a multi-disciplinary open access
archive for the deposit and dissemination of
sci-entific research documents, whether they are
pub-lished or not. The documents may come from
teaching and research institutions in France or
abroad, or from public or private research centers.
L’archive ouverte pluridisciplinaire HAL, est
destinée au dépôt et à la diffusion de documents
scientifiques de niveau recherche, publiés ou non,
émanant des établissements d’enseignement et de
recherche français ou étrangers, des laboratoires
publics ou privés.
during the August 2003 heat wave as seen from
CHIMERE model simulations and POLDER data
A. Hodzic, R. Vautard, H. Chepfer, P. Goloub, L. Menut, P. Chazette, J. L.
Deuzé, A. Apituley, P. Couvert
To cite this version:
A. Hodzic, R. Vautard, H. Chepfer, P. Goloub, L. Menut, et al.. Evolution of aerosol optical
thick-ness over Europe during the August 2003 heat wave as seen from CHIMERE model simulations and
POLDER data. Atmospheric Chemistry and Physics, European Geosciences Union, 2006, 6 (7),
pp.1853-1864. �10.5194/acp-6-1853-2006�. �hal-00328438�
Atmos. Chem. Phys., 6, 1853–1864, 2006 www.atmos-chem-phys.net/6/1853/2006/ © Author(s) 2006. This work is licensed under a Creative Commons License.
Atmospheric
Chemistry
and Physics
Evolution of aerosol optical thickness over Europe during the
August 2003 heat wave as seen from CHIMERE model simulations
and POLDER data
A. Hodzic1, R. Vautard1, H. Chepfer1, P. Goloub2, L. Menut1, P. Chazette3, J. L. Deuz´e2, A. Apituley4, and P. Couvert3 1Laboratoire de M´et´eorologie Dynamique, Institut Pierre-Simon Laplace, Palaiseau, France.
2Laboratoire d’Optique Atmosph´erique, Lille, France.
3Laboratoire des Sciences du Climat et de l’Environnement, Institut Pierre-Simon Laplace, Gif sur Yvette, France. 4National Institute of Public Health and the Environment, The Netherlands.
Received: 16 February 2005 – Published in Atmos. Chem. Phys. Discuss.: 27 June 2005 Revised: 21 February 2006 – Accepted: 15 March 2006 – Published: 30 May 2006
Abstract. This study describes the atmospheric aerosol load encountered during the large-scale pollution episode that oc-curred in August 2003, by means of the aerosol optical thicknesses (AOTs) measured at 865 nm by the Polarization and Directionality of the Earth’s Reflectances (POLDER) sensor and the simulation by the CHIMERE chemistry-transport model. During this period many processes (stag-nation, photochemistry, forest fires) led to unusually high particle concentrations and optical thicknesses. The ob-served/simulated AOT comparison helps understanding the ability of the model to reproduce most of the gross AOT features observed in satellite data, with a general agreement within a factor 2 and correlations in the 0.4–0.6 range. How-ever some important aerosol features are missed when using regular anthropogenic sources. Additional simulations in-cluding emissions and high-altitude transport of smoke from wildfires that occurred in Portugal indicate that these pro-cesses could dominate the AOT signal in some areas. Our results also highlight the difficulties of comparing simulated and POLDER-derived AOTs due to large uncertainties in both cases. Observed AOT values are significantly lower than the simulated ones (30–50%). Their comparison with the ground-based Sun photometer Aerosol Robotic Network (AERONET) measurements suggests, for the European sites considered here, an underestimation of POLDER-derived aerosol levels with a factor between 1 and 2. AERONET AOTs compare better with simulations (no particular bias) than POLDER AOTs.
Correspondence to: A. Hodzic
(hodzic@lmd.polytechnique.fr)
1 Introduction
During the first half of August 2003 a severe heat wave hit Western and Central Europe (Rasool et al., 2004). The per-sistent anticyclonic conditions characterized by exception-ally high temperatures were favorable to the development of a large-scale photochemical pollution episode (Vautard et al., 2005). The stagnation of the air mass also led to the accu-mulation of the primary emitted particulate matter (PM) and the development of secondary aerosols. Furthermore, in con-junction with the dry, hot weather conditions, the Southern part of Europe was influenced by significant forest fires that generated a huge amount of primary particles.
Modeling such a wide pollution episode is a challenging problem because models have to deal with an exceptional environment for which their parameterizations are not neces-sarily appropriate. For instance the formulation of classical models of dry gaseous deposition or biogenic emissions do not generally account for the exceptional deficit in soil wa-ter. When using standard anthropogenic emission inventories chemistry-transport models (CTMs) probably underestimate the evaporation of anthropogenic non-methane volatile or-ganic compounds due to extremely high temperatures. For aerosols the drought increases the erodibility of soils and fa-vors forest fires, phenomena which are generally not taken into account in an accurate manner in these standard emis-sions. Therefore in such extreme weather conditions there is a large degree of uncertainty in aerosol sources and phys-ical parameterizations, leading to significant difficulties for CTMs to simulate the aerosol distribution and there is a strong need for the models to be tested against observations in such cases.
The use of satellite measurements to assess model perfor-mance in simulating aerosol spatial distributions at regional scale offers a great advantage due to their wide spatial
age. Long-term comparisons between satellite retrieved and model simulated aerosol optical properties have already been performed using global scale models in several studies (Chin et al., 2002; Yu et al., 2003; Matsui et al., 2004), but such a comparison has not been carried out at regional scale, with a much higher spatial resolution (typically 4–8 times).
The retrieval of aerosol optical thickness from satellite measurements has been attempted several times (Kaufman et al., 2002). Depending on the measurement technique the aerosol detection is often restricted to specific regions or types of aerosols. In the first studies, the aerosol re-mote sensing was performed using a single wavelength and single angle of observation sensors, such as AVHRR (Ad-vanced Very High Resolution Radiometer), METEOSAT and GOES (Geostationary Operational Environmental Satellite). Measurements performed by the TOMS (Total Ozone Map-ping Spectrometer) instrument were based on two wave-lengths and allowed the monitoring of the transport of ele-vated smoke or dust layers. However, the detection by TOMS of the aerosol load over several regions known to be highly polluted was limited (Chiapello et al., 2000; Tanr´e et al., 2001). The POLDER (Polarization and Directionality of the Earth’s Reflectances, Deschamps et al., 1994) sensor was the first instrument designed for the aerosol monitoring over land and ocean (Herman et al., 1997). The measurement tech-nique is based on the combination of two spectral channels as well as the observation of the state of polarization of the light when reflected by atmosphere and ground. Despite this recent progress in remote sensing of aerosols, quantitative retrieval of aerosol loads above land surfaces remains chal-lenging because the aerosol signature is small compared to the surface reflectivity. 1 (1997) and POLDER-2 (POLDER-2003) collected respectively 8 and 7 months of observa-tions and a new generation satellite instrument (PARASOL) was successfully launched in fall 2004. Other recent sensors, such as ATSR and MODIS (Moderate-resolution Imaging Spectroradiometer) are also producing maps of aerosols (Re-mer et al., 2002); even if the time overlap between those mis-sions is still insufficient, inter-comparisons between aerosols properties derived from these different missions (Goloub and Arino 2000; King et al., 1999; Myhre et al., 2004) allowed improvements of aerosol retrievals. In comparison to other sensors, POLDER takes advantage of light polarization to detect fine aerosols over the land.
The aim of this study is threefold. First of all we de-scribe the aerosol optical depth evolution during the Au-gust 2003 heat wave, using the POLDER sensor measure-ments and simulations from the CHIMERE (Schmidt et al., 2001; Bessagnet et al., 2004) regional CTM. Second the intercomparison between POLDER optical depth, sim-ulated optical depth, and the equivalent values obtained by Sun photometers belonging to the AErosol RObotic NET-work (AERONET) (Holben et al., 1998) helps validating the CHIMERE model, which contains a detailed aerosol for-mulation (Bessagnet et al., 2004), and helps
understand-ing its main deficiencies and the gaps in our knowledge about aerosol processes. Finally this intercomparison also helps understanding problems present in the satellite mea-surements and in the algorithms used to derive the atmo-sphere’s content properties.
In the following sections, data sets issued from both satellite and ground-based measurements are presented, and the AOT retrieval methods are described (Sect. 2). The CHIMERE model description and simulations are presented in Sect. 3. The comparison results between model and satel-lite data are discussed in Sect. 4 and finally, the origins of the model discrepancies are identified. Section 5 contains our conclusions.
2 Aerosol data and retrieval methods
Measurements used in this study are retrieved from both POLDER remote sensing and AERONET ground-based measurements.
2.1 POLDER data and retrieval methods
The POLDER instrument on board the ADvanced Earth Ob-servation Satellite (ADEOS-2) was operational for 7 months between April and October 2003 (Deschamps et al., 1994). The sensor is a wide field of view imaging radiometer that provides simultaneous measurements of spectral, directional and polarized radiance in the visible domain over land and ocean with a local overpass time around 10:30 a.m. over Europe. The retrieval of aerosol optical properties from POLDER-2 is different over ocean and land surfaces. Over the ocean, the inversion scheme uses the spectral variability of the total radiances between the 865 and 670 nm channels (Deuz´e et al., 2000). Over land, where the surface contri-bution to the total radiance is generally large, aerosol re-trieval is based on a best fit between measured polarized radiances and those simulated for different aerosol types (varying aerosol algorithm and optical thickness) and sur-face conditions (Herman et al., 1997; Leroy et al., 1997; Deuz´e et al., 2001). As the largest particles generate low polarization (Li et al., 2004), only the optical characteris-tics of the accumulation mode (radius<0.6 µm) are derived. Thus, coarse or non spherical particles, such as desert dust are not detected by the POLDER sensor because they po-larize the natural light 5–10 times less than anthropogenic aerosols in the scattering angles used for the retrieval. A lognormal size distribution is assumed and the aerosol re-fractive index is fixed to m=1.47–0.01i based on climatology (i.e, single scattering albedo ranging from 0.85 to 0.95 de-pending on the size distribution). Over land surfaces (ex-cept for desert regions), considering all AERONET sites available during the global validation exercise, departure be-tween satellite and ground-based accumulation aerosol opti-cal thickness has been shown to be less than 20–30% when
A. Hodzic et al.: Satellite observed VS model simulated AOTs over Europe 1855
18
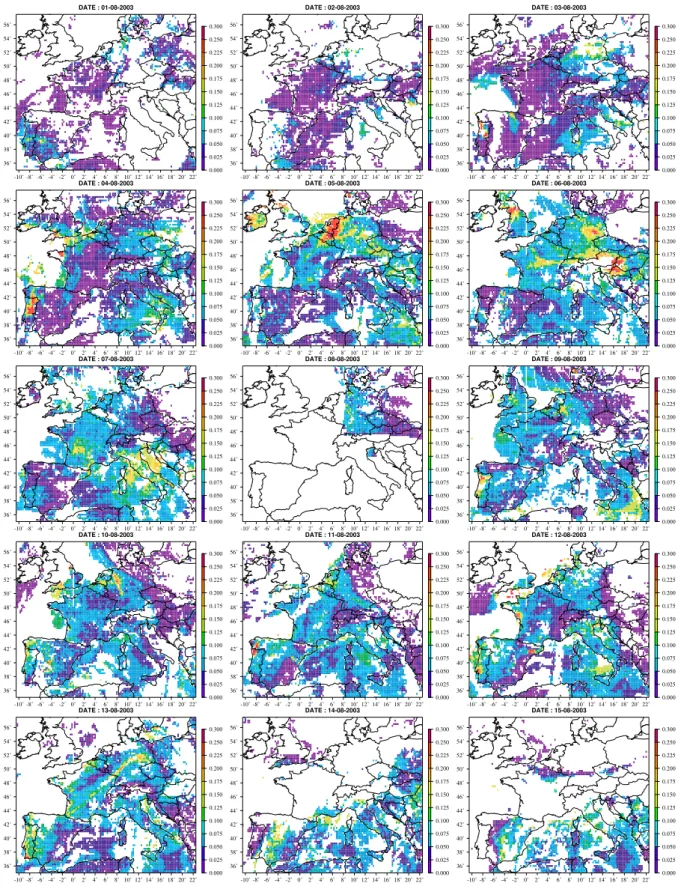
-10˚ -8˚ -6˚ -4˚ -2˚ 0˚ 2˚ 4˚ 6˚ 8˚ 10˚ 12˚ 14˚ 16˚ 18˚ 20˚ 22˚ 36˚ 38˚ 40˚ 42˚ 44˚ 46˚ 48˚ 50˚ 52˚ 54˚ 56˚ 0.000 0.025 0.050 0.075 0.100 0.125 0.150 0.175 0.200 0.225 0.250 0.300 DATE : 01-08-2003 -10˚ -8˚ -6˚ -4˚ -2˚ 0˚ 2˚ 4˚ 6˚ 8˚ 10˚ 12˚ 14˚ 16˚ 18˚ 20˚ 22˚ 36˚ 38˚ 40˚ 42˚ 44˚ 46˚ 48˚ 50˚ 52˚ 54˚ 56˚ 0.000 0.025 0.050 0.075 0.100 0.125 0.150 0.175 0.200 0.225 0.250 0.300 DATE : 02-08-2003 -10˚ -8˚ -6˚ -4˚ -2˚ 0˚ 2˚ 4˚ 6˚ 8˚ 10˚ 12˚ 14˚ 16˚ 18˚ 20˚ 22˚ 36˚ 38˚ 40˚ 42˚ 44˚ 46˚ 48˚ 50˚ 52˚ 54˚ 56˚ 0.000 0.025 0.050 0.075 0.100 0.125 0.150 0.175 0.200 0.225 0.250 0.300 DATE : 03-08-2003 -10˚ -8˚ -6˚ -4˚ -2˚ 0˚ 2˚ 4˚ 6˚ 8˚ 10˚ 12˚ 14˚ 16˚ 18˚ 20˚ 22˚ 36˚ 38˚ 40˚ 42˚ 44˚ 46˚ 48˚ 50˚ 52˚ 54˚ 56˚ 0.000 0.025 0.050 0.075 0.100 0.125 0.150 0.175 0.200 0.225 0.250 0.300 DATE : 04-08-2003 -10˚ -8˚ -6˚ -4˚ -2˚ 0˚ 2˚ 4˚ 6˚ 8˚ 10˚ 12˚ 14˚ 16˚ 18˚ 20˚ 22˚ 36˚ 38˚ 40˚ 42˚ 44˚ 46˚ 48˚ 50˚ 52˚ 54˚ 56˚ 0.000 0.025 0.050 0.075 0.100 0.125 0.150 0.175 0.200 0.225 0.250 0.300 DATE : 05-08-2003 -10˚ -8˚ -6˚ -4˚ -2˚ 0˚ 2˚ 4˚ 6˚ 8˚ 10˚ 12˚ 14˚ 16˚ 18˚ 20˚ 22˚ 36˚ 38˚ 40˚ 42˚ 44˚ 46˚ 48˚ 50˚ 52˚ 54˚ 56˚ 0.000 0.025 0.050 0.075 0.100 0.125 0.150 0.175 0.200 0.225 0.250 0.300 DATE : 06-08-2003 -10˚ -8˚ -6˚ -4˚ -2˚ 0˚ 2˚ 4˚ 6˚ 8˚ 10˚ 12˚ 14˚ 16˚ 18˚ 20˚ 22˚ 36˚ 38˚ 40˚ 42˚ 44˚ 46˚ 48˚ 50˚ 52˚ 54˚ 56˚ 0.000 0.025 0.050 0.075 0.100 0.125 0.150 0.175 0.200 0.225 0.250 0.300 DATE : 07-08-2003 -10˚ -8˚ -6˚ -4˚ -2˚ 0˚ 2˚ 4˚ 6˚ 8˚ 10˚ 12˚ 14˚ 16˚ 18˚ 20˚ 22˚ 36˚ 38˚ 40˚ 42˚ 44˚ 46˚ 48˚ 50˚ 52˚ 54˚ 56˚ 0.000 0.025 0.050 0.075 0.100 0.125 0.150 0.175 0.200 0.225 0.250 0.300 DATE : 08-08-2003 -10˚ -8˚ -6˚ -4˚ -2˚ 0˚ 2˚ 4˚ 6˚ 8˚ 10˚ 12˚ 14˚ 16˚ 18˚ 20˚ 22˚ 36˚ 38˚ 40˚ 42˚ 44˚ 46˚ 48˚ 50˚ 52˚ 54˚ 56˚ 0.000 0.025 0.050 0.075 0.100 0.125 0.150 0.175 0.200 0.225 0.250 0.300 DATE : 09-08-2003 -10˚ -8˚ -6˚ -4˚ -2˚ 0˚ 2˚ 4˚ 6˚ 8˚ 10˚ 12˚ 14˚ 16˚ 18˚ 20˚ 22˚ 36˚ 38˚ 40˚ 42˚ 44˚ 46˚ 48˚ 50˚ 52˚ 54˚ 56˚ 0.000 0.025 0.050 0.075 0.100 0.125 0.150 0.175 0.200 0.225 0.250 0.300 DATE : 10-08-2003 -10˚ -8˚ -6˚ -4˚ -2˚ 0˚ 2˚ 4˚ 6˚ 8˚ 10˚ 12˚ 14˚ 16˚ 18˚ 20˚ 22˚ 36˚ 38˚ 40˚ 42˚ 44˚ 46˚ 48˚ 50˚ 52˚ 54˚ 56˚ 0.000 0.025 0.050 0.075 0.100 0.125 0.150 0.175 0.200 0.225 0.250 0.300 DATE : 11-08-2003 -10˚ -8˚ -6˚ -4˚ -2˚ 0˚ 2˚ 4˚ 6˚ 8˚ 10˚ 12˚ 14˚ 16˚ 18˚ 20˚ 22˚ 36˚ 38˚ 40˚ 42˚ 44˚ 46˚ 48˚ 50˚ 52˚ 54˚ 56˚ 0.000 0.025 0.050 0.075 0.100 0.125 0.150 0.175 0.200 0.225 0.250 0.300 DATE : 12-08-2003 -10˚ -8˚ -6˚ -4˚ -2˚ 0˚ 2˚ 4˚ 6˚ 8˚ 10˚ 12˚ 14˚ 16˚ 18˚ 20˚ 22˚ 36˚ 38˚ 40˚ 42˚ 44˚ 46˚ 48˚ 50˚ 52˚ 54˚ 56˚ 0.000 0.025 0.050 0.075 0.100 0.125 0.150 0.175 0.200 0.225 0.250 0.300 DATE : 13-08-2003 -10˚ -8˚ -6˚ -4˚ -2˚ 0˚ 2˚ 4˚ 6˚ 8˚ 10˚ 12˚ 14˚ 16˚ 18˚ 20˚ 22˚ 36˚ 38˚ 40˚ 42˚ 44˚ 46˚ 48˚ 50˚ 52˚ 54˚ 56˚ 0.000 0.025 0.050 0.075 0.100 0.125 0.150 0.175 0.200 0.225 0.250 0.300 DATE : 14-08-2003 -10˚ -8˚ -6˚ -4˚ -2˚ 0˚ 2˚ 4˚ 6˚ 8˚ 10˚ 12˚ 14˚ 16˚ 18˚ 20˚ 22˚ 36˚ 38˚ 40˚ 42˚ 44˚ 46˚ 48˚ 50˚ 52˚ 54˚ 56˚ 0.000 0.025 0.050 0.075 0.100 0.125 0.150 0.175 0.200 0.225 0.250 0.300 DATE : 15-08-2003Figure 1 : Fine-mode Aerosol Optical Thickness obtained from POLDER-2 data at 865 nm during the August 2003 heat wave episode (from 1 to 15 August).
Fig. 1. Fine-mode Aerosol Optical Thickness obtained from POLDER-2 data at 865 nm during the August 2003 heat wave episode (from 1
to 15 August).
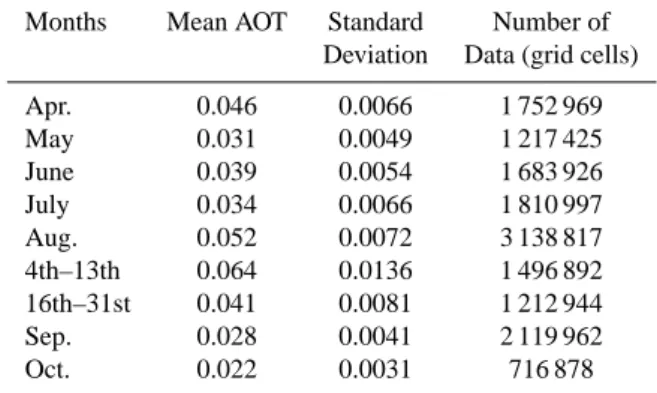
Table 1. POLDER-2 mean AOT values from April to October 2003.
Months Mean AOT Standard Number of Deviation Data (grid cells) Apr. 0.046 0.0066 1 752 969 May 0.031 0.0049 1 217 425 June 0.039 0.0054 1 683 926 July 0.034 0.0066 1 810 997 Aug. 0.052 0.0072 3 138 817 4th–13th 0.064 0.0136 1 496 892 16th–31st 0.041 0.0081 1 212 944 Sep. 0.028 0.0041 2 119 962 Oct. 0.022 0.0031 716 878
medium and high anthropogenic or biomass burning aerosol loadings are considered. Discrepancies could reach 100% and more when small AOT occurs simultaneously with inac-curate surface modelling. Over the ocean, the retrieval errors of the accumulation aerosol optical thickness are less than 15% when corresponding optical thickness exceeds 0.08 at 670 nm.
In this study, we use the POLDER Level-2 AOT data at 865 nm and Angstr¨om exponent coefficients derived from AOT at 670 and 865 nm, corresponding to aerosol fine mode (radius less than 0.6 µm) and including anthropogenic aerosols, smoke and dust fine fraction. Data are cloud screened. Finally, for all model/observation comparisons, we average POLDER data over each cell of the CHIMERE re-gional 0.5◦×0.5◦longitude-latitude grid.
2.2 AERONET ground-based measurements
The aerosol optical depth is also measured by ground-based CIMEL Sun photometers in the AErosol RObotic NETwork (AERONET; Holben et al., 1998). For comparisons with model and POLDER data, AOT data at 870 nm correspond-ing to the POLDER overpass and to clear-sky conditions according to the POLDER cloud mask, have been selected in the AERONET database at 14 European monitoring sites (see Fig. 7b). As for the POLDER data, the AERONET mea-surements retained for the comparison only account for the aerosol fine mode.
3 Model simulations
3.1 General configuration
In this study atmospheric aerosols are simulated using a re-gional version of the chemistry-transport model CHIMERE that calculates the concentrations of both inorganic and or-ganic aerosols of primary and secondary origin, including primary particulate matter, mineral dust, sulfate, nitrate,
am-monium, secondary organic species and water. The aerosol population is represented using a sectional size distribution considering 11 size bins geometrically spaced from 10 nm to 20 µm diameter and particles internally mixed in each size section. Detailed description of the model configuration and performances over Europe are presented in previous studies (Bessagnet et al., 2004; Vautard et al., 2005). The simulation domain covers Western Europe, with a 0.5 degree horizon-tal resolution and 14 vertical sigma-pressure levels extending up to 500 hPa. The model inputs, including meteorological fields, anthropogenic emissions and boundary conditions are identical to those used in Vautard et al. (2005). The simu-lations are performed from 25 July to 15 August 2003, with a prior 5 day initialization spin-up run. For the comparison, the model outputs are taken at 11:00 UTC, corresponding to the satellite overpass time over Europe, and only when the cloud screened POLDER data are available.
3.2 Aerosol optical thickness simulation
The aerosol optical properties are estimated from model out-puts following the method described in Hodzic et al. (2004). All aerosols contributing to the optical thickness are assumed to be accounted for by the model. Given the simulated aerosol size distribution and mass concentrations, the aerosol optical thickness is calculated using the Mie-theory extinc-tion coefficients depending on the aerosol refractive indexes and their hygroscopic properties.
As in POLDER data retrieval, the refractive index is fixed to m=1.47–0.01i and only particles smaller than 0.6 µm in radius are considered. Since the refractive index depends on the aerosol composition and relative humidity (Hanel, 1976), a sensitivity study was performed in order to evaluate the impact of this assumption on AOT values: Varying the re-fractive index during our study period, characterized by dry atmospheric conditions, the simulated AOT values changed by less than 1%.
4 Results and discussion
4.1 Description of the August 2003 AOT episode from POLDER data
The August 2003 pollution episode was characterized by ex-ceptionally high aerosol optical thicknesses over Europe as-sociated with high aerosol AOTs. The episode was particu-larly well captured by POLDER-2 instrument due to cloud-less atmospheric conditions during this heatwave. Figure 1 shows the spatio-temporal evolution of the POLDER-derived AOTs over Europe from 1 to 15 August. The exceptionally wide spatial extent of this episode and the progressive ac-cumulation of the aerosol load are clearly illustrated. The “background” AOTs increase from low values (<0.025) at the beginning of the episode (1–5 August) to higher values (0.05–0.075) from 6 to 13 August (Fig. 1). Several AOT
A. Hodzic et al.: Satellite observed VS model simulated AOTs over Europe 1857
19
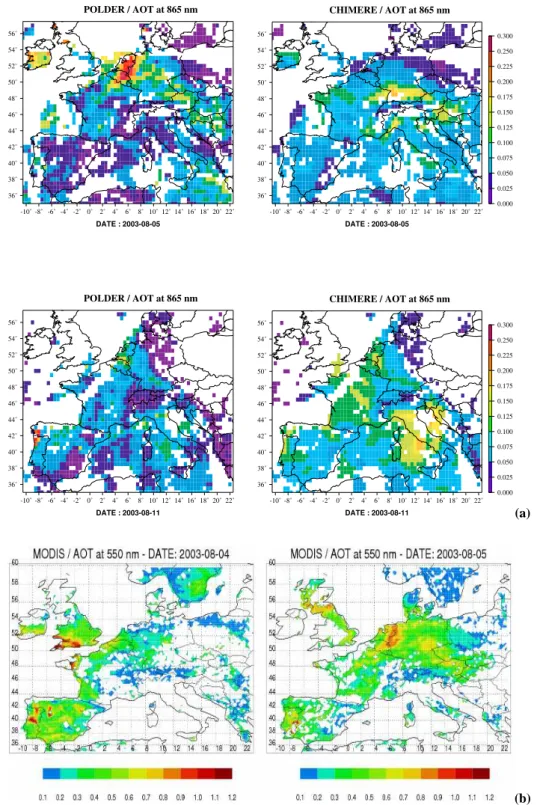
-10˚ -8˚ -6˚ -4˚ -2˚ 0˚ 2˚ 4˚ 6˚ 8˚ 10˚ 12˚ 14˚ 16˚ 18˚ 20˚ 22˚ 36˚ 38˚ 40˚ 42˚ 44˚ 46˚ 48˚ 50˚ 52˚ 54˚ 56˚ POLDER / AOT at 865 nm DATE : 2003-08-05 -10˚ -8˚ -6˚ -4˚ -2˚ 0˚ 2˚ 4˚ 6˚ 8˚ 10˚ 12˚ 14˚ 16˚ 18˚ 20˚ 22˚ 36˚ 38˚ 40˚ 42˚ 44˚ 46˚ 48˚ 50˚ 52˚ 54˚ 56˚ 0.000 0.025 0.050 0.075 0.100 0.125 0.150 0.175 0.200 0.225 0.250 0.300 CHIMERE / AOT at 865 nm DATE : 2003-08-05 -10˚ -8˚ -6˚ -4˚ -2˚ 0˚ 2˚ 4˚ 6˚ 8˚ 10˚ 12˚ 14˚ 16˚ 18˚ 20˚ 22˚ 36˚ 38˚ 40˚ 42˚ 44˚ 46˚ 48˚ 50˚ 52˚ 54˚ 56˚ POLDER / AOT at 865 nm DATE : 2003-08-11 -10˚ -8˚ -6˚ -4˚ -2˚ 0˚ 2˚ 4˚ 6˚ 8˚ 10˚ 12˚ 14˚ 16˚ 18˚ 20˚ 22˚ 36˚ 38˚ 40˚ 42˚ 44˚ 46˚ 48˚ 50˚ 52˚ 54˚ 56˚ 0.000 0.025 0.050 0.075 0.100 0.125 0.150 0.175 0.200 0.225 0.250 0.300 CHIMERE / AOT at 865 nm DATE : 2003-08-11Figure 2a: Geographic distribution of the fine mode aerosol optical thickness at 865 nm retrieved from the POLDER data (left) and simulated by CHIMERE model (right) over Europe on 05 and 11 August 2003. POLDER data are averaged to the grid cell of CHIMERE (0.5x0.5 degree).
Figure 2b: Geographic distribution of the aerosol optical thickness at 550 nm retrieved from the MODIS sensor over Europe on 04 and 05 August 2003. MODIS data account for both fine and coarse mode aerosols and are represented with 0.25x0.25 degree resolution.
(a)
19
-10˚ -8˚ -6˚ -4˚ -2˚ 0˚ 2˚ 4˚ 6˚ 8˚ 10˚ 12˚ 14˚ 16˚ 18˚ 20˚ 22˚ 36˚ 38˚ 40˚ 42˚ 44˚ 46˚ 48˚ 50˚ 52˚ 54˚ 56˚ POLDER / AOT at 865 nm DATE : 2003-08-05 -10˚ -8˚ -6˚ -4˚ -2˚ 0˚ 2˚ 4˚ 6˚ 8˚ 10˚ 12˚ 14˚ 16˚ 18˚ 20˚ 22˚ 36˚ 38˚ 40˚ 42˚ 44˚ 46˚ 48˚ 50˚ 52˚ 54˚ 56˚ 0.000 0.025 0.050 0.075 0.100 0.125 0.150 0.175 0.200 0.225 0.250 0.300 CHIMERE / AOT at 865 nm DATE : 2003-08-05 -10˚ -8˚ -6˚ -4˚ -2˚ 0˚ 2˚ 4˚ 6˚ 8˚ 10˚ 12˚ 14˚ 16˚ 18˚ 20˚ 22˚ 36˚ 38˚ 40˚ 42˚ 44˚ 46˚ 48˚ 50˚ 52˚ 54˚ 56˚ POLDER / AOT at 865 nm DATE : 2003-08-11 -10˚ -8˚ -6˚ -4˚ -2˚ 0˚ 2˚ 4˚ 6˚ 8˚ 10˚ 12˚ 14˚ 16˚ 18˚ 20˚ 22˚ 36˚ 38˚ 40˚ 42˚ 44˚ 46˚ 48˚ 50˚ 52˚ 54˚ 56˚ 0.000 0.025 0.050 0.075 0.100 0.125 0.150 0.175 0.200 0.225 0.250 0.300 CHIMERE / AOT at 865 nm DATE : 2003-08-11Figure 2a: Geographic distribution of the fine mode aerosol optical thickness at 865 nm retrieved from the
POLDER data (left) and simulated by CHIMERE model (right) over Europe on 05 and 11 August 2003.
POLDER data are averaged to the grid cell of CHIMERE (0.5x0.5 degree).
Figure 2b: Geographic distribution of the aerosol optical thickness at 550 nm retrieved from the MODIS sensor
over Europe on 04 and 05 August 2003. MODIS data account for both fine and coarse mode aerosols and are
represented with 0.25x0.25 degree resolution.
(b)
Fig. 2. (a) Geographic distribution of the fine mode aerosol optical thickness at 865 nm retrieved from the POLDER data (left) and simulated
by CHIMERE model (right) over Europe on 5 and 11 August 2003. POLDER data are averaged to the grid cell of CHIMERE (0.5×0.5 degree). (b) Geographic distribution of the aerosol optical thickness at 550 nm retrieved from the MODIS sensor over Europe on 4 and 5 August 2003. MODIS data account for both fine and coarse mode aerosols and are represented with 0.25×0.25 degree resolution.
peaks (>0.25) could be noticed, especially on 3 and 4 Au-gust over Portugal and on 5 AuAu-gust over The Netherlands
(Fig. 2). This last AOT peak moves towards Eastern and Southern Germany on 6 August, and probably towards Italy
on 7 August. The episode ends on 14–15 August with the arrival of a weather system and rainy weather conditions.
The exceptional nature of this heat wave period in terms of aerosol optical thicknesses can be judged by comparing AOTs with the other summer-time data from the POLDER-2 instrument. The mean AOT values from April to October over Europe are summarized in Table 1. The mean AOT ob-served from 4 to 13 August reaches 0.064 and is a factor of 2 higher than AOTs obtained during other summer months. 4.2 Cases of 5 and 11 August
We now examine in greater detail two interesting cases, 5 and 11 August. Figure 2a shows the spatial distribution of the aerosol optical thickness at 865 nm as observed by POLDER and simulated by CHIMERE model over Europe for these two days. In these figures POLDER data are averaged over the exact CHIMERE grid cells in order to facilitate compari-son. On both days, POLDER AOTs exhibit more spatial vari-ability than model simulations, with important AOT peaks (>0.25) over The Netherlands or Ireland on 5 August and over Portugal on 11 August, and generally very low values (<0.05) over southern Spain. The model AOTs are more ho-mogeneous and generally higher (0.05–0.2). On 5 August the simulated AOT map is fairly different from the observed one, while on 11 August the simulated and POLDER spatial structures are similar, with maxima over the Ruhr, southern Germany, central France, Portugal and off the southern Ital-ian coast. However in both cases the simulated “background” AOTs are about twice as large as the POLDER satellite re-trievals. On the contrary the 5 August high AOTs values are absent in the simulated AOT which is five times smaller, both in amplitude and spatial structure. Missed patches of high AOTs are also present on 4 and 6 August. The comparison with MODIS data shown in Fig. 2b also confirms the pres-ence of high AOT values (>0.9 at 550 nm) over Northern Europe on 4–5 August, showing that these features are real and must be understood.
4.3 Statistical comparisons
We now examine the results of the comparisons between sim-ulated and observed AOTs in a statistical manner. Problems revealed by Fig. 2a are quite general, as suggested by Fig. 3, which shows daily model and observed spatial AOT averages and the spatial correlation between the two fields during the heat wave period. The analysis is also performed over spe-cific regions. According to Fig. 3a, half of observed AOT data over Europe ranges from 0.025 to 0.08, with a mean AOT of 0.06, while model AOTs vary from 0.05 to 0.1, with mean AOT greater than 0.08. The model overestimates the mean AOT values by about 30% and the spatial correlation reaches 0.4. The time variability is fairly well reproduced by the model during the episode with an increase of AOT values due to the accumulation of the aerosol load.
Two periods can be distinguished: the period from 3 to 6 August when model and observations have similar mean AOT values, but poor correlation coefficients (less than 0.3); and the period after 7 August characterized by higher cor-relations (0.4–0.6) and a model positive offset of 30–50%. Furthermore, the separate comparisons over ocean (Fig. 3b) and land (Fig. 3c) surfaces give similar results about average AOTs. This indicates at least that the land surface and ocean AOT retrieval algorithms are consistent in terms of average AOTs. However the spatial correlations between modeled and observed data are significantly higher over the ocean than over land, in a nearly systematic manner. This could be due to a higher uncertainty in the POLDER retrieval over land (Deuz´e et al., 2001) discussed in next section.
In order to define European areas with similar behavior in terms of model/observation comparisons, we calculate the spatial distribution of correlation coefficients obtained be-tween observed and simulated AOTs. This correlation is now calculated as a time correlation for 1.5◦×1.5◦grid cells, each containing nine model grid points. The correlation distribu-tion is shown in Fig. 4. The spatial heterogeneity of correla-tion coefficients shows the regions where major inconsisten-cies between model and satellite data are expected. Lower correlations (<0.3) are found over the Benelux countries, the North of Portugal and the Eastern Mediterranean where gen-erally higher AOT values are observed.
The quantitative comparison performed over the regions highlighted in Fig. 4 is shown in Figs. 3d–f. Again two dis-tinct problems are identified: i) the general positive differ-ence between model and POLDER AOTs during the whole comparison period and over all regions, and ii) the inability of the model to simulate the AOT peaks observed on 5–6 Au-gust over Northern Europe and 3 April 2005 over Portugal. Over Mediterranean areas the model exhibits a generally pos-itive bias as compared to POLDER. It must be noticed that our results are not affected by the presence (or the absence) of Saharan dust particles, as the associated aerosol particles are mostly in the coarse mode while the AOT thickness discussed here only account for aerosols in the fine mode. Therefore the relatively low correlations over this area cannot be due to the difficulty in simulating Saharan dust. We now give tentative explanations for these problems.
4.4 On the origin of the systematic difference between model and POLDER data
The systematic difference between average model and ob-served AOTs suggests that either the model significantly overestimates the aerosol load in these regions, or the POLDER retrievals underestimate the background aerosol levels due to uncertainties in the aerosol retrieval algorithms. In order to answer this question, we intercompare model and observations coming from POLDER and AERONET only when and where these data are simultaneously avail-able during the heat wave event. Results are summarized in
A. Hodzic et al.: Satellite observed VS model simulated AOTs over Europe 1859
20
01 02 03 04 05 06 07 08 09 10 11 12 13 14 15TOT August 2003 0 0.05 0.1 0.15 0.2 0.25 AOT at 865 nm a) Europe AOT POLDER AOT CHIMERE 0 0.2 0.4 0.6 0.8 1 Correlation coefficient 01 02 03 04 05 06 07 08 09 10 11 12 13 14 15TOT August 2003 0 0.05 0.1 0.15 0.2 0.25 AOT at 865 nm b) Ocean AOT POLDER AOT CHIMERE 0 0.2 0.4 0.6 0.8 1 Correlation coefficient 01 02 03 04 05 06 07 08 09 10 11 12 13 14 15TOT August 2003 0 0.05 0.1 0.15 0.2 0.25 AOT at 865 nm c) Land AOT POLDER AOT CHIMERE 0 0.2 0.4 0.6 0.8 1 Correlation coefficient 01 02 03 04 05 06 07 08 09 10 11 12 13 14 15TOT August 2003 0 0.05 0.1 0.15 0.2 0.25 AOT at 865 nm d) Mediterranean Basin AOT POLDER AOT CHIMERE 0 0.2 0.4 0.6 0.8 1 Correlation coefficient 01 02 03 04 05 06 07 08 09 10 11 12 13 14 15TOT August 2003 0 0.05 0.1 0.15 0.2 0.25 AOT at 865 nm e) Northern Europe AOT POLDER AOT CHIMERE 0 0.2 0.4 0.6 0.8 1 Correlation coefficient 01 02 03 04 05 06 07 08 09 10 11 12 13 14 15TOT August 2003 0 0.05 0.1 0.15 0.2 0.25 AOT at 865 nm f) Portugal AOT POLDER AOT CHIMERE 0 0.2 0.4 0.6 0.8 1 Correlation coefficientFigure 3 : Comparison of simulated vs. satellite retrieved spatial mean AOT at 865 nm and spatial correlation (a) over the whole European model domain; (b) over ocean only; (c) over land only; (d) over Mediterranean basin; (e) over Northern Europe and (f) over Portugal. These regions are defined in Figure 4. The intervals represent 25 and 75 percentiles. Correlation coefficients are indicated by triangles.
-10˚ -8˚ -6˚ -4˚ -2˚ 0˚ 2˚ 4˚ 6˚ 8˚ 10˚ 12˚ 14˚ 16˚ 18˚ 20˚ 22˚ 36˚ 38˚ 40˚ 42˚ 44˚ 46˚ 48˚ 50˚ 52˚ 54˚ 56˚ 0.0 0.1 0.2 0.3 0.4 0.5 0.6 0.7 0.8 0.9 1.0
Figure 4 : Time correlations between simulated and POLDER retrieved AOT across Europe during the summer 2003 heat wave (from 1 to 15 August 2003).
Fig. 3. Comparison of simulated vs. satellite retrieved spatial mean AOT at 865 nm and spatial correlation (a) over the whole European
model domain; (b) over ocean only; (c) over land only; (d) over Mediterranean basin; (e) over Northern Europe and (f) over Portugal. These regions are defined in Fig. 4. The intervals represent 25 and 75 percentiles. Correlation coefficients are indicated by triangles.
Fig. 5. As for model-POLDER AOT comparisons we ob-serve a clear systematic difference between POLDER and Sun photometer AOTs, even though the correlation between the two sets of data is relatively high, 0.72. CHIMERE AOTs compare much better (in amplitude) with AERONET AOTs than with POLDER AOTs. The CHIMERE/POLDER and CHIMERE/AERONET correlation coefficients are compa-rable and reach respectively 0.64 and 0.61 if the episode of 5–6 August is excluded. This indicates that the previously discussed systematic model overestimation of satellite data may be related to a negative bias in POLDER retrievals. On Fig. 5b we display the ratio of the POLDER- to AERONET-derived AOT data as a function of the Angstr¨om exponent. Values below unity correspond to POLDER underestimation. The Angstr¨om exponent indicates that the POLDER underes-timation is more important for larger aerosol particles in the accumulation mode than for smaller ones. The underestima-tion of the POLDER AOT at 865 nm is consistent with previ-ous POLDER validation studies (Deuz´e et al., 2001) and can be explained by large uncertainties in the aerosol retrievals from satellite data. The satellite underestimation could be associated with numerous factors such as (i) uncertainties in the surface polarization correction, (ii) underestimation in the detection of fine fraction of dust particles, or (iii) incor-rect choice of the aerosol algorithm used for the retrieval of aerosol optical properties. In this study, the main error comes from inaccuracies in the surface polarization correction that
20
01 02 03 04 05 06 07 08 09 10 11 12 13 14 15TOT August 2003 0 0.05 0.1 0.15 0.2 0.25 AOT at 865 nm a) Europe AOT POLDER AOT CHIMERE 0 0.2 0.4 0.6 0.8 1 Correlation coefficient 01 02 03 04 05 06 07 08 09 10 11 12 13 14 15TOT August 2003 0 0.05 0.1 0.15 0.2 0.25 AOT at 865 nm b) Ocean AOT POLDER AOT CHIMERE 0 0.2 0.4 0.6 0.8 1 Correlation coefficient 01 02 03 04 05 06 07 08 09 10 11 12 13 14 15TOT August 2003 0 0.05 0.1 0.15 0.2 0.25 AOT at 865 nm c) Land AOT POLDER AOT CHIMERE 0 0.2 0.4 0.6 0.8 1 Correlation coefficient 01 02 03 04 05 06 07 08 09 10 11 12 13 14 15TOT August 2003 0 0.05 0.1 0.15 0.2 0.25 AOT at 865 nm d) Mediterranean Basin AOT POLDER AOT CHIMERE 0 0.2 0.4 0.6 0.8 1 Correlation coefficient 01 02 03 04 05 06 07 08 09 10 11 12 13 14 15TOT August 2003 0 0.05 0.1 0.15 0.2 0.25 AOT at 865 nm e) Northern Europe AOT POLDER AOT CHIMERE 0 0.2 0.4 0.6 0.8 1 Correlation coefficient 01 02 03 04 05 06 07 08 09 10 11 12 13 14 15TOT August 2003 0 0.05 0.1 0.15 0.2 0.25 AOT at 865 nm f) Portugal AOT POLDER AOT CHIMERE 0 0.2 0.4 0.6 0.8 1 Correlation coefficientFigure 3 : Comparison of simulated vs. satellite retrieved spatial mean AOT at 865 nm and spatial correlation (a) over the whole European model domain; (b) over ocean only; (c) over land only; (d) over Mediterranean basin; (e) over Northern Europe and (f) over Portugal. These regions are defined in Figure 4. The intervals represent 25 and 75 percentiles. Correlation coefficients are indicated by triangles.
-10˚ -8˚ -6˚ -4˚ -2˚ 0˚ 2˚ 4˚ 6˚ 8˚ 10˚ 12˚ 14˚ 16˚ 18˚ 20˚ 22˚ 36˚ 38˚ 40˚ 42˚ 44˚ 46˚ 48˚ 50˚ 52˚ 54˚ 56˚ 0.0 0.1 0.2 0.3 0.4 0.5 0.6 0.7 0.8 0.9 1.0
Figure 4 : Time correlations between simulated and POLDER retrieved AOT across Europe during the summer 2003 heat wave (from 1 to 15 August 2003).
Fig. 4. Time correlations between simulated and POLDER retrieved
AOT across Europe during the summer 2003 heat wave (from 1 to 15 August 2003).
reaches its maximum over urban surfaces. Simultaneously, background AOT is generally not very high in the region considered. Combination of these two factors leads to strong underestimation of AOT Deuz´e et al. (2001) and Nadal and Br´eon (1999). Another potential error is related to the oc-currence of low polarizing particles (dust particles) that also
1860 A. Hodzic et al.: Satellite observed VS model simulated AOTs over Europe
21
0 0.05 0.1 0.15 0.2 0.25 0.3 0.35 Sun Photometer 0 0.05 0.1 0.15 0.2 0.25 0.3 0.35 POLDER CHIMERE 2 2.5 3 3.5Angstrom exponent (AERONET) 0.1 1.0 10.0 AOT (POLDER) /AOT (AERONET)
Figure 5 : (a) Scatter plots of satellite (dots) and model (crosses) retrieved vs AERONET observed AOT at 865 nm. Color points correspond to the stations influenced by smoke plume advection that occurred on 05 and 06 August. The number of used data is 78. Solid line is the 1:1 ratio and dotted lines are a factor of 2 departure. (b) The ratio of the AOT derived from POLDER and AERONET as a function of the Angström exponent. The location of AERONET stations is indicated in Figure 7b.
Fig. 5. (a) Scatter plots of satellite (dots) and model (crosses) retrieved vs AERONET observed AOT at 865 nm. Color points correspond to
the stations influenced by smoke plume advection that occurred on 5 and 6 August. The number of used data is 78. Solid line is the 1:1 ratio and dotted lines are a factor of 2 departure. (b) The ratio of the AOT derived from POLDER and AERONET as a function of the Angstr¨om exponent. The location of AERONET stations is indicated in Fig. 7b.
affects the retrieval accuracy. However, the impact of this lat-ter error is limited regarding the geographical location (Eu-rope) and the studied period. Figure 5a, and the comparison with AERONET data shows the probable absence of bias in the model AOTs. However, as discussed below, the model largely underestimates some of the Sun photometer data on 5 and 6 August, as it did with the POLDER data. This problem is discussed now.
4.5 AOT peaks and the spread of smoke particles from Por-tugal forest fires
Comparison results obtained for Northern Europe (Fig. 3e) and the Portugal region (Fig. 3f), show the inability of the model to reproduce the intense AOT peaks observed during the period from 3 to 6 August. These exceptionally high AOT values are found in the satellite retrievals on 3 and 4 August over Portugal and on 5 and 6 August over Benelux. The poor agreement between model and satellite data also results in low correlation coefficients.
Numerous factors could be incriminated for these prob-lems such as (i) cloud contamination in the POLDER data or (ii) errors in model simulations including uncertainties in aerosol parameterisation, missing processes or sources. The satellite data for this period have been carefully screened. We examined the fine mode Angstr¨om exponent which is an in-dicator of the particle size and could be used to detect the presence of clouds and dust aerosols, associated with lower Angstr¨om values, typically from 0.3 to 1. The POLDER-derived Angstr¨om exponent ranges from 2 to 2.5 and indi-cates that aerosols over Portugal and The Netherlands are mainly composed of small particles present in polluted air
masses, eliminating the possibility of cloud and dust con-tamination. Several reasons led us to believe that the model is missing a key source of aerosols during this period, the violent wildfires that occurred in many areas, especially in central Portugal. First, routine ground-based aerosol mea-surements (air quality monitoring, http://www.lml.rivm.nl/) do not display particularly elevated concentrations of aerosol particles (PM10)on 5 August. The model simulated aerosol
ground concentrations are of comparable magnitude to the observed ones (in the range 15–35 µg/m3 at 11:00 UTC). Thus anthropogenic pollution is not responsible for the high AOT values above The Netherlands, and high AOTs are most likely due to elevated aerosol layers. The presence of such el-evated aerosol layers is confirmed by backscatter lidar verti-cal profiles at 1064 nm (Fig. 6) obtained at Cabauw (51.97N, 4.93E, The Netherlands) on 5 August at 11:00 UTC: profiles clearly show aerosols capped in a layer ranging from 3 to 4 km.
Since these aerosols are not locally produced, they are certainly long-ranged transported. In order to verify the hypothesis of a Portuguese origin, we calculated back-trajectories with the NOAA Hysplit model (Hybrid Single-Particle Lagrangian Integrated Trajectory, http://www.arl. noaa.gov) ending over the Netherlands on 5 August at al-titudes of 3 to 4 km. The back-trajectories (not shown) clearly indicate that the elevated aerosol layer located over The Netherlands crossed the Portuguese forest fire zone and also the high AOT zone located over the north of Portugal on 2–3 August. According to MODIS satellite images, dur-ing this period (2 and 3 August) the north of Portugal faced an extreme forest fire event that generated significant smoke
A. Hodzic et al.: Satellite observed VS model simulated AOTs over Europe 1861
Fig. 6. Diurnal evolution of the aerosol vertical distribution on 5 August 2003 over Cabauw, The Netherlands. The color code in arbitrary
units displays the relative strength of the backscatter. An elevated aerosol layer, decoupled from the planetary boundary layer is present above 2 km altitude.
22
Figure 6 : Diurnal evolution of the aerosol vertical distribution on 5 August 2003 over Cabauw, The Netherlands. The color code in arbitrary units displays the relative strength of the backscatter. An elevated aerosol layer, decoupled from the planetary boundary layer is present above 2 km altitude.
-14˚-12˚-10˚ -8˚ -6˚ -4˚ -2˚ 0˚ 2˚ 4˚ 6˚ 8˚ 10˚ 12˚ 14˚ 16˚ 18˚ 20˚ 22˚ 36˚ 38˚ 40˚ 42˚ 44˚ 46˚ 48˚ 50˚ 52˚ 54˚ 56˚ 58˚ 0.0 0.1 0.2 0.3 0.4 0.5 0.6 0.7 0.8 0.9 1.0 1 2 3 4 5 6 7 8 9 10 11 12 13 14 15
Figure 7 : (a) POLDER-2 image (composite Red-Green-Bleu) over Europe on 05 August (courtesy of LOA and CNES/NASDA). (b) Advection of smoke particles coming from forest fires in Portugal, over Northern Europe on 5 August as simulated by CHIMERE model between 3000 and 4000 meters. AERONET stations used in this study are also indicated (including 1Avignon (9), 2Dunkerque(4), 3El Arenosillo (5), 4Evora (7), 5Fontainebleau
(2), 6Hamburg (5), 7Helgoland (2), 8IMC Oristano (5), 9Ispra (10), 10Lille (3), 11Oostende (3), 12Palaiseau (6), 13Palencia (1), 14Toulon (7), 15Toulouse (8); the number of AERONET data available at each station is indicated
in brackets).
Fig. 7. (a) POLDER-2 image (composite Red-Green-Blue) over Europe on 5 August (courtesy of LOA and CNES/NASDA). (b) Advection
of smoke particles coming from forest fires in Portugal, over Northern Europe on 5 August as simulated by CHIMERE model between 3000 and 4000 m. AERONET stations used in this study are also indicated (including1Avignon (9),2Dunkerque (4),3El Arenosillo (5),
4Evora (7),5Fontainebleau (2),6Hamburg (5),7Helgoland (2),8IMC Oristano (5),9Ispra (10),10Lille(3),11Oostende(3),12Palaiseau (6), 13Palencia (1),14Toulon (7),15Toulouse (8); the number of AERONET data available at each station is indicated in brackets).
plumes (http://rapidefire.sci.gsfc.nasa.gov/) that could have been transported far away from their sources. This suggests that the enhanced AOTs observed in Portugal and over The Netherlands have the same origin: the Portuguese forest fires. The POLDER image of 5 August (Fig. 7a) also indicates that smoke from the fires was transported across the Bay of
Biscay to Northern Europe. Parts of the aerosol cloud can be seen over the Benelux area as well as over the British Isles and Ireland. We confirmed this finding by carrying out “pas-sive tracer” runs with the CHIMERE model. A pas“pas-sive tracer (no chemistry and deposition) was introduced in the model in order to account for the emission of primary aerosols due
1862 A. Hodzic et al.: Satellite observed VS model simulated AOTs over Europe 0 0.5 1 1.5 2 2.5 3 Tracer (a.u) 0 1 2 3 4 5 6 Altitude (km) BL FT
Portugal [-8W,40N]
Aug. 2, 2003, 11:00 0 0.1 0.2 0.3 0.4 Tracer (a.u) 0 1 2 3 4 5 6 Altitude (km)Atlantic sea [-6W,44N]
Aug. 4, 2003, 12:00
0 0.1 0.2 0.3 0.4 0.5 Tracer (a.u) 0 1 2 3 4 5 6 Altitude (km)Ireland [-7W,54N]
Aug. 4, 2003, 18:00
0 0.1 0.2 0.3 0.4 Tracer (a.u) 0 1 2 3 4 5 6 Altitude (km)The Netherlands [5E,52N]
Aug. 5, 2003, 11:00
Figure 8 : Transport of smoke particles from forest fires in Portugal through Europe as simulated by
CHIMERE model. Vertical profiles of boundary layer (BL) and free troposphere (FT) emitted tracers (a.u:
arbitrary unit) are presented at different locations.
Fig. 8. Transport of smoke particles from forest fires in Portugal through Europe as simulated by CHIMERE model. Vertical profiles of
boundary layer (BL) and free troposphere (FT) emitted tracers (a.u: arbitrary unit) are presented at different locations.
to forest fires and their subsequent transport in the atmo-sphere. The tracer was emitted with an arbitrary amplitude within the lower troposphere column (ground to 4 km) from 2 (10:00 UTC) to 4 August (23:00 UTC) over the model grid cells corresponding to active fire spots (−8◦W, 40◦N) detected by MODIS Rapid Response System (NASA/GSFC, http://rapidefire.sci.gsfc.nasa.gov/). Figure 7b shows the lo-cation of the simulated smoke plume on 5 August over Eu-rope. The tracer has been actually transported to an altitude of 3–4 km in the anticyclonic flux from Portugal to
North-ern Europe, across Great Britain. These results are consis-tent with previous back-trajectories, lidar data, and the sim-ilarity between the structures in Figs. 7a and b is striking. This model result, together with the other information we had, confirm that carbonaceous aerosols advected from for-est fires in Portugal are the most probable origin of the high AOT observed over The Netherlands on 5 August.
A. Hodzic et al.: Satellite observed VS model simulated AOTs over Europe 1863 4.6 Evidence of elevated smoke injection height
Another important finding concerns the altitude of tracer in-jection required for the propagation of the fire smoke. Due to their high temperature, fire-emitted carbonaceous particles are directly injected into the atmosphere up to 3 to 4 km alti-tude and may be transported for several hundred kilometers. Additional tracer sensitivity tests demonstrate that the clas-sical convective scheme used in the model is not efficient enough to represent the thermal updraft of fire smoke plumes. In order to determine the original altitude of the emitted smoke plume, tracers were emitted function of the atmo-spheric stability (Fig. 8), respectively within the boundary layer (BL) and into the free troposphere (FT). Particles emit-ted in the boundary layer usually stay in the mixed layer during the day and are partially capped into a residual layer when the boundary layer collapses and could be long-ranged transported. Figure 8 shows that the boundary layer tracer (BL) is transported further to the Atlantic Ocean and does not explain the concentrations observed over the Netherlands. Only the tracer (FT) directly emitted to the free troposphere reaches the Netherlands and explains the patterns observed in POLDER data. This experiment constitutes a strong ev-idence that smoke particles emitted at the surface are di-rectly injected into the free troposphere up to 3–4 km alti-tude and undergo long-range transport to Northern Europe. Finally, it is important to notice that a model upper bound-ary of 500 hPa could be a limiting factor when studying free tropospheric transport of smoke particles since these parti-cles can be convected to much higher altitudes. Additional sensitivity studies regarding to the model’s top level altitude revealed that the long-range transport of particles is not sig-nificantly changed during our specific case study by increas-ing the model top altitude. However, considerincreas-ing the real wild fire emissions in further model studies will require in-creasing the model top level at least up to 300 hPa.
5 Summary and Conclusion
This study described the aerosol optical thicknesses encoun-tered during the great European heat wave of August 2003 by comparing data derived from the POLDER-2 satellite sensor, the AERONET ground-based measurements and simulations from the regional chemistry-transport model CHIMERE. It is demonstrated that the period from 1 to 15 August had an exceptionally high load of aerosol: the observed mean AOT was a factor of 2 higher than during other summer 2003 months, which were also generally polluted months.
The model/observation comparison shows a fair agree-ment between the main spatial structures. However the model accumulation-mode AOTs are systematically higher than the POLDER AOTs (at 865 nm). The comparison with AERONET ground-based measurements indicates that this difference results from a negative bias in the POLDER
re-trievals. This bias seems to occur both for land and ocean types of surfaces and was reported in previous studies (Deuz´e et al., 2000, 2001). The amplitude of the simulated AOTs is in better agreement with sun photometer data than with POLDER data. However POLDER data have a spatial cov-erage that allows the evaluation of the model at the scale of the European continent on a grid while AERONET data do not.
There are features that are not reproduced at all by the model, especially during the 2–6 August period over Por-tugal, The Netherlands, parts of the British Isles and Ireland, where AOTs are very high by patches. We demonstrate that these aerosol “clouds” are likely to originate from the intense forest fires that occurred over Portugal at the beginning of August 2003. The smoke particles generated by the forest fires are transported far away from their sources and affect significantly the aerosol optical properties over Europe dur-ing the heat wave episode. The current model does not ac-count for sporadic emissions of aerosols due to forest fires or dust events and therefore it underestimates the simulated aerosol optical properties during the beginning of the heat wave period.
This comparison highlights the unique advantage of us-ing satellite data to assess model performances, but also the difficulties and limits of this type of verification due to large uncertainties involved in satellite and model retrievals of aerosol optical properties.
Acknowledgements. The authors acknowledge R. Armante and
C. Pietras, Pierre-Simon Laplace Institute, France, S. Massie and J. Lee-Taylor, National Center for Atmospheric Research (NCAR), USA, for their scientific and technical support. We are grateful to the Centre National d’Etudes Spatiales (CNES) for providing POLDER data used in this study. We also thank AERONET Prin-cipal Investigators for collecting and providing the Sun photometer data needed to accomplish this study. The MODIS instrument is operated by the National Aeronautics and Space Agency (NASA), which we acknowledge for their data. This research has been financially supported by ADEME and AIRPARIF.
Edited by: K. Carslaw
References
Bessagnet, B., Hodzic, A., Vautard, R., Beekmann, M., Cheinet, S., Honor´e, C., Liousse, C., and Rouil, L.: Aerosol modeling with CHIMERE – Preliminary evaluation at the continental scale, At-mos. Environ., 38, 2803–2817, 2004.
Chiappello I., Goloub P., and Tanr´e D., et al.: Aerosol detection by TOMS and POLDER over oceanic regions, J. Geophys. Res. Atmos., 105(D6), 7133–7142, 2000.
Chin, M., Ginoux, P., Kinne, S., Torres, O., Holben, B. N., Duncan, B. N., Martin, R. V., Logan, J. A., Higurashi, A., and Nakajima T.: Tropospheric aerosol optical thickness from the GOCART model and comparisons with satellite and sun photometer mea-surements, J. Atmos. Sci., 59, 461–483, 2004.
Deschamps, P. Y., Br´eon, F. M., Leroy, M., Podaire, A., Bricaud, A., Buriez, J. C., and Seze, G.: The POLDER Mission: Instrument Characteristics and Scientific Objectives, IEEE Trans. Geosci. Rem. Sens. 32, 598–615, 1994.
Deuz´e J. L., Goloub P., Herman M., Marchand A., Perry G., Su-sana S., Tanr´e D.: Estimate of the aerosol properties over the ocean with POLDER on ADEOS-1, J. Geophys. Res., 105(D12), 15 329–15 346, 2000.
Deuz´e J. L. et al.: Remote sensing of aerosols over land surfaces from POLDER-ADEOS-1 polarized measurements, J. Geophys. Res., 106(D5), 4913–4926, 2001.
Goloub P. and Arino O.: Verification of the consistency of POLDER aerosol index over land with ATSR-2/ERS-2 fire product, Geo-phys. Res. Lett., 27(6), 899–902, 2000.
H¨anel, G.: The properties of atmospheric aerosols as functions of the relative humidity at thermodynamic equilibrium with the sur-rounding moist air, Adv. Geophys. 19, 73–188, 1976.
Herman, M., Deuz´e, J. L. Devaux, C., Goloub, P., Br´eon, F. M., Tanr´e, D.: Remote sensing of aerosols over land surfaces in-cluding polarization measurements and application to POLDER measurements, J. Geophys. Res., 102(D14), 17 039–17 050, doi: 10.1029/96JD02109, 1997.
Hodzic, A., Chepfer, H., Vautard, R., Chazette, P., Beekmann, M, Bessagnet, B., Chatenet B., Cuesta, J., Drobinski, P., Goloub, P., Haeffelin, M., and Morille, Y.: Comparison of aerosol chemistry-transport model simulations with lidar and sun-photometer ob-servations at a site near Paris, J. Geophys. Res., 109, D23201, doi:10.1029/2004JD004735, 2004.
Holben, B. N., Eck, T. F. Sluster, I. Tanr´e, D., Buis, J. P., Setzer, A., Vermote, E., Reagan, J. A., Kaufman, Y. J., Nakajima T., Lavenu, F., Jankowiak, I., and Smirnov, Z.: AERONET-A federated in-strument network and data archive for aerosol characterization, Rem. Sens. Environ., 66, 1–16., 1998.
Kaufman, Y. J., Tanr´e, D., and Boucher, O.: A satellite view of aerosols in the climate system, Nature, September 2002. King, M. D., Kaufman, Y. J., Tanr´e, D., and Nakajima, T.: Remote
sensing of Tropospheric aerosols from Space: Past, Present, and Future, Bull. Amer. Met. Soc., 80, 2229–2259, 1999.
Leroy, M., Deuz´e, J. L., Br´eon, F. M., Hautecoeur, O., Herman, M., Buriez, J. C., Tanr´e, D., Bouffies, S., Chazette, P., and Rou-jean, J. L.: Retrieval of atmospheric properties and surface bidi-rectional reflectances over the land from POLDER, J. Geophys. Res., 17 023–17 037, 1997.
Li, Z., Goloub, P., Devaux, C., Gu, X., Qiao, Y., Zhao, F., Chen, H. B, and Chatenet, B.: Aerosol polarized phase function and single-scattering albedo retrieved from ground-based measure-ments, Atmos. Res., 71, 233–241, 2004.
Myhre, G., Stordal, F., Johnsrud, M., Ignatov, A., Mischenko, M. I., Geogdzhayev, I. V., Tanr´e, D., Deuze, J. L., Goloub, P., Nakajima T., Higurashi, A., Torres, O., Holben, B.: Intercomparison of satellite retrieved aerosol optical depth over the ocean, J. Atmos. Sci., 61(5), 499–513, 2004.
Nadal, F. and Br´eon, F. M.: Parameterization of surface polarized reflectance derived from POLDER spaceborne measurements, IEEE Trans. Geosci. Rem. Sens., 37, 1709–1718, 1999. Rasool, I., Baldi, M., Wolter, K., Chase, T. N., Otterman, J.,
and Pielke, R. A.: August 2003 heat wave in Western Europe, An analysis and perspectives, European Meterological Society (EMS) 4th Annual Meeting – Part and Partner: 5th Conference on Applied Climatology (ECAC), Nice, France, 26–30 Septem-ber, J. Geophys. Res., 2004.
Remer, L. A., Tanr´e D., Kaufman, Y. J., Ichoku, C., Mattoo, S., Levy, R., Chu, D. A., Holben, B. Dubovik, N. O., Ahmad, Z., Smirnov, A., Vanderlei Martins, J.,and Li, R.-R.: Validation of MODIS Aerosol Retrieval Over Ocean, Geophys. Res. Lett., 29, doi:10.1029/GL013204, 2002.
Schmidt, H. and D., Martin: Adjoint sensitivity of episodic ozone in the Paris area, to emissions on the continental scale, J. Geophys. Res., 108(D17), 4313, 2003.
Tanr´e, D., Br´eon, F. M., Deuz´e, J. L., et al.: Global observation of anthropogenic aerosols from satellite, Geophys. Res. Lett, 28(24), 4555–4558, 2001.
Vautard, R., Bessagnet, B., Chin, M., and Menut, L.: On the contri-bution of natural Aeolian sources to small particle concentrations in Europe, testing hypotheses with a modelling approach, Atmos. Environ., 39(18), 3291–3303, 2005.