Publisher’s version / Version de l'éditeur:
Vous avez des questions? Nous pouvons vous aider. Pour communiquer directement avec un auteur, consultez la première page de la revue dans laquelle son article a été publié afin de trouver ses coordonnées. Si vous n’arrivez pas à les repérer, communiquez avec nous à [email protected]. Questions? Contact the NRC Publications Archive team at
[email protected]. If you wish to email the authors directly, please see the first page of the publication for their contact information.
https://publications-cnrc.canada.ca/fra/droits
L’accès à ce site Web et l’utilisation de son contenu sont assujettis aux conditions présentées dans le site LISEZ CES CONDITIONS ATTENTIVEMENT AVANT D’UTILISER CE SITE WEB.
The 11th European Wave and Tidal Energy Conference [Proceedings], 2015-09
READ THESE TERMS AND CONDITIONS CAREFULLY BEFORE USING THIS WEBSITE. https://nrc-publications.canada.ca/eng/copyright
NRC Publications Archive Record / Notice des Archives des publications du CNRC :
https://nrc-publications.canada.ca/eng/view/object/?id=ffc0c55f-939e-4c3d-af59-525804c541ba
https://publications-cnrc.canada.ca/fra/voir/objet/?id=ffc0c55f-939e-4c3d-af59-525804c541ba
NRC Publications Archive
Archives des publications du CNRC
This publication could be one of several versions: author’s original, accepted manuscript or the publisher’s version. / La version de cette publication peut être l’une des suivantes : la version prépublication de l’auteur, la version acceptée du manuscrit ou la version de l’éditeur.
Access and use of this website and the material on it are subject to the Terms and Conditions set forth at
3D modelling and optimization of a hydrokinetic power generation
barge
3D Modelling and Optimization of a
Hydrokinetic Power Generation Barge
Scott Baker
#1, Andrew Cornett
#2, Maarten Kluijver
*3#National Research Council Canada, Ottawa, Canada
1
2
*
Moffatt & Nichol, Baton Rouge, U.S.A.
3
Abstract— A physical modelling study has been conducted to investigate the performance and help optimize the design of a stationary floating barge fitted with an undershot paddle wheel designed to convert hydrokinetic energy into electrical energy in a range of steady flows. The paddle wheel is located inside a contraction within a central flow channel formed between two lateral pontoons. A systematic approach was used to investigate the effects of changing several parameters, including barge width, wheel diameter, wheel breadth, degree of contraction/ expansion, barge trim, barge draft, and incident flow velocity. The influences of these parameters were investigated with the goal of maximizing both power production and overall efficiency.
Keywords
—
Hydrokinetic energy, physical modelling, power generation, paddle wheel, efficiency, energy convertorI. INTRODUCTION
The concept of employing floating hydrokinetic power generators equipped with undershot paddle wheels (also known as water wheels) to extract useful energy from river currents has been around for hundreds of years. In the past, these devices were typically designed to operate in strong river currents, and many devices operated successfully for many decades and even centuries. During the industrial revolution, many of these floating power generators disappeared due to their relatively low power outputs and the interference they caused with shipping and navigation. Today, there is renewed interest in using various types of energy converters, including floating paddle wheels, to extract energy from untapped renewable sources such as river and tidal currents. Floating paddle wheels could be a good candidate for alternative power generation in riverine locations without direct grid connections and in undeveloped areas adjacent to large rivers.
A floating hydrokinetic power barge has been considered for extracting useful energy from the river currents in the lower Mississippi River or Atchafalaya River region. The barge is intended to operate in typical flow conditions observed in this region, with mean current speeds of approximately 1.0 m/s and average water depths of approximately 15 m.
The hydrokinetic power barge investigated in this study consists of an undershot water wheel mounted above a central water channel formed between two lateral pontoons. The floating barge would be stationary; either tethered by mooring lines or secured to piles. Electric power is generated through rotation of the paddle wheel, forced by the water flowing through the central water channel. The basic geometry of the barge and water wheel were roughly defined at the project outset, and a physical modelling study was conducted to validate the system performance and provide the information required to optimize the initial design. The main objectives of the physical modelling studies described in this article were to quantify the performance of the hydrokinetic power barge in a range of flow conditions, and investigate and quantify the effects of various design parameters on the hydrodynamics and power generation performance. The influences of the following parameters were investigated:
barge width; wheel diameter; wheel breadth;
degree of contraction/expansion; barge trim;
barge draft; and, water flow velocity.
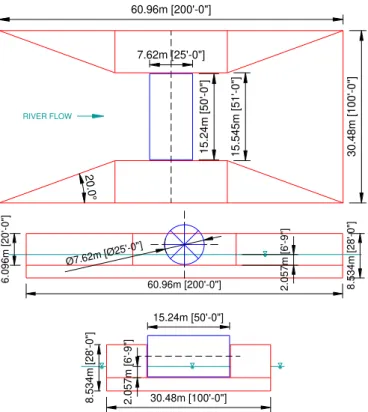
The base case barge design adopted in the physical modelling study featured a 30.48 m (100 ft) wide by 60.96 m (200 ft) long rectangular hull that included a single variable-width central water channel formed between two lateral pontoons. The barge hull includes a 2.44 m (8 ft) thick floor separating the central water channel from the river flow below. A 15.24 m (50 ft) wide by 7.62 m (25 ft) diameter undershot water wheel is mounted above the water channel at the centre of the barge (see Figure 1). In order to improve the power generation performance of the system, the central water channel included a contraction designed to leverage the Venturi effect to increase the flow speed of the water passing under the water wheel. The width of the central portion of the water channel was reduced to 50% of the entrance width in the base case design. For a wheel diameter of 7.62 m, the base case configuration featured 8 blades/paddles and a paddle immersion depth to wheel diameter ratio in the range of 1/4 to 1/5.
RIVER FLOW 20 .0 ° 30 .4 8m [1 00 '-0" ] 60.96m [200'-0"] 15 .5 45 m [5 1' -0 "] 15 .2 4m [5 0' -0 "] 7.62m [25'-0"] 60.96m [200'-0"] Ø7.62m [Ø2 5'-0"] 2.0 57 m [6 '-9 "] 6.0 96 m [20 '-0 "] 8.5 34 m [28 '-0 "] 30.48m [100'-0"] 2.0 57 m [6 '-9" ] 15.24m [50'-0"] 8. 53 4m [2 8' -0 "]
Fig. 1 Design sketches of the hydrokinetic power barge (base case design). (plan view, side elevation, front elevation)
The recent scientific literature on floating hydrokinetic power generators includes a series of papers published by a research group based at the University of Southampton in the U.K. References [2] and [3] describe the design, construction, and testing of both model scale and large scale floating free stream energy converters equipped with an undershot paddle wheel. The energy converter concept considered in these studies features a floating body with side pontoons, a base plate, and flow separators that drive a hydrostatic pressure wheel. The research compared results from a 1.2 m long model fitted with a 0.5 m diameter wheel tested in a circulating water channel against results from a 7.6 m long large scale model towed through calm water in a small lake. The small scale testing demonstrated a small drop in efficiency using a floating model as compared to a fixed model, though efficiency was observed to increase as the bow was trimmed down. Large scale testing revealed similar performance, however further investigations were recommended to gain a fuller understanding of the system behaviour and trends.
Reference [5] suggests that while floating undershot water wheels may not be a viable solution for large scale renewable energy production (due to their relatively low efficiency), their relative simplicity and low cost could make them a viable option for decentralized electricity generation in developing countries or remote locations. Studies of similar machines are reported in [4], [6]–[8].
II. PADDLE WHEEL THEORY
The amount of hydrokinetic power available in a steady river flow is dependent on the kinetic energy of the flowing water, defined in Eq. [1]:
Potential Power = 0.5 ρ A V3 [1] where ρ is the water density, A is the cross-sectional area of the flow (perpendicular to the flow direction), and V is the time-averaged flow velocity. The kinetic power density is obtained by considering a unit cross-sectional area (1 m2). The relationship between power and velocity is cubic; therefore small increases in flow velocity correspond to significantly larger increases in potential power.
The efficiency of a paddle wheel power generator depends on several factors, including hydrodynamic losses, power dissipation through friction, part deformation, and wear. Efficiency is generally defined as power output divided by the kinetic power of the incident flow. In this study, the power output is the time-averaged shaft power generated by the paddle wheel. Several different efficiency metrics can be defined, depending on the cross-sectional area and flow velocity used to define the incident kinetic power. The overall efficiency of the hydrokinetic power barge system, 1, is
defined using the undisturbed flow velocity and the submerged cross-sectional area of the wheel plus the barge. The efficiency of the wheel itself, 2, is defined using the
undisturbed flow velocity at the wheel (the velocity within the contraction without the wheel, but including the effect of the barge) and the submerged cross-sectional area of the wheel. A third efficiency metric, 3, is obtained by considering the
undisturbed flow velocity upstream of the barge from 1, and
the smaller sectional area (the submerged cross-sectional area of the wheel) from 2.
Water flowing around and under the barge is responsible for much of the efficiency losses. Additional hydrodynamic losses occur as water enters the barge, flows through the contraction, and exits the rear of the barge.
III. PHYSICAL MODELLING
The physical model studies described in this article were conducted by the National Research Council of Canada (NRC), Canada’s premier research and technology organization. The study was supported by Moffatt & Nichol, a leading global infrastructure advisor specializing in the planning and design of marine facilities for coastlines, harbours, and rivers.
The studies were conducted in the Large Wave Flume (LWF) at the NRC laboratory in Ottawa, Canada. The 97 m long by 2 m wide by 2.75 m deep LWF features a powerful wave machine with active wave absorption and second-order wave generation technologies for generating a wide range of realistic seastates with significant wave heights up to 0.75 m. Bi-directional currents and winds can also be generated. The wave machine was inactive for the present study, while further information on the generation of currents is given below.
A. Scaling
These model studies have been conducted at a geometric scale of 1:25, which means that all lengths in the model were 25 times smaller than the corresponding prototype length. This scale was selected so that the proposed barge and the water flows could be modelled at as large a scale as possible, yet fit within the confines of the available model test facility.
Since free surface hydraulics are governed by a balance between the gravitational and inertial forces acting on water particles, similitude of the Froude number in the model and at full scale, together with geometric similitude, ensures that the model provides a reasonable simulation of the interaction of steady free-surface flows with the hydrokinetic barge. The model design and operation were governed by relationships derived from Froude scaling principles, and scaling relationships derived from these principles were used to extrapolate prototype system behaviour from quantities measured in the model. Most of the results presented in this article have been converted to prototype values using standard scaling relationships derived from Froude scaling principles.
As a consequence of this approach, the Reynolds number, which denotes the ratio between inertial forces and viscous forces, was 125 times smaller in the model than in prototype conditions. Laminar flows, characterized by smooth, constant, fluid motion, occur at low Reynolds number where viscous forces are dominant, while turbulent flows, characterized by chaotic eddies and vortices, occur at higher Reynolds number where inertial forces are dominant. Since turbulent flow conditions were maintained in the model in all cases, the scale effects stemming from this unavoidable distortion in Reynolds number are expected to be small.
B. Model Construction
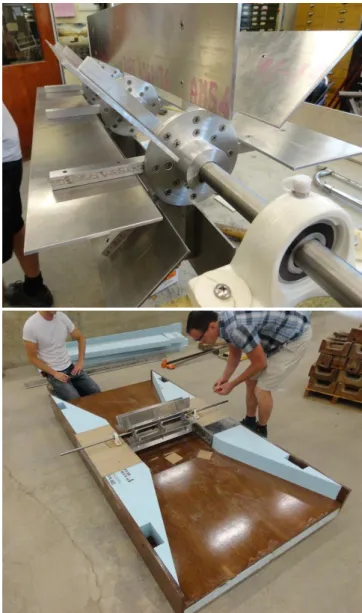
Three model barges were designed and fabricated to simulate three different variants of the same prototype concept as closely as possible. Marine-grade plywood was used to construct the main structure of the barge, while a rectangular box of PVC was used as a central platform to mount the shaft bearings. The translucent PVC allowed for side-on viewing of the head differential that occurred as the water passed through the paddle wheel. The plywood was treated with several coats of West System epoxy resin to provide improved durability and water resistance for the lengthy testing duration. Wedge-shaped Styrofoam blocks were used to model the lateral pontoons and form the contractions and expansions leading to and from the paddle wheel. The pontoon blocks were readily interchangeable so that different contraction angles could be modelled with relative ease. Metal bracing was added to the underside of the barge deck to provide extra structural rigidity. A large block of Styrofoam was incorporated into the base of the barge to provide buoyancy and replicate the thickness of the prototype barge floor. Figure 2 shows a view of the paddle wheel and barge during construction and assembly.
Fig. 2 Fabrication and assembly of the model paddle wheel and barge
The first barge hull modelled the base concept design, while the second hull was designed to accommodate a wider wheel, and the third model was designed to accommodate a larger diameter wheel.
The model paddle wheels were designed and fabricated to simulate the prototype concept as closely as possible. Most parts of the water wheel were machined from aluminum to reduce weight as much as possible, but still retain adequate strength and rigidity. The drive shaft was made from stainless steel and featured a keyway for maximum precision when assembling the various components of the wheel.
The fully assembled hydrokinetic power barge model was hoisted into the Large Wave Flume and suspended from a support frame specially fabricated for this study. It was decided to model the barge as a fixed structure due to the additional technical difficulties involved with modelling the barge as a floating structure, namely ensuring precisely accurate trim angles and correct water depths at the water wheel.
C. Instrumentation
Vertical fluctuations of the free surface were measured in the model using six capacitance-wire water level gauges. Two of the gauges were located several meters upstream and downstream of the barge itself, while four smaller gauges were located within the central water channel just upstream and downstream of the water wheel.
Flow velocities were measured using four 2-axis (u,v) electromagnetic current meters (ECMs). The velocity measurements were analyzed to resolve the speed and direction of the low-frequency and high-frequency components of the flow at each sensor.
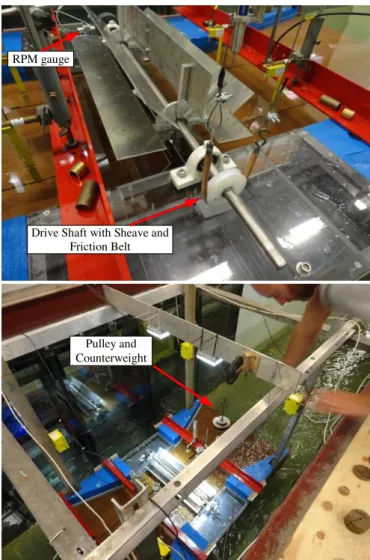
An RPM gauge was used to measure the rotational velocity of the water wheel. A PVC pulser wrap featuring 16 button magnets was rigidly fixed to the drive shaft. The sensing head was then positioned near to the pulser wrap (but not in contact with the rotating shaft, thereby not applying any additional friction). The sensing head detected the rotating magnets, and relayed a voltage signal directly proportional to the rotational speed of the drive shaft. Blade tip speed (VT) was calculated
from the speed of rotation and the wheel circumference. Tip speed ratio (TSR) is defined as the blade tip speed divided by the time-averaged near-surface flow velocity upstream of the barge.
The load on the paddle wheel and its rotational speed was controlled using a ‘Prony Brake’, a simple device for measuring the torque produced by an engine. The braking system uses a load cell measuring mass mlc, a counterweight
of mass mcw, and a friction belt to apply torque to a sheave
(pulley) of radius r attached to the drive shaft, rotating with frequency f. The output power is determined by multiplying the torque by the angular speed, as seen in Eq. [2].
Poutput = (mcw– mlc) g r 2π f [2]
A schematic of the Prony brake system used in this project is shown in Figure 3.
Fig. 3 Schematic of the Prony Brake system used to apply load and measure power output in the model
In the model, the counterweight mass (and the load on the paddle wheel) was varied by hanging different pre-measured weights from one end of the friction belt. The tension at the other end of the belt was measured using a shear-beam type load cell.
A series of checks were performed to verify the workings of the braking system. In an idealized case when the paddle
wheel is static, the weight measured by the load cell should exactly equal the counterweight. However, due to friction losses in the power shaft bearings, the load cell measured slightly less than the true counterweight. It was found that the losses due to static friction averaged approximately 4% over a range of counterweights tested. Therefore, during post-processing analysis, the load cell readings were increased by 4% to yield more accurate estimates of torque and power. The assembled Prony brake system is shown in Figure 4.
Fig. 4 Prony Brake system deployed in the model
D. Generation and Calibration of Currents
In the physical model, currents were generated by means of a generation system consisting of a 2 m wide by 0.4 m high by 53 m long tunnel constructed below the floor of the flume, with openings and guide vanes at either end. Four reversible variable-speed impellor pumps (thrusters) were installed at the downstream end of the tunnel which, when operating, forced a flow through the tunnel (see Figure 5). The thrusters forced a circulation pattern in which the return flow travelled across the test site in a direction opposite to the flow within the tunnels. The tunnel inlets and outlets were fitted with curved Rotation
Load Cell Pulley
Counterweight
Friction Belt
Drive Shaft with Sheave Upstream Current
Downstream Current Paddle Wheel
Drive Shaft with Sheave and Friction Belt
Pulley and Counterweight RPM gauge
guide vanes which helped control and turn the flow as it entered and exited the tunnels. The thrusters were connected to variable-speed controllers so that the speed of each thruster, and hence the speed of the current at the test site, could be controlled with good precision.
Current calibrations were performed to develop the thruster settings required to generate the desired flow conditions at the test site for each water depth and design flow condition, and to measure the undisturbed flow properties in detail. A rating curve describing the relationship between the thruster setting and the resulting current at the test site was developed for each water depth. The rating curves were then used to determine the thruster setting required to generate any particular current at the test site. The current calibrations were performed with the barge model installed (but without the water wheel) to ensure that the blockage / flow resistance due to the barge was accounted for in the calibrations.
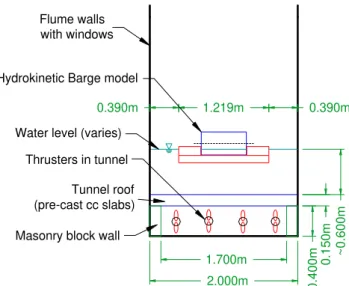
Water level (varies) Flume walls with windows 2.000m Thrusters in tunnel Tunnel roof (pre-cast cc slabs) Masonry block wall
1.700m 0. 40 0m 0.15 0m 1.219m 0.390m 0.390m ~0 .6 00 m
Hydrokinetic Barge model
Fig. 5 Cross-sectional view of the barge in the flume
The relationship between thruster setting and mean current velocity was very linear for all depths and for each of the three different barges. The current generation system, with four thrusters operating, was able to generate all of the flow conditions required for this study.
E. Testing Program
The testing program for this study was developed collaboratively by Moffatt & Nichol and NRC. Five distinct series of tests were undertaken in this study. A systematic approach was used to study the effects of several key variables and design parameters. These variables included four paddle immersion ratios (water depths) ranging from 1/4 – 1/5.5, seven upstream velocities ranging from 0.75 – 2.75 m/s, three contraction angles ranging from 20° – 25°, and three trim angles ranging from 0° – 2°. Many of these tests were conducted for two different barge (and wheel) widths, and two different wheel diameters. In total, more than 400 unique tests were performed. The main results are presented and discussed in the following section.
IV. RESULTS AND DISCUSSION
A. Influence of Barge Geometry
The main objective of the initial series of tests was to gain an improved understanding of the flows through the barge (velocity and free surface elevation) and determine the optimal contraction angle and optimal trim angle for use in further testing. The base case barge hull was used for these tests; however the paddle wheel was not present. A constant water depth (above the barge floor) of 1.86 m and constant upstream flow velocity of 1.50 m/s (full scale values) was maintained for all tests in this series. Several tests were conducted for each different setup (varying the contraction angle and trim angle), each time moving some of the water level and velocity sensors to different locations to gain a better understanding of the spatial variation in flow speed and free surface elevation across the barge. Adjustments to the support frame allowed precise control over the barge trim angle.
A general trend that became readily apparent among each data set was that, compared to the upstream velocity, the velocity measured within the central water channel decreases significantly upon entering the barge at the bow, but then is accelerated due to the Venturi effect provided by the contraction. For some configurations, the velocity at the water wheel location was higher than the upstream velocity, but for others, the flow speeds at the wheel were lower. Figure 6 compares the variation in flow velocity across the barge for three tests with different barge trims. The results from these tests indicate that velocities at the centre of the contraction (where the paddle wheel will be installed) are greatest for the level trim condition and smallest for the 2° trim configuration. The downstream velocities measured behind the barge were generally consistent, and did not vary significantly with contraction angle or trim angle.
Fig. 6 Effect of trim angle on flow velocity through the barge
The results from the first test series also suggest that, while the influence of contraction angle is fairly small over the 5° range considered in these tests, the more gradual 20° contraction leads to slightly higher velocities at the centre of the contraction. The horizontal distance over which higher
velocities were observed was also greater for the zero trim configuration and the more gradual contraction. It is quite possible that even more gradual contractions or non-linear (curved) contractions could lead to enhanced performance, although these alternatives were not assessed in this study.
The barge geometry considered in these tests was not streamlined nor optimized to minimize flow resistance or hydrodynamic losses. These factors likely increased the amount of flow diverted under and around the barge, and decreased the discharge passing through the central contraction, and hence the velocities observed above the barge floor. Although some preliminary structural modifications were assessed later in the testing program (not reported herein), it is likely that the overall performance of the hydrokinetic power barge could be improved by optimizing the barge shape / geometry to minimize hydrodynamic losses.
B. Influence of Barge Trim Angle
The main objective of the second series of tests was to confirm the sensitivity to trim angle previously investigated in the initial tests, however this time including the paddle wheel. The base case barge design was used again for this investigation. Four different upstream velocities were investigated for three different trim angles: 0°, 1°, and 2°. At each flow velocity, several tests were performed in which the counterweights used in the braking system were varied. This was necessary in order to obtain the data required to develop power curves describing the variation in power output with wheel RPM. The maximum power output and the maximum efficiency for each configuration were determined in this way. Figure 7 shows the model barge during testing, while Figure 8 shows the current meter layout that was used for the remainder of the testing program.
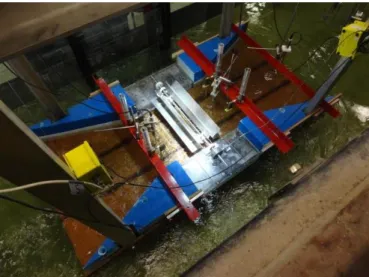
Fig. 7 Model barge with water wheel during testing
For each velocity investigated, power production decreased notably as the bow of the barge was trimmed down. On average, 1 degree of trim caused a ~20% reduction in maximum power, while 2 degrees of trim caused a ~50% reduction in maximum power, relative to the maximum power
produced when the barge had an even trim. This trend was consistent with the results of the initial test series. The effects of trimming the bow up were not investigated in this study.
These results suggest that flow velocities above the barge floor and within the contraction (and subsequent power generation) are quite sensitive to overall trim angle (see Figure 9). The maximum available power in the flow, based on the upstream velocity and the wetted area of the paddle is shown. The shaft power produced by the paddle wheel is always less than the available stream power.
30 .48 0m [1 00 '] 60.960m [200'] 50 .00 0m [1 64 '-1 "] 22.860m [75'] U1 U4 U2 U3 22.860m [75'] 22.860m [75'] 2.540m [8'-4"] Current
Fig. 8 Location of current meters U1 – U4
Fig. 9 Effect of trim angle on power production
The experimental results suggest that the barge trim should be maintained level in order to maximize performance. This finding contrasts with results obtained by others working with similar devices (see [2] and [3]) who found that trimming the bow down produced significant improvements in efficiency. The mechanism for this gain in performance was hypothesized as mainly due to the larger head difference and possibly less water lifted by the wheel as the blade exited the water. The reasons for the conflicting results are uncertain. In this study, trim was introduced by rotating the model about its centerline so that the elevation of the water wheel remained constant, and it is unclear whether the same procedure was also used in the aforementioned experiments. One possible explanation is that the thickness of the barge floor considered in this study was much greater than the one studied previously. The presence of this thick floor below the central flow channel
produced much greater flow disturbance than the relatively thin floor studied previously.
C. Influence of Drive Shaft Load
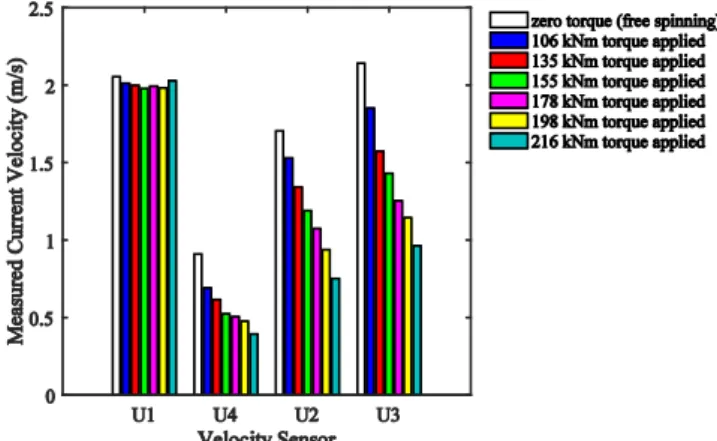
Figure 10 illustrates the typical effect that varying the load on the paddle wheel has on the flow velocities at four locations upstream and within the central water channel. The free surface elevations were also impacted in a similar manner. The locations of current meters U1 – U4 can be seen in Figure 8. The barge was rigidly secured to the support frame such that the trim angle remained constant as the loading changed. During the first test, virtually no torque was applied to the drive shaft and the paddle wheel was allowed to spin freely. In this configuration, the velocities measured within the barge contraction are at their highest. As more torque (load) was applied to the wheel, the rotational speed of the wheel decreased, and a backwater condition developed in front of the wheel causing water levels to increase and velocities to decrease on the upstream side of the wheel (at U2). On the downstream side of the wheel (at U3), water levels drop abruptly and water velocities increase as the load on the wheel increases. Water velocities measured just downstream of the wheel were nearly always higher than those measured just upstream, having been accelerated while passing through the wheel. The difference in total head (pressure head + velocity head + elevation head) across the wheel is indicative of the energy required to rotate the wheel.
Fig. 10 Effect of applied torque on measured current velocities
In many cases, visual observation revealed that the flow immediately downstream from the wheel was often supercritical, resulting in the development of a small hydraulic jump further downstream within the expanding portion of the central water channel. The location of this hydraulic jump was somewhat temporally variable (during the course of an individual test segment), but was strongly influenced by the upstream velocity. For lesser upstream flows, or when large amounts of torque were applied to the drive shaft, the hydraulic jump did not develop, or tended to develop immediately downstream of the paddle wheel. For greater upstream flows, or when smaller amounts of torque were applied to the drive shaft, the hydraulic jump tended to develop closer to the stern of the barge. This hydraulic jump
represents an abrupt transition from super-critical to sub-critical flow.
D. Influence of Flow Velocity and Barge Draft
The main objectives of the third series of tests were to collect additional data for different flow velocities using the optimal trim angle confirmed in the previous test series, and investigate the sensitivity of power production to the barge draft and the depth of the flow passing through the central contraction. The base case barge design was once again used for these investigations.
Figure 11 demonstrates the influence of upstream flow velocity on power production, over the range of incident flow speed from 0.75 m/s to 2.75 m/s. The typical variation of power output with tip speed ratio (varied by changing the load on the wheel) is also shown. As expected, power production is greatest when the incident flow velocities (well upstream of the barge) are highest. The efficiency was maximized for a flow speed of 2.50 m/s and a tip speed ratio of ~0.7. The peak efficiency does not vary significantly with upstream velocity for speeds between 1.25 and 2.50 m/s, but decreases notably for upstream velocities of 1.00 m/s or less. The peak efficiency at 2.75 m/s was also lower than at more moderate flow speeds.
This loss of efficiency was, to some degree, visually apparent while observing the rotating paddle wheel. For smaller upstream velocities, the rotational speed of the wheel was relatively low, and would fluctuate notably as individual paddle blades entered/exited the water. The power output for these conditions was also highly unsteady. In fact, when flow velocities became very low (0.50 m/s or less), the kinetic energy of the flow was insufficient to overcome the inertia and static friction of the system, and the paddle wheel remained stalled. For greater upstream velocities, this surging motion was likely still present; however, since the rotational speed of the paddle wheel was relatively high it allowed significant rotational inertia to develop, thereby requiring less tangential force from the current to maintain the rotation.
During the third series of tests, an investigation was undertaken to determine the optimum barge draft. Intuition suggests that deeper water depths within the contraction should increase the wetted paddle surface area, which should increase power production. However, this reasoning does not necessarily prove true in practice due to the complexity of the \interactions between the water and the spinning wheel. It was found that gains associated with increased paddle immersion were sometimes offset by the fact that the volume of water each blade must displace as it rises out of the water also increased. The barge draft was varied by varying the water depth in the flume to achieve four different paddle immersion ratios (ratio of wetted blade height to overall paddle diameter): 1/4, 1/4.5, 1/5, and 1/5.5.
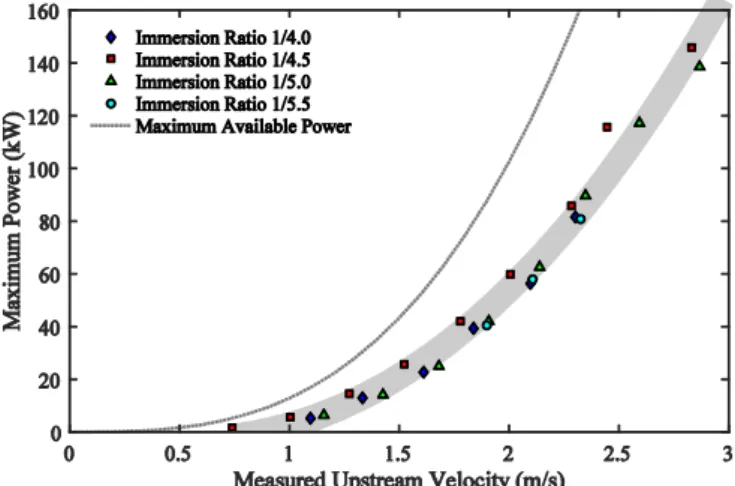
Figure 12 demonstrates the influence of paddle immersion ratio on power production, derived from the results of these experiments. The results suggest that power production is not overly sensitive to immersion ratio over this range. Although there is some variability, these results suggest that power production is maximized for an immersion ratio of 1/4.5. Power production was generally slightly lower for immersion ratios of 1/4 (deepest draft), 1/5 and 1/5.5 (shallowest draft).
Fig. 12 Influence of paddle immersion ratio on power production
E. Influence of Wheel Diameter
The main objective of the fourth series of tests was to determine the relative effects of a larger diameter wheel on power production. The wheel diameter was increased by 40% from 7.62 m (25 ft) to 10.67 m (35 ft), while the wheel width remained unchanged.
Figure 13 shows the effect of wheel diameter on power production. In comparison to the base case wheel (diameter of 7.62 m), the larger diameter wheel (10.67 m) generally produced ~70% more power for the same upstream flow velocity. The larger diameter wheel also was generally 8-10% more efficient for each velocity tested. In the model, the larger diameter wheel was only ~20% heavier than the base case wheel, while the wetted paddle area increased by ~38%. The improvement in efficiency is most likely linked to the fact that the wetted area increased more than the wheel weight.
Minimizing frictional losses and wheel weight are important consideration for prototype design.
Based on these experimental results, the larger diameter wheel provided a ~70% increase in power production for the same incident velocity as compared to the smaller diameter wheel. In theory, increasing the wheel diameter even further would result in even greater power output; however, several practical issues would need to be considered before pursuing this strategy. For instance, increasing the overall weight of the rotating parts will impart additional stress and friction on the bearings, which could increase maintenance costs or reduce the expected lifetime of the investment. Also, as the weight of the wheel increases, a greater force (flow speed) would be required to initiate rotation.
Fig. 13 Influence of wheel diameter on power production
F. Influence of Wheel Width
The main objective of the fifth series of tests was to investigate and quantify the effects of increasing the width of both the barge and the paddle wheel. The barge width was increase by 15% from 30.48 m (100 ft) to 35.05 m (115 ft), while the paddle wheel width was increased by 30% from 15.24 m (50 ft) to 19.81 m (65 ft). The wheel diameter was maintained at 7.62 m (25 ft) as in the base case configuration. The entrance and exit angles for the contraction within the central water channel remained unchanged, and because of this, the Venturi effect provided by the contraction was less for the wider barge than for the narrower barge considered previously. The percentage reduction in water channel width due to the contraction was 43% for the wider barge, compared to 50% for the base case design. Flow speeds measured within central water channel confirmed that the flow accelerations were smaller for the wider barge design.
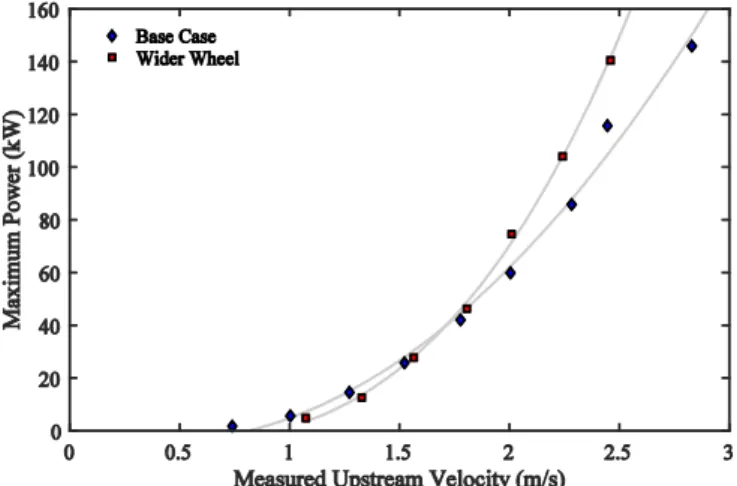
Figure 14 shows the influence of wheel width on maximum power production over the range of upstream flow speed from 1.0 m/s to 2.5 m/s. In comparison to the 15.24 m wide base case wheel, the power output from the 19.81 m wide wheel was similar at lower flow velocities, but became greater at higher flow speeds above 1.75 m/s. This result conflicts with theory, which suggests that the wider barge should always
produce more power (because the wetted paddle area is ~30% larger). One possible explanation for this result is that the additional mass of the wider wheel increased the inertial resistance that must be overcome to initiate rotation. Another is that the frictional resistance of the wider wheel was slightly larger, and this additional friction retarded wheel rotation at low flow speeds. However, this effect was eventually overcome as flow speeds increased. The wider wheel was roughly 5% less efficient for higher upstream flow velocities, but 10-20% less efficient for lower velocities. Some of this loss in efficiency is due to the reduced contraction.
Based on these results it was concluded that the wider wheel did not provide any significant improvement in power production for lower incident velocities which are more typical of conditions commonly encountered in rivers. The overall width of the prototype paddle wheel will likely be constrained by practical considerations, such as the sag and flexure of the drive shaft over large spans, and the desire to maintain a small and uniform gap between the barge floor and the blade tip.
Fig. 14 influence of wheel width on power production
V. CONCLUDING REMARKS
A physical model study was conducted to study the performance of a hydrokinetic power barge fitted with central water channel and an undershot paddle wheel in a range of steady flows. A systematic approach was used to study the relative effects of changes in barge width, wheel diameter, wheel breadth, degree of contraction/expansion, barge trim barge draft, and incident flow velocity. The influences of these parameters were investigated with the goal of maximizing both power production and wheel efficiency.
In order to minimize errors and uncertainties due to scaling effects as much as possible, it was considered important to conduct these studies at as large a scale as was feasible. As such, these studies have been conducted at a geometric scale of 1:25 in a current flume that is 2 m wide. One of the drawbacks of this approach is that the results of this study are likely influenced to some degree by the effects of flow blockage, which was higher in the model than would likely be
the case in nature. For these reasons, caution is advised when applying the results of this study to prototype conditions where the flow blockage is lower. Theoretical considerations suggest that the higher blockage in these experiments (with respect to the wetted cross-sectional area of the flume, the submerged portion of the barge model represents a ~17% blockage in flow) will result in the power output being overstated compared to unconfined situations. Unfortunately, the precise magnitude of this over-prediction remains uncertain.
The physical model was designed and fabricated with care and precision to replicate initial designs proposed by Moffatt & Nichol. Consideration was given to minimizing the inertia and frictional losses of the paddle wheel as much as possible while retaining a high degree of rigidity and stiffness. The model was fitted with a simple Prony brake mechanism so that the load on the wheel could be varied and the torque could be measured with good precision. Other sensors were provided to measure flow velocities, water levels and wheel RPM. The sensor outputs were monitored continuously during testing and the data was analysed to obtain key metrics for each test, including the power output.
The results of this study confirm that a stationary floating barge fitted with an undershot paddle wheel can be used to generate useful power from steady water currents. As expected, the experimental results demonstrate that power production follows a cubic relationship with incident flow velocity. Therefore even small increases (or decreases) in incident flow speeds result in large increases (or decreases) in observed power production. For the base case barge design, the maximum power output ranged from approximately 6 kW to 145 kW (at full scale), for incident flow velocities of 1.00 – 2.75 m/s. Peak efficiencies, quantified in terms of the 3
metric (defined above in Section II), typically ranged from 40 – 60%, while 1 ranged from 8 – 12%.
Of the three contraction angles that were considered, a contraction angle of 20° provided the best flow accelerations at the center of the water channel. It should be noted that a more gradual contraction, with a smaller entrance and exit angles (<20°), or a curved contraction may provide even further improvements. Only symmetric contractions with identical entrance and exit angles were considered in these tests. It may be possible to increase performance further by using a non-symmetric contraction with different geometries on the upstream and downstream sides of the paddle wheel. It is also noted that the contraction geometries considered in this study featured sharp corners which caused localized turbulent eddies; rounding these corners to minimize eddies would lead to improved performance.
Other parameters that contribute to hydrodynamic losses such as the non-streamlined shape of the barge and the thick barge floor/hull were not included in the present work; however, significant improvements to performance could be achieved through further optimizations.
It should be noted that in the physical model, incident flow speeds below ~0.50 m/s were insufficient to overcome the inertia and static friction of the paddle wheel, resulting in zero
power generation. In ideal conditions (assuming 3 = 60%
efficiency), the base case barge / paddle wheel would only generate ~1 kW of power for this low flow speed.
Results from tests with a wider wheel indicate that the wider wheel does not provide any significant improvement in power production for lower incident velocities which are more typical of conditions commonly encountered in rivers. Results from tests with a larger diameter wheel indicate that the larger diameter wheel increases power production by ~70% for the same incident velocity, as compared to comparable results for the smaller diameter wheel.
Throughout the testing program, many individual tests were repeated to ascertain the statistical variability of the power production estimates and the other measured and derived quantities, such as rotational speed, water levels, and current velocities. In addition to repeating some tests, a longer test duration was also checked to investigate the steadiness of the measured and derived quantities over time. Results from these investigations confirmed that while the velocity data is highly repeatable, the measurements of power output are slightly more variable. It should also be noted that the reliability of the experimental results presented in this article may also be impacted by scale effects.
The physical model tests provided a first order estimate of the potential power output for a full-scale hydrokinetic power barge. The power output is highly dependent on incident current velocity, with prototype power output ranging from approximately 1kW at 0.5 m/s up to approximately 280kW at 3.0 m/s. Therefore, the potential energy output of a prototype device is highly dependent on the flow speeds at the deployment location. Depending on positioning within the lower Mississippi River, the predicted power output for the base case design is estimated to range somewhere between 20kW and 40kW (including an efficiency of η3 = 60%, based
on results from the scale model tests). Considering the relatively modest power output and the significant costs associated with designing and fabricating a hydrokinetic power barge, the feasibility of such a system within the Mississippi River region is expected to be limited to applications which are considered remote (distant from
conventional power sources) and have a limited demand for power.
A prototype hydrokinetic power barge will need to include many additional design elements that were not examined in this study. These include for example: a control system to regulate wheel speed; a power take-off system to convert rotating mechanical power into electricity; and a debris screen at the water inlet designed to prevent large floating objects from entering the central water channel and jamming the rotating wheel without degrading power production.
ACKNOWLEDGMENTS
Funding from an anonymous source is gratefully acknowledged. The authors also acknowledge and thank the technicians at NRC who contributed to the experiments discussed in this article.
REFERENCES
[1] Baker, S. & Cornett, A. (2013). 3D Physical Model Study of a Hydrokinetic Power Generation Barge. NRC-OCRE Controlled Technical Report. Ottawa, Canada.
[2] Batten, W.M.J., & Müller, G.U. (2011). Potential for using the Floating Body Structure to increase the efficiency of a Free Stream Energy Converter. Proc. 34th IAHR World Congress, Brisbane, Australia.
[3] Batten, W., et al. (2011). Design and stability of a floating Free Stream Energy Converter. Proc. 34th IAHR World Congress, Brisbane,
Australia.
[4] Müller, G.U., Denchfield, S., Marth, R., & Shelmerdine, B. (2007). Stream Wheels for Applications in Shallow and Deep Water. Proc. IAHR (Vol. 32, No. 2, p. 707).
[5] Muller, G.U., Jenkins, R., & Batten, W.M.J. (2010). Potential, Performance Limits and Environmental Effects of Floating Water Mills. Proc. River Flow 2010, International Conference on Fluvial Hydraulics, Braunschweig, Germany.
[6] Khan, M.J., Iqbal, M.T., & Quaicoe, J.E. (2008). River Current Energy Conversion Systems: Progress, Prospects, and Challenges. Journal of Renewable and Sustainable Energy (Vol. 12, p. 2177).
[7] Senior, J., Wiemann, P., & Müller, G.U. (2008). The Rotary Hydraulic Pressure Machine for very low head Hydropower Sites. Proc. International Conference on Small Hydropower, Bled, Slovenia. [8] Tevata, A., & Inprasit, C. (2011). The Effect of Paddle Number and
Immersed Radius Ratio on Water Wheel Performance. Proc. 9th
Eco-Energy and Materials Science and Engineering Symposium, Chiang Rai, Thailand.