HAL Id: hal-01199850
https://hal-univ-perp.archives-ouvertes.fr/hal-01199850
Submitted on 18 Feb 2021
HAL is a multi-disciplinary open access
archive for the deposit and dissemination of
sci-entific research documents, whether they are
pub-lished or not. The documents may come from
teaching and research institutions in France or
abroad, or from public or private research centers.
L’archive ouverte pluridisciplinaire HAL, est
destinée au dépôt et à la diffusion de documents
scientifiques de niveau recherche, publiés ou non,
émanant des établissements d’enseignement et de
recherche français ou étrangers, des laboratoires
publics ou privés.
An annual survey of bacterial production, respiration
and ectoenzyme activity in coastal NW Mediterranean
waters: temperature and resource controls
B. Céa, Dominique Lefèvre, L. Chirurgien, Patrick Raimbault, N. Garcia, B.
Charrière, Gérald Grégori, J. F. Ghiglione, A. Barani, M. Lafont, et al.
To cite this version:
B. Céa, Dominique Lefèvre, L. Chirurgien, Patrick Raimbault, N. Garcia, et al.. An annual survey
of bacterial production, respiration and ectoenzyme activity in coastal NW Mediterranean waters:
temperature and resource controls. Environmental Science and Pollution Research, Springer Verlag,
2015, 22 (18), pp.13654-13668. �10.1007/s11356-014-3500-9�. �hal-01199850�
An
annual survey of bacterial production, respiration
and
ectoenzyme activity in coastal NW Mediterranean waters:
temperature
and resource controls
B. Céa& D. Lefèvre & L. Chirurgien & P. Raimbault & N. Garcia& B. Charrière & G. Grégori & J. F. Ghiglione & A. Barani& M. Lafont & F. Van Wambeke
Abstract We simultaneously measured bacterial production (BP), bacterial respiration (BR), alkaline phosphatase activity (phos) and ectoaminopeptidase activity (prot) in relation to biogeochemical parameters, nutritive resources and in situ temperature over a 1-year survey at the long-term observatory the SOLEMIO station (Marseille bay, NW Mediterranean Sea). Despite its proximity to the coast, oligotrophic condi-tions prevailed at this station (yearly mean of Chl a = 0.43 μg dm−3, NO3= 0.55 μmol dm−3 and PO4=
0.04μmol dm−3). Episodic meteorological events (dominant winds, inputs from the Rhone River) induced rapid oscilla-tions (within 15 days) in temperature and sometimes salinity that resulted in rapid changes in phytoplankton succession and a high variability in C/P ratios within the particulate and dissolved organic matter. Throughout the year, BP ranged from 0.01 to 0.82μg C dm−3h−1and bacterial growth effi-ciency varied from 1 to 39 %, with higher values in summer.
Enrichment experiments showed that BP was limited most of the year by phosphorus availability (except in winter). A significant positive correlation was found between in situ temperature, BP, BR and phos. Finally, we found that temperature and phosphate availability were the main factors driving heterotrophic bacterial activity and thus play a fundamental role in carbon fluxes within the marine ecosystem.
Keywords Bacterial production . Bacterial respiration . Bacterial growth efficiency . Ectoenzymes . Phosphorus limitation . SOLEMIO . NW Mediterranean Sea
Introduction
The dissolved organic carbon (DOC) pool is recycled into new biomass via heterotrophic bacterial production, BP which represents an entry for particulate organic carbon (POC) into the aquatic food web and CO2metabolic production through
remineralisation, i.e. bacterial respiration (BR). The magni-tude of DOC flow through the heterotrophic bacterioplankton remains largely unknown because measurements of BP are seldom accompanied by BR measurements (Jahnke and Craven1995). The bacterial growth efficiency (BGE) relates to the efficiency of the conversion, from dissolved to particu-late organic carbon, according to the equation: BGE=BP/ (BP+BR). While BGE characterises the dynamics of hetero-trophic bacteria, its estimation has a large degree of uncertain-ty (Jahnke and Craven1995). Cole and Pace (1995) proposed that the high BGE variability may not be random but related to environmental constraints such as nutrient availability or or-ganic substrate quality. Moreover, a consistent increase in BGE was found along gradients of productivity in aquatic systems, suggesting that BGE may be controlled by resources
B. Céa (*)
:
D. Lefèvre:
L. Chirurgien:
P. Raimbault:
N. Garcia:
B. Charrière
:
G. Grégori:
A. Barani:
M. Lafont:
F. Van WambekeMediterranean Institute of Oceanography (MIO) UMR 7294, Aix-Marseille Université, Université de Toulon, IRD, CNRS, Marseille, France
e-mail: benj.cea@gmail.com
B. Charrière
:
G. GrégoriCentre de Formation et de Recherche sur les Environnements Méditerranéens, University Perpignan Via Domitia, UMR5110, Perpignan, France
G. Grégori
:
J. F. GhiglioneLaboratoire d’Océanographie Biologique de Banyuls, CNRS, UMR
7621, Banyuls-sur-Mer, France
G. Grégori
:
J. F. GhiglioneLaboratoire d’Océanographie Microbienne, Observatoire
Océanologique, Sorbonne Universités, UPMC Université Paris 06, UMR 7621, Banyuls-sur-Mer, France
(Del Giorgio and Cole1998). Other authors discussed the potential effects of temperature on BGE (Rivkin and Legendre2001; Apple et al.2006; López-Urrutia and Morán
2007; Kritzberg et al.2010b; Berggren et al.2010), but the relative importance of temperature and resources have not been explored.
Overall, bacterial processes are influenced by the quantity and quality of the organic substrate, as well as the availability of inorganic nutrients. For example, some substrates require enzymatic hydrolysis before uptake (Middelboe and Søndergaard1993), and different organic molecules exhibit different energy to C ratios, which limits their utilisation by bacteria and therefore influence the bacterial growth efficiency (Vallino et al. 1996). According to the eco-logical Redfield stoichiometric theory, it has been shown that BGE decreases with increasing C/N and C/P ratios of the natural organic substrates (Kroer
1993; Vallino et al. 1996). Under such conditions, ad-dition of inorganic nutrients stimulated the organic mat-ter uptake by bacmat-teria and the BGE (Kroer 1993; Kragh et al. 2008). As a consequence, heterotrophic bacteria living in oligotrophic oceans could compete with phy-toplankton for mineral nutrients, such as N in the South Pacific (Torréton et al. 2000; Van Wambeke et al. 2008) and P in the Sargasso Sea (Cotner et al.1997; Sebastian and Ammerman2009). In the Mediterranean Sea, which is one of the most oligotrophic areas of the world’s ocean, inorganic phosphorus has been shown to limit both phytoplankton and heterotrophic bacteria growth in certain areas (Krom et al. 1991; Zweifel et al. 1993; Thingstad et al. 1998; Christakill et al. 1999; Pinhassi et al. 2006) and over large longitudinal gradients (Van Wambeke et al. 2002).
In the NW Mediterranean Sea, a network of long-term observatory stations have been developed incorporating dif-ferent habitats where the seasonal changes of BP in relation to physical and biogeochemical parameters have been investi-gated from one to several years (Pinhassi et al.2006; Alonso-Sáez and Gasol2007; Alonso-Saez et al.2008; Lami et al.
2009). Seasonal changes in BGE and ectoenzymatic activities have been less frequently investigated (Del Negro et al.2008; Alonso-Saez et al.2008). Here we investigated the seasonal variation of several components of the carbon flux mediated by heterotrophic bacteria in relation to biogeochemical chang-es at the long-term observatory SOLEMIO station (Marseille bay, NW Mediterranean Sea) by sampling surface seawater every 15 days over a year. Information on the substrate quan-tity and quality was provided by the biochemical composition of the organic pools (particulate and dissolved C, N, P stocks). We simultaneously measured BP, BR, alkaline phosphatase activity (phos) and ectoaminopeptidase activity (prot). We evaluated the influence of phosphorus (P), nitrate (N) and carbon (C) on BP in bioassay incubations.
The hydrodynamics of the Marseille Bay is complex and controlled by:
1. Two dominant winds: north–northwesterly (The Mistral), which favours upwelling from the “Cote Bleue” to the “Calanques,” and south-easterly winds, which favour downwelling. Minas (1968) showed that primary produc-tion tripled at a coastal staproduc-tion influenced by upwelling compared with a reference offshore station.
2. The oligotrophic North Mediterranean Current (NMC), which flows along the continental slope towards the west (Millot1990) can occasionally intrude on the shelf (Millot and Wald1980; Gatti2008).
The Rhône River mouth is situated 40 km westward from the Marseille Bay. According to observations (Broche et al.
1998) and modelling studies (Estournel et al.2001; Reffray et al. 2004; Fraysse et al. 2013), the Rhône river plume exhibits most of the time a predominant westwards direction and, under those conditions, does not impact the Marseille Bay. However, a less common orientation toward the east has also been observed (Gatti et al. 2006; Fraysse et al. under review). The eastward extent is explained by different factors not necessarily related solely to the eastern winds, and includ-ing: Rhône river discharge volume, wind shifts and forcings, presence of a mesoscale eddy in the area, and variation in the thermocline depth (Fraysse et al.,under review). An inventory of Rhône River intrusion events into the Bay of Marseille during the years 2007 to 2011 show an average of only 7.6 intrusions per year with a variable duration from 3 to 10 days (Fraysse et al.2014).
Materials and methods
Study area and sample collection A time series study was established from January 2012 to February 2013, sampling sea water from the SOLEMIO station located in the Marseille bay (N 43°14′30″ and E 05°17′30″, 60 m depth) (Fig.1), NW Mediterranean Sea. This station belongs to the SOMLIT network (http://somlit.epoc.u-bordeaux1.fr/fr/) which records a time series of several environmental parameters throughout the seasons from March 1994. Sampling was performed bi-monthly aboard the R.V. Antedon II using a 20 dm3Niskin bottle coupled to a Seabird CTD system (SBE 19) for pres-sure, temperature, conductivity (salinity), fluorescence (chlo-rophyll a) and dissolved oxygen measurements. Our data set is limited to sampling at the surface (1 m<S<5 m). Sea water was collected into 2 dm3polycarbonate bottles, stored in the dark in a portable incubator and set at in situ surface temper-ature. In the laboratory, samples were processed no more than 2 h after sampling.
Chemical analysis A major advantage of sampling at the SOLEMIO station, from the SOMLIT network, is that bio-geochemical variables have been measured and recorded since January 2000. Thus, we had access to historical data temper-ature, salinity, chlorophyll a concentration (Chl a), nitrate, phosphorus, orthosilicic acid (NO3, PO4, SiOH4,
respective-ly), particulate organic carbon and nitrogen (POC and PON). During our study, other environmental variables (total nitro-gen, total phosphorus, particulate phosphorus) were per-formed. Chl a concentrations were determined by spectrofluorimetry (limit of detection of 0.05μg dm−3and, reproducibility of 5 %) following the method of Raimbault et al. (2004). NO3, PO4, SiOH4, TON and TOP concentrations
were measured by a Technicon AutoAnalyzer® (limit of de-tection of 0.5, 0.020, 0.1, 0.1, 0.03μmol dm−3, respectively with a reproductibility of 5 %) following the method of Tréguer and Le Corre (1975) and Raimbault et al. (1990). POC and PON concentrations were determined by combus-tion of particulate matter recovered after filtracombus-tion (GF/F Whatman® filter 25 mm). The combustion of organic matter product CO2, CO (if combustion is incomplete) and NOx
which are converted in CO2 and N2 then separate by gas
chromatography and quantified by TCD (Thermal Conductivity Detector) detector type (limit of detection of 10 and 5 μg dm−3, respectively and, reproducibility of 10 %) follows the method of Aminot and Kérouel (2004). DON and DOP concentrations were derived from TON minus
(PON+NO3+NO2+NH4) concentrations, and from TOP
mi-nus (POP+PO4) concentrations, respectively. Samples for
POP analysis were determined by Chemical wet-oxidation (limit of detection of 0.005μmol dm−3with a reproducibility of 10 %) following the method of Raimbault et al. (1999). For this method, 250 cm3 of sea water was filtered from each depth through glass microfiber filters. TOC samples were collected in pre-combusted (450 °C for 4 to 5 h) glass am-poules, immediately acidified with a drop of 1 μmol dm−3 orthophosphoric acid, flame-busted and stored at−4 °C until analysis. TOC analysis were performed using high tempera-ture combustion on a Shimadzu® TOC-5000 total organic carbon analyzer (limit of detection of 0.1 μmol dm−3 and reproducibility of 2 %) following the method of Cauwet
1994. All DOC concentrations reported were derived from the difference between TOC and POC concentrations from each sample.
Prokaryote and phytoplankton counting Flow cytometry anal-yses were carried out at the PRECYM flow cytometry plat-form (https://precym.mio.univ-amu.fr/). Samples were analysed using a FACSCalibur (BD Biosciences® San Jose, CA). For heterotrophic bacterial abundance (BA), 1.8 cm3of sea water was fixed with formaldehyde (2 % final concentration, 15 min incubation at RT) frozen and stored in liquid nitrogen until analysis in the laboratory. After rapid thawing, samples were incubated with SYBR Green II
Fig. 1 Study site (SOLEMIO) location in the Marseille Bay, France, NW Mediterranean Sea. NMC: North Mediterranean Current
(SIGMA, final conc. 0.05 % [v/v] of the commercial solution, for 15 min, at 20 °C in the dark) in order to stain the nucleic acid and analysed according to Marie et al. (1997). Prochlorococcus were excluded from the counts, thanks to their red fluorescence which is induced by photosynthetic pigments.
Some of the phytoplankton, the ultraphytoplankton (Synechococcus, Prochloroccocus, picophytoeukaryotes and nanophytoeukaryotes) were analysed using flow cytometry to determine abundance. The 4.5 cm3of seawater was collected, and samples were processed as for bacterial samples (fixation with formaldehyde, freezing and storage in liquid nitrogen). In the present study, the red fluorescence of the cells (>650 nm, ChloroA) related to the chlorophyll a content of phytoplank-ton cells. These cells were also characterised by three other optical signals: forward scatter (FSC) related to cell size, side scatter (SSC) related to cell structure and orange fluorescence (564–606 nm-PE) related to phycoerythrin using the tech-niques found in Grégori et al. (2001).
All data were collected using the CellQuest software (BD Biosciences®), and the analysis of the bacteria and the ultraphytoplankton groups were performed using SUMMIT v4.3 software (Beckman Coulter®). TruCount beads (BD Biosciences®) were added to the samples to accurately deter-mine the volume analysed. Polystyrene beads (2μm in diam-eter) were used as an internal standard and to discriminate between picoplankton (<2μm) and nanoplankton (>2 μm) populations (Fluoresbrite YG, Polyscience). Diatom quantifi-cation was carried out by microscopy using the Lugol-fixed samples. Identification and counting of nano- and microplank-ton was carried out by direct observation using an inverted microscope according to Utermöhl method.
BP, CR, BR and BGE Bacterial production (BP) was estimated using the 3H-leucine (Leu) incorporation technique (Kirchman et al.1985), adapted to the centrifugation method (Smith and Azam1992). For each sample, triplicate aliquots (1.5 cm3) and one trichloroacetic acid (TCA) killed control were incubated with a mix of 6 nmol dm−3hot leucine (L-[3H] leucine, Perkin Elmer® specific activity ranging 107– 144 Ci mmol−1) and 14 nmol dm−3cold leucine in the dark, at in situ temperature, for 2 h. Preliminary experiments con-firmed that leucine incorporation was linear during this period. The live incubations were terminated with 5 % TCA (final concentration). After three runs of centrifugation/aspiration of the supernatant (once with the fixed sea water sample, once with a 5 % TCA rinse, once with an 80 % ethanol rinse), the pellet was resuspended in Packard Ultima Gold MW Scintillation liquid®. Radioactivity was counted using a Liquid Scintillation Analyzer Packard® 2100 TR, and the 3H counting efficiency was corrected for quenching. Concentration kinetic experiments showed that isotopic dilu-tion was negligible when using 20 nmol dm−3leucine, and
thus, BP rates were calculated from leucine incorporation rates using the conversion factor of 1.5 kg C mol−1 leucine and given in micrograms carbon per cubic decimeters per hour. Daily rates were calculated assuming they are 24 times the hourly rate.
Community respiration (CR) was determined from non-filtered sea water using the Winkler method and given in micrograms carbon per cubic decimeters per hour. Four repli-cate 125 cm3borosilicate glass bottles were carefully filled, and four other replicates were immediately fixed with Winkler reagents to determine the initial oxygen concentration. The replicate bottles were incubated in the dark, at in situ temper-ature, and fixed with Winkler reagents after 24 h. Dissolved oxygen measurements were made using an automatic colori-metric endpoint detector (Williams and Jenkinson1982). The respiration rate was determined by dividing the oxygen con-centration difference (initial−final) by the incubation time, assuming a linear consumption of oxygen with time. In order to determine the bacterial respiration rate (BR), incubations were performed on filtrate that had passed through a 0.6μm polycarbonate filter. BR was on average 90 % of CR (n=4), which is a mean value of 67±9 % greater than previously observed in the open NW Mediterranean Sea (Lemée et al.
2002). The fraction of CR attributed to BR could be overestimated with the classical method of filtration. Aranguren-Gassis et al. (2012) found the following relation-ship: BR=0.3×CR from in vivo ETS experiments in two contrasting environments: the highly productive Ría de Vigo (NW Spain) and the North Atlantic oligotrophic gyre. This fraction can also vary during incubation with some changes in the bacterial community composition (Massana et al.2001). Applying a constant BR fraction from 30 % to 100 %, the absolute BGE values would vary, but the seasonal trend of BGE would not change. Having no systematic seasonal esti-mates of BR, we kept 0.9 to calculate the BR fraction for the whole period of this study. We assumed a respiratory quotient of 0.8 (del Giorgio and Williams2005). Thereby, owing to the difficulty of estimating the BR fraction within CR, BGE was calculated as BGE = BP/(BP + 0.9 × CR) with BP and BR expressed in micrograms carbon per cubic decimeters per hour and where CR was calculated from the incubations described above and BP was determined using the incorporation of leucine in non-filtered sea water at each depth at the sampling time. Due to technical problems, accurate measurements of respiration rates started only in March 2012.
Ectoenzymatic activity Alkaline phosphatase activity (phos) was measured fluorometrically using methylumbelliferone phosphate (MUF-P) following the method of Hoppe 1983. The 30 mm3of a 0.1 mmol dm−3MUF-P solution was added to 3 cm3of seawater sample and then aliquoted into a 1-cm PMMA cuvette for measurement. Stock solutions of 5 mmol dm−3 MUF-P in methylcellosolve were stored at
−20 °C and diluted with boiled filtered sea water prior to use. The linear increase in fluorescence in the sea water samples with added MUF-P was measured over the incubation time (from 2 to 5 h), in the dark at in situ temperature (excitation at 365 nm and emission at 460 nm), using a Kontron® SFM 23B spectrofluorometer. Calibration curves were made using MUF standards diluted in boiled seawater. The kinetic coefficients were determined on surface sea water samples using a range of concentrations of MUF-P from 25 to 1,000 nmol dm−3. The Michaelis–Menten equation was used to determine kinetic coefficients:V=(Vm×S)/(Km+S), where S is the MUF-P con-centration and V the hydrolysis rate. Vm (nanomoles per cubic decimeters per hour) and Km (nanomoles per cubic decime-ters) have been specified from a non-linear regression calcu-lated with the PRISM software. Then, the Km/Vm ratio en-abled the estimation of the Turnover time (hours) of the enzymatic reaction. Blanks were run by adding the MUF-P to filtered boiled sea water and were shown to be insignificant. Protease activity (prot) was determined by measuring the hydrolysis rate of L-leucine-4-methyl-7-coumarinylamide (leu-MCA, Sigma), which is used as an analogue substrate for natural peptides (Hoppe 1983). Stock solutions of 10 mmol dm−3leu-MCA were prepared in methylcellosolve and kept at−20 °C. As for phos, concentration kinetics were undertaken for sea surface layers, but using a range of con-centrations of leu-MCA from 0.5 to 400 μmol dm−3 and setting the excitation to 380 nm and the emission to 440 nm. Samples for prot were incubated, in the dark, at in situ tem-perature during the analysis time. Phos and prot were deter-mined from non-filtered sea water, and only Vm was con-served in the time series with their corresponding Km. Enrichment experiments The availability of phosphorus (P), nitrate (N) and carbon (C) in the sea water column was investigated by measuring changes in bacterial production following additions of PO4 (0.25 μmol dm−3 P), NO3and
NH4(1μmol dm−3each) or glucose (10μmol dm−3C) (final
concentrations). Several bioassays were realised: P, N, C, PN, PC, NC and PNC including the non-enriched control (T). Each bioassay condition was made in triplicate in 60 cm3 polycarbonate bottles incubated at in situ temperature, in the dark over 48 h. Following incubation, each bottle was sub-sampled in order to measure BP. BP subsamples were deter-mined with the leucine technique described above using the same temperature conditions as for the bioassays (in the dark, for 2 h).
Statistical analysis Our observations were log-transformed to stabilise the heterogeneity of variance before computing sta-tistics. We used a ttest for listing significant differences (p<0.05) between different combinations of enrichment ex-periments. From matrices of linear correlation, we examined partial correlation coefficients (r) between the heterotrophic
bacterial rates (BP, BR, phos and prot), in situ temperature and Chl a. As the number of observations differs for each variable, we carried out the analysis on a set of three or four variables at a time, based on the common number of observations. The significance of r was considered for p=0.05, p=0.01 and p= 0.001 according to the degree of freedom (df=n–k−2 with k= number of variables and n=number of observation).
Results
Environmental factors The SOLEMIO station (depth 60 m) is situated in the Gulf of Lion (North Western Mediterranean Sea) to the south of the Marseille Bay 6 km off the coast, next to the Frioul Island. The hydrodynamics are mostly governed by the winds, general circulation of the NMC, bathymetry and the Rhône river influence. The wind direction compass (Fig.2) showed two major winds: north westerly or the mistral and south easterly winds. The water temperature at the sea-surface varied between 12.8 °C in January and 25.8 °C in August (Table 1 and Fig. 3a) with a cooling event in July (15.7 °C) caused by the mistral. Salinity was homogeneous over the water column (38.15±0.02) except during the sum-mer stratified condition where one lower salinity event (offset with the cooling event) was recorded in July (37.5 in upper layers, Fig.3b) which appeared to be induced by a freshwater Rhône intrusion towards the Marseille Bay (http://www. previmer.org). Indeed, salinity <37.8 is considered as a threshold for an intrusion of Rhône River waters into the bay of Marseille (Gatti et al.2006; Pairaud et al.2011).
Chl a was generally low and varied between 0.2 and 0.5 μg dm−3at the sea-surface, except in late February and March when values reached 1.43μg dm−3(Fig.3c). Highest SiOH4, NO3and PO4concentrations (between 1.5μmol dm−3
and 2.09μmol dm−3, 0.08μmol dm−3and 0.10μmol dm−3 and 2 μmol dm−3 and 3.57μmol dm−3, respectively) were observed (Fig. 4a, b and c) during the winter (January and February 2012, 2013) characterised by a homogeneous water column (data not shown), rich in nutrients (NO3, PO4and
SiOH4) and under the effect of the mistral and a few strong
southeasterly wind events. Inversely, when summer arrived, stratification of the water column occurred, with lower nutri-ent concnutri-entrations (NO3, PO4 and SiOH4), with a period
showing shifts between a calm and a few events period of low mistral and southeasterly winds. Summer is characterised by the lowest NO3 and PO4 concentrations (below
0 . 5 μmol dm− 3 a n d b e l o w d e t e c t i o n l i m i t s o f 0.03μmol dm−3, respectively). Despite a period of depletion, SiOH4 was always higher than 1μmol dm−3in the deeper
layers (data not show) and increased progressively and earlier (in October) than NO3and PO4, this being visible particularly
O rg a n i c m a t t e r ( C , N , P ) Three peaks of DOC (>130μmol dm−3) were observed in January, March, August and November (Fig.4d) whereas the lowest concentrations (<50μmol dm−3) were measured in March and April. DON increased from 4 to 11μmol dm−3(Fig.4e) during the survey with lowest values observed in January and February 2012 and highest values during the summer stratified conditions. DOP concentrations stayed low throughout the survey (<0.6μmol dm−3) and ranged from 0.08 μmol dm−3at the beginning of the cruise to 0.56μmol dm−3at the end (Fig.4f). POC concentrations increased from the spring bloom period to reach its highest values in May, June and August and decreased from September down to 2μmol dm−3in winter (Fig.4g). From September to February 2013, the POC average concentration was 3.08μmol dm−3±0.17. Similarly, PON concentrations be-gan to increase from the spring bloom period and reached a maximum during the stratified period in August and decreased from September to homogenise around 0.51μmol dm−3±0.03 during the winter mixed period (Fig.4h). POC and PON showed their lowest values in July (0.87 and 0.21μmol dm−3, respec-tively). There were three periods of high POP concentrations (>0.05μmol dm−3): the spring bloom period (in March), the stratified period in summer (June, July and August) and the mixed period in winter (December, January and February 2013) (Fig.4i). POC/PON ratios were stable, around 6.7±0.4 with a decrease at the end of the survey (about 4). POC/POP ratios ranged from 13 to 348, and PON/POP ratios from 3 to 53 during the survey. For dissolved organic matter, the annual average DOC/DON ratio was 10±1, that of DOC/DOP ratio
306±55 and DON/DOP 31±4. Annual variability of C/N, C/P and N/P ratios for particulate organic matter were higher than those of dissolved organic matter (32 % versus 20 %, 64 % versus 60 % and 61 % versus 51 %, respectively).
Cell abundance Cell abundance is characterized by a succes-sion of phytoplanktonic and bacterioplanktonic populations. Indeed, the maximal abundance of diatoms occurred in March (Fig. 5a) with the beginning of the spring phytoplankton bloom (from February to May). Then, their abundance dropped rapidly and remained low for the rest of the survey (<1,000 cell dm−3) except for two peaks in July and August. The abundance of picophytoplankton (cells < 2μm in size) increased during mixing (from December to February 2013) and during the spring phytoplankton bloom. The abundance of nanophytoeukaryotes was relatively stable, except for some small increases in April and August and from December to February 2013. The abundance of Synechococcus reached its maximum in April and May after the spring phytoplankton bloom, then in August during the stratification period (Fig.5b). The abundance of Prochlorococcus was low during the spring phytoplankton bloom but increased from August to December. Heterotrophic bacteria (BA) were at a maximum (peaked) at the end of the spring phytoplankton bloom (late March and April) with some peaks in May and June, remain-ing stable durremain-ing other periods (Fig.5c). The first phase of this bloom was dominated by diatoms and picophytoplankton whose growth stopped following the depletion of SiOH4in
the water column. This is followed by a change in
Fig 2 Wind direction compass from January 2012 to February 2013 at the SOLEMIO station
phytoplankton dominance with the arrival of non-siliceous organisms the cyanobacteria (Synechoccocus and Prochloroccocus) and then an increase in heterotrophic bacte-ria. Thus, the transition period between mixed and stratified conditions is marked by a spring phytoplankton bloom characterised by maximum Chl a, NO3and PO4
tions together with high particulate organic matter concentra-tions (C, N, P).
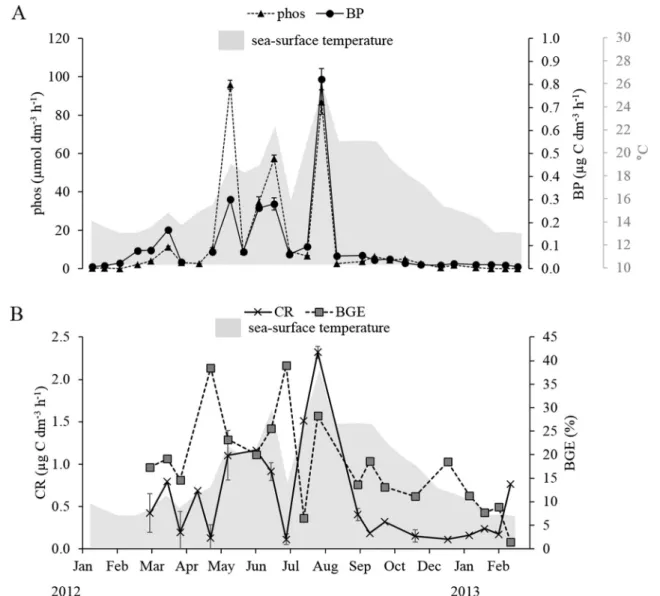
Heterotrophic bacterial activity and growth efficiency The highest BP values (>0.2μg C dm−3h−1) were observed during the summer (late May, June, July and August) with a smaller BP increase (0.05 to 0.2μg C dm−3h−1) during the spring bloom period ( in March and April) in the upper layers (Fig.6a). Maximum CR values (>1 μg C dm−3 h−1) were observed during the summer period (from May to August) (Fig.6b). During the remainder of the survey, CR varied from 0.2 to 0.8μg C dm−3h−1.
The lowest BGE (1 % to 10 %) were generally obtained in winter (from October 2012 to February 2013), whilst the highest BGE (20 % to 39 %) was found, during summer
(Fig.6b). However, a low BGE (5 %) was found in August, during the temperature peak (25.8 °C) coinciding with a period of delayed increase in BP with regard to BR. During the spring bloom (March, April), BGE was around 15 %.
Maximum rates of phos occurred in the summer (Fig.6a) especially within surface layers (late in May, June, July and early in August), during stratification where the water column was P-limited (Table2). However, phos had already started to increase during the spring bloom period with values >4 nmol dm−3h−1. Like phos, prot reached its highest values in summer (July and August) (Table 2). Lower prot (<20 nmol dm−3h−1) values were observed during the winter. Cell-specific MCA-Leu hydrolysis rates at the SOLEMIO station ranged between 15 and 131×10−18 mol MCA-Leu cell−1h−1, and cell-specific MUF-P hydrolysis ranged from 0.3 and 163×10−18mol MUF-P cell−1h−1.
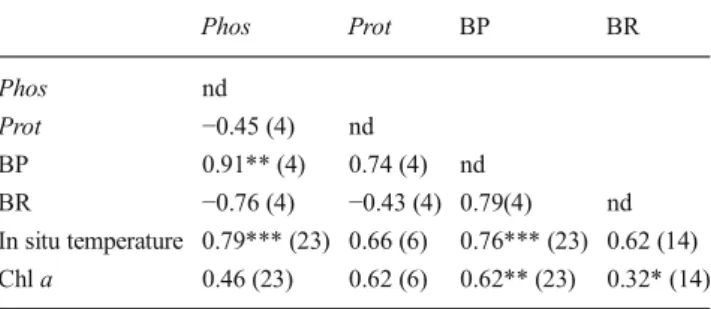
The coefficients of partial correlation (Table3) calculated from respective correlation matrices (data not shown) revealed that (1) only phos and BP showed a significant relationship independently to prot and BR (r (BP-phos)= 0.91, df= 4, p<0.01), (2) BP, BR and phos were correlated with in situ
Table 1 Summary of the vari-ables measured in sea-surface waters at the SOLEMIO station from January 2012 to February 2013 showing observation period, maximum value, minimum value, average and SE
aValues cited excluding three
outliers; see discussion
Sea-surface variable Period Min Max Average (±SE)
Environmental factors
Temperature (°C) Jan 12–Feb 13 12.8 25.8 16.7 (±0.7)
Salinity (psu) Jan 12–Feb 13 37.53 38.37 38.15 (±0.03)
Chl a (μg dm−3) Jan 12–Feb 13 0.13 1.43 0.43 (±0.07)
Nitrate (μmol dm−3) Jan 12–Feb 13 0.00 2.09 0.55 (±0.13)
Phosphorus (μmol dm−3) Jan 12–Feb 13 0.00 0.10 0.04 (±0.01)
Silicate (μmol dm−3) Jan 12–Feb 13 0.18 3.57 1.84 (±0.14)
Organic matter (μmol dm−3)
DOCa Jan 12–Feb 13 46 104 75 (±5)
DON Jan 12–Feb 13 4 11 7 (±1)
DOP Jan 12–Feb 13 0.08 0.56 0.31 (±0.04)
POC Jan 12–Feb 13 0.87 14.15 5.53 (±0.64)
PON Jan 12–Feb 13 0.21 3.10 0.88 (±0.12)
POP Jan 12–Feb 13 0.018 0.070 0.040 (±0.005)
Cellular abundance
Heterotrophic bacteria (×105cell cm−3) Jan 12–Feb 13 2.467 14.020 5.716 (±0.499)
Synechococcus (×105cell cm−3) Jan 12–Feb 13 0.046 1.357 0.416 (±0.091)
Prochlorococcus (×105cell cm−3) Jan 12–Feb 13 0.018 0.567 0.180 (±0.037)
Picophytoplankton (×105cell cm−3) Mar 12–Dec 12 0.003 0.163 0.051 (±0.010)
Nanophytoeukaryotes (×105cell cm−3) Jan 12–Feb 13 0.010 0.044 0.022 (±0.002)
Diatoms (×105cell dm−3) Mar 12–Dec 12 0.00 1.41 0.11 (±0.07)
Heterotrophic bacterial activities
Bacterial production (μg C dm−3h−1
) Jan 12–Feb 13 0.01 0.82 0.10 (±0.03)
Community respiration (μg C dm−3h−1
) Mar 12–Feb 13 0.11 2.32 0.59 (±0.13)
Phos (Vm: nmol dm−3h−1) Jan 12–Feb 13 0.1 116.5 15.7 (±6.0)
Prot (Vm: nmol dm−3h−1) Mar 12–Feb 13 5.1 85.1 28.0 (±8.8)
temperature independently to Chl a (r (BP-in situ tempera-ture)=0.76, df=23, p<0.001; r (BR-in situ temperature)= 0.62, df=14, p<0.05; r (phos-in situ temperature)=0.79, df= 23, p < 0.001); and (3) only BP was correlated to Chl a independently to in situ temperature (r (BP-Chl a)=0.62, df=23, p<0.01).
Bacterial response to nutrient enrichment The highest in-crease in BP relative to the control was recorded in the PNC-amended bottles and ranged from ×0.7 to ×40.6 (Table4). Overall, there was a significant stimulation in BP following P addition (in 7 out of the 14 surveys) while only one stimulation was observed from N addition (February 2013) and two cases from C addition (January 2012 and October). BP was significantly stimulated when two different
nutrients were added: PC in March and April and PN, NC in December. It was never necessary to add the three elements PNC together to trigger a stimulation of BP.
Discussion
Heterotrophic bacterial activity and BGE Overall, the range of BP and CR recorded at the long-term coastal observatory SOLEMIO station (from 0.01 to 0.82μg C dm−3h−1and from 0.11 to 2.32μg C dm−3h−1, respectively) were close to BP and BR encountered at the coastal observatory of Blanes bay (NW Mediterranean Bay) (from 0.01 to 0.85μg C dm−3h−1 and from 0.17 to 2.00μg C dm−3h−1, respectively) (Alonso-Sáez et al.2008). However, prot hydrolysis rates at SOLEMIO (5.1 to 85.1 nmol dm−3h−1) were lower when compared with the Blanes station (from 133 to 1150 nmol dm−3 h−1). The difference could be that we measured Vm kinetics with concen-trations of up to 400μmol dm−3of MCA-leu added, whereas
Fig. 3 (a) Temperature, (b) salinity and (c) fluorescence vertical profilesat SOLEMIO station during the survey (January 2012 to February 2013). Dots indicate sampling depths. Above contour plots show sea surface discrete temperature, salinity and Chl a time series (courtesy of SOMLIT data base)
Fig. 4 Concentrations of (1) inorganic nutrients: orthosilicic acid (a), nitrate (b) and phosphate (c); (2) dissolved organic matter: DOC (d), DON (e) and DOP (f); and (3) particulate organic matter: POC (g), PON (h) and POP (i) at the SOLEMIO station during the survey
they used 100 μmol dm−3 as a single concentration. Even relative to bacteria abundance, activities were low, as reflected by cell-specific MCA-Leu hydrolysis rates at the SOLEMIO station. This may reflect the difference in trophic status be-tween the two stations. The Blanes bay has been shown to be mesotrophic whereas the Marseille Bay is more oligotrophic (Chl a 0.95±0.22μg dm−3vs. 0.43±0.07μg dm−3, PO40.07±
0.01 μmol dm−3 vs. 0.04 ±0.01 μmol dm−3, NO3 1.81 ±
0.63 μmol dm−3 vs. 0.55±0.13 μmol dm−3, respectively) (Alonso-Sáez et al.2008; Simó et al.2009). The range of BP and CR at the SOLEMIO station were similar to those found at the oligotrophic JGOFS-DYFAMED observatory, situated 28 miles offshore (from undetectable to 0.20μg C dm−3 h−1and
from 0.00 to 2.59 μg C dm−3 h−1, respectively), where prot activity remained low throughout the year (mean of 4.6± 1.5 nmol dm−3h−1) (Lemée et al.2002; Van Wambeke et al.
2009). The annual mean value (17±2 %) for BGE found at the SOLEMIO station was close to other studies in NW Mediterranean (Vázquez-Domínguez et al. 2007; Lemée et al. 2002; Alonso-Sáez and Gasol 2007), while Kritzberg et al. (2010a) observed much higher values (32 %, Table5). Such comparisons may take into consideration (1) FC and RQ are different according to the studies, (2) both leucine conversion factors and BR/CR ratios have been shown to vary throughout the seasons (Alonso-Sáez and Gasol 2007; Alonso-Sáez et al. 2008; Aranguren-Gassis et al. 2012) and
Fig. 5 Time series of abundance of (a) picophytoplankton, nanophytoeukaryote and diatoms, (b) cyanobacteria and (c) heterotrophic bacteria with Chl a at the SOLEMIO station during the survey
Fig. 6 Time series of (a) bacterial production and phosphatase activity and (b) community respiration and bacterial growth efficiency (BGE=BP/(BP+ 0.9×CR)) with sea-surface temperature at the SOLEMIO station during the survey
Table 2 Maximum hydrolysis rates (Vm) and half saturation constant (Km) of prot and phos measured during the survey (Jan-uary 2012 to Febr(Jan-uary 2013)
Time Prot Phos
Vm (nmol dm−3h−1) Km (μmol dm−3) Vm (nmol dm−3h−1) Km (μmol dm−3)
March 12 45.6 (±5.2) 102.1 (±31.1) 4.3 (±0.3) 114.0 (±24.6) April 12 12.4 (±0.6) 40.1 (±6.3) 3.6 (±0.1) 111.8 (±12.0) May 12 21.8 (±4.1) 122.5 (±56.4) 11.3 (±0.4) 117.9 (±14.0) July 12 85.1 (±4.2) 83.1 (±11.4) 67.5 (±2.6) 145.7 (±17.4) August 12 81.3 (±5.9) 63.6 (±14.0) 115.7 (±2.7) 346.1 (±19.5) September 12 12.2 (±0.7) 67.2 (±11.0) 3.0 (±0.2) 163.0 (±37.1) October 12 14.5 (±0.8) 62.1 (±10.0) 4.8 (±0.3) 131.0 (±23.0) November 12 7.39 (±0.9) 41.8 (±17.5) 2.9 (±0.4) 47.1 (±83.2) December 12 7.28 (±0.5) 42.2 (±10.0) 2.6 (±0.8) 471.2 (±318.1) January 13 16.9 (±2.9) 151.2 (±59.3) 0.7 (±0.1) 65.0 (±33.6) February 13 5.1 (±0.3) 35.5 (±8.5) 0.1 (±0.0) 273.8 (±86.3)
(3) the comparisons of prot is dependent on the choice of the final concentration of Leu-MCA (50 to 400 μmol dm-3 according above authors).
The effect of nutrients and labile carbon limitation The range of phos found at SOLEMIO was similar to that found in the open Mediterranean Sea along two longitudinal transects dur-ing June and July 1999 (from 0.62 to 12.60 nmol dm−3h−1) (Van Wambeke et al.2002). The very low PO4concentrations
and the higher phos activity from May to August suggested P limitation during summer. The cell specific phos hydrolysis rate increased from May to August as did the other activities, suggesting that phos activity did not depended on bacterial
abundance only. Indeed both phoA and phoX genes can be induced by heterotrophic and photosynthetic prokaryotes dur-ing P limitation (Sebastian and Ammerman2009), suggesting that all categories of organisms possessing these genes could be responsible for the phosphatase activity, as both are good markers of P stress conditions. Furthermore, enrichment ex-periments showed that phosphate limitation occurred over a longer time period, from March to November 2012. Labile carbon was added (glucose) during the enrichment experi-ments, alone or in combinations with N and P. BP in SOLEMIO was stimulated by labile carbon (i.e. glucose) alone, only in January 2012, but not during winter 2013. This suggests that, even under winter mixing conditions, labile carbon is not always the first limiting factor. P is the main limiting element; N is the second limiting element ex-cept in March and April where labile C is the second limiting element. Thus, our ecosystem is mainly P-limited. So far, we have no more arguments to say that the lability of DOC in terms or quality of C-organic molecules would influence BP more than the accessibility to N and P pools. The 48 h of confinement in the dark may be sufficient to create P stress as in situ organisms probably used P at a steady rate of delivery in these intermediary periods in March, May and August– November.
Prior to discussing the stoichiometry of the organic matter, we have to consider the high DOC value relevance for our ecosystem study. Three high DOC concentrations found dur-ing the cruise (179 μmol dm−3 in January 2012, 147 μmol dm−3 in March 2012 and 132 μmol dm−3 in November 2012 in Fig.4d) were not related to any salinity event and thus cannot be explained by intrusion of Rhône River into the Bay of Marseille during these periods. The SOLEMIO site being situated near to the coast, some anthro-pogenic influence could give punctual high DOC values. However, none of our biological or biogeochemical variables were related to these three high DOC values. Hence, we could not reject potential problem in contamination of some sam-ples. Therefore, these three high values of DOC are removed, and the new mean annual value of DOC is of 75 ± 5 μmol dm−3at 5 m, close to that of 67±7μmol dm−3 at 2 m found by Para et al. (2010) during the year 2007–2008.
Carbon, nitrogen and phosphate stoichiometry of the dis-solved organic matter was also higher than the Redfield ratio (DOC/DOP ratio range from 136 to 664, and with an average of 306, also DON/DOP ratio range from 18 to 68, and with an average of 31). Seasonal evolution of the particulate matter P stoichiometry was very variable (CV C/P 64 %, CV N/P 61 %), but ratios were always greater than the Redfield ratio, while the evolution of C/N was more steady over the year (32 %). All these results converged to a P limitation at the coastal oligotrophic SOLEMIO station for most of the year. In a marine ecosystem with P limitation, the P availability can limit both growth (Van Wambeke et al.2002) and respiration
Table 3 Partial correlation coefficients between in situ temperature, Chl a, phos, prot, BP and BR calculated from log-transformed data with probability values of p<0.05 (*), p<0.01 (**) and p<0.001 (***). Values in bracket are the degree of freedom for each partial correlation
Phos Prot BP BR Phos nd Prot −0.45 (4) nd BP 0.91** (4) 0.74 (4) nd BR −0.76 (4) −0.43 (4) 0.79(4) nd In situ temperature 0.79*** (23) 0.66 (6) 0.76*** (23) 0.62 (14) Chl a 0.46 (23) 0.62 (6) 0.62** (23) 0.32* (14)
Table 4 Enrichment factors relative to the corresponding unamended control after 48 h of incubation
Time xP xN xC xPN xPC xNC xPNC January 12 0.7 1.0 4.2a 1.0 4.5a 4.1a 9.1a February 12 1.0 1.3 1.1 0.9 1.1 2.1 1.4a March 12 2.3 1.0 1.2 2.0 6.3a 1.3 8.3a April 12 1.2 1.1 1.0 1.3 10.3a 0.9 7.1a May 12 10.0a 0.8 0.7 13.6a 11.4a 0.8 18.0a Jun 12 4.9a 0.8 0.8 12.7a 4.7a 1.0 0.9 July 12 3.7a 1.0 1.0 10.0a 7.6a 1.3a 11.1a August 12 6.0a 1.5 1.4 6.4a 5.2a 1.0 8.0a September 12 2.5a 1.2 1.1 3.6a 2.6a 0.9 4.1a October 12 15.4a 1.1 1.2a 23.8a 13.8a 0.9 25.7a November 12 7.3a 0.8 1.1 38.3a 16.5a 0.5 40.6a December 12 1.2 1.1 0.9 4.0a 1.1 1.7a 17.6a January 13 0.8 1.3 0.9 1.7 1.3 0.9 3.7a February 13 0.8 1.8a 1.0 nd 1.8 1.2 nd
xP: PO4alone, xN: NO3+NH4, xC: glucose alone, xPN: PO4+NO3+
NH4, xPC: PO4+glucose, xNC: NO3+NH4+glucose, xPNC: PO4+
NO3+NH4+glucose
a
Rate of BP after 48 h of amendment significantly different from that in the unamended control (ttest, p<0.05 and df=4)
(Obernosterer et al.2003). In our study, we found a positive correlation between BP and phos, but also between BP and Chl a, whereas BR was not correlated to Chl a. These results suggested that BP was more resource-dependent, relative to BR, as previously suggested (López-Urrutia and Morán
2007). Phosphate is necessary for protein synthesis, cell pro-duction and energy transport by bacteria (Kritzberg et al.
2010a). In deep sea environments, it has been suggested that phosphatase activity facilitates the hydrolysis of refractory molecules, giving them access to N or C for degradation by other enzymes (Hoppe2003). The presence of both prot and phos may favour access to organic matter (Hoppe et al.1988). The phos/prot ratio has been proposed as a relevant physio-logical indicator of the nutritional status of a biophysio-logical system (Sala et al.2001). In this study, the phos/prot ratio increased with the P-deficient nutrient addition but decreased in the N+ P balanced additions. This ratio increased from March to August when P limitation occurred and decreased over the rest of the year. These results suggest that phos and prot could give an ecological advantage to microorganisms capable of consuming organic matter when it is poor or refractory. Temperature effect Besides organic matter stoichiometry and lability, temperature impacted bacterial activity, as depicted by the significant positive correlation between in situ temperature and phos, BP and BR. The influence of temperature may not have the same impact on BP and BR, but generally resulted in a decrease in BGE (Daneri et al.1994; Rivkin and Legendre
2001; Apple et al.2006; Berggren et al.2010). For example, a seasonal study (March 2000 to January 2002) of 13 stations within a temperate estuary (ranging from 3 to 30 °C, Chesapeake Bay, USA), carried out by Apple et al. (2006), revealed that BR was mainly controlled by temperature, whereas both temperature and organic matter quality influenced BP and BGE resulting in a negative temperature response of BGE while another seasonal study by Kritzberg et al. (2010a) carried out between 2005 and 2008 in Majorca (Spain), where the temperature of the surface water varied between 14.4 and 28.2 °C, showed a significant relationship with in situ temperature for BR and BP. The authors
concluded that BP and BR are both affected by temperature, but BR more than BP. In our study, we could not find any relationship between BGE and temperature. However, the increase of BGE from May to late July coincided with the increase of BP and mostly with the strong increase of prot, thus resulting in a bacterial uptake of polymeric organic matter. Compiling several BGE data, Del Giorgio and Cole (1998) concluded that an unexplained source of BGE vari-ability was due to the regional and seasonal differences of quality and quantity of the organic matter. From winter to summer, bacterial activity varied more than twofold suggest-ing that temperature alone would not be sufficient to explain the variation of BP, BR, prot and phos. In the natural ecosys-tem, several parameters can act on these activities such as the availability of resources, predation, viruses or bacteria com-munity composition (del Giorgio and Cole1998; Cottrell and Kirchman 2000; Fischer and Velimirov 2002; Apple et al.
2006). Temperature could affect various processes within the microbial food web differently, like BP, BR, grazing or lytic activities (Sarmento et al. 2010; Bouvy et al.2011). So, the controlling factors of one process within an ecosystem, such as temperature, can only start to be understood by monitoring the multiple indirect interactions. The coupling can be assessed through sensitivity estimates of temperature control together with resource control on the heterotrophic activities during the season. Because in natural environments tempera-ture and resource controls are interacting together, it is neces-sary to get proper experimental data on the simultaneous effects of temperature (Q10) on both production and
respira-tion. This is further developed in a companion study (Céa et al.
under review).
Conclusion The simultaneous measurements of four different heterotrophic bacterial activities and BGEs with biogeochem-ical parameters helped to highlight their strong variation throughout the season in relation to resources and temperature control. These data clearly showed the wide range of BGE that can be experienced at a particular site on an annual timescale in the surface mixed layer. Our results confirmed that the availability of phosphate and temperature were the main
Table 5 Summary of bacterial growth efficiency (BGE) found by several authors in NW Mediterranean Sea
Authors Study area FC RQ BGE (%)
Min Max Average±SE
This study Marseille’s Bay 1.5 to 2.6 0.8 1 37 17±2
Kritzberg et al.2010a Island of Majorca 1.5 1 12 51 32±3
Alonso-Sáez et al.2008 Blanes Bay 0.9 to 3.6 0.88 3 42 17±4
Vázquez-Domínguez et al.2007 Blanes Bay 3.1 1 nd nd 18±6
Lemée et al.2002 DYFAMED 1.5 1 0.1 43 11±2
factors controlling heterotrophic activity in the coastal, oligo-trophic Marseille Bay. Further insight on the ecosystem dy-namics should be improved using regional modelling (Fraysse et al.2013) and by using high-frequency long-term observa-tion systems including biological observaobserva-tion and proxies in relation to environmental variables (Thyssen et al.2008).
Acknowledgements This work was supported by the EC2CO
(Eco-sphère Continentale et Cotière) program and DEMO2 (Dégradation de la Matière Organique) project. We are very grateful to the crew of the R/V Antedon II for their excellent service at sea and the SOMLIT staff for providing CTD data from SOLEMIO. Ph.D. scholarship to B. Céa was
provided by the Provence Alpes Côte d’Azur region. We also wish to
thank Beatrice Beker for her data of the microphytoplankton and Chris-tophe Yohia for his wind direction compass. Special thanks go to Karine Le Blanc, Bernard Queguiner the CYBELE team from MIO for their helpful comments. We are grateful to Dr. Philippe Garrigues for helpful comments on the manuscript and to the reviewer for their useful criti-cisms. This is a contribution to the SOMLIT network.
References
Alonso-Sáez L, Gasol JM (2007) Seasonal variations in the contributions of different bacterial groups to the uptake of low-molecular-weight compounds in northwestern Mediterranean coastal waters. Appl
Environ Microbiol 73:3528–3535
Alonso-Sáez L, Vázquez-Domínguez E, Cardelús C, Pinhassi J, Sala MM, Lekunberri I, Balagué V, Vila-Costa M, Unrein F, Massana R, Simó R, Gasol JM (2008) Factors controlling the year-round variability in carbon flux through bacteria in a coastal marine
sys-tem. Ecosystems 11:397–409
Aminot A, Kérouel R (2004) Dissolved organic carbon, nitrogen and
phosphorus in the N–E Atlantic and the N–W Mediterranean with
particular reference to non-refractory fractions and degradation.
Deep Sea Res Part I Oceanogr Res Pap 51:1975–1999
Apple JK, del Giorgio PA, Kemp WM (2006) Temperature regulation of bacterial production, respiration, and growth efficiency in a
temper-ate salt-marsh estuary. Aquat Microb Ecol 43:243–254
Aranguren-Gassis M, Teira E, Serret P, Martínez-García S, Fernández E (2012) Potential overestimation of bacterial respiration rates in
oligotrophic plankton communities. Mar Ecol Prog Ser 453:1–10
Berggren M, Laudon H, Jonsson A, Jansson M (2010) Nutrient con-straints on metabolism affect the temperature regulation of aquatic
bacterial growth efficiency. Microb Ecol 60:894–902
Bouvy M, Bettarel Y, Bouvier C, Domaizon I, Jacquet S, Le Floc’h E,
Montanié H, Mostajir B, Sime-Ngando T, Torréton JP, Vidussi F, Bouvier T (2011) Trophic interactions between viruses, bacteria and nanoflagellates under various nutrient conditions and simulated
climate change. Environ Microbiol 13:1842–1857
Broche P, Devenon J-L, Forget P, de Maistre J-C, Naudin J-J, Cauwet G (1998) Experimental study of the Rhone plume. Part I: physics and
dynamics. Oceanol Acta 21:725–738
Cauwet G (1994) HTCO method for dissolved organic carbon analysis in seawater: influence of catalyst on blank estimation. Mar Chem 47:
55–64
Céa B, VanWambeke F, Lefèvre D, Chirurgien L (under review) How temperature and resources affect activities of marine heterotrophic
bacteria? A seasonal study in Marseille’s Bay. Aquat Microb Ecol
Christakill U, Van Wambeke F, Dolan JR (1999) Nanoflagellates (mixotrophs, heterotrophs and autotrophs) in the oligotrophic
eastern Mediterranean: standing stocks, bacterivory and
relation-ships with bacterial production. Mar Ecol Prog Ser 181:297–307
Cole JJ, Pace ML (1995) Bacterial secondary production in oxic and
anoxic freshwaters. Limnol Oceanogr 40:1019–1027
Cotner JB, Ammerman JW, Peele ER, Bentzen E (1997) Phosphorus-limited bacterioplankton growth in the Sargasso Sea. Aquat Microb
Ecol 13:141–149
Cottrell MT, Kirchman DL (2000) Natural assemblages of marine proteobacteria and members of the Cytophaga-Flavobacter cluster consuming low- and high-molecular-weight dissolved organic mat-ter. Appl Environ Microbiol 66:1692–1697
Daneri G, Riemann B, Williams PJL (1994) In-situ bacterial production and growth-yield measured by thymidine, leucine and fractionated dark oxygen-uptake. J Plankton Res 16:105–113
del Giorgio PA, Cole JJ (1998) Bacterial growth efficiency in natural aquatic systems. Annu Rev Ecol Syst 29:503–541
del Giorgio PA, Williams PJ (2005) Respiration in aquatic ecosystems. Oxford University Press, Oxford, pp 1–17
Del Negro P, Celussi M, Crevatin E, Paoli A, Aubry FB, Pugnetti A (2008) Spatial and temporal prokaryotic variability in the northern Adriatic Sea. Mar Ecol 29:375–386
Estournel C, Broche P, Marsaleix P, Devenon J-L, Auclair F, Vehil R (2001) The Rhone River plume in unsteady conditions: numerical and experimental results. Estuar Coast Shelf Sci 53:25–38 Fischer U, Velimirov B (2002) High control of bacterial production by
viruses in a eutrophic oxbow lake. Aquat Microb Ecol 27:1–12 Fraysse M, Pinazo C, Faure VM, Fuchs R, Lazzari P, Raimbault P,
Pairaud I (2013) Development of a 3D coupled physical-biogeochemical model for the Marseille coastal area (NW Mediterranean Sea): what complexity is required in the coastal zone? PLoS ONE 8:e80012
Fraysse M, Pinazo C, Pairaud I (2014) Rôle du forçage physique sur l’écosystème à l'est du Golfe du Lion: Modulation de l'impact des apports anthropiques en sels nutritifs et matière organique étudiée par modélisation 3D couplée physique et biogéochimique, pH-D Thesis, Aix-Marseille University, 339 pp
Fraysse M, Pairaud I, Ross ON, Faure VM, Pinazo C (under review) Intrusion of Rhone River diluted water into the bay of Marseille: generation processes and impacts on ecosystem functioning. Geophys Res
Gatti J (2008) Intrusions du courant nord méditerranéen sur la partie est du plateau continental du golfe du Lion.
Gatti J, Petrenko A, Devenon J-L, Leredde Y, Ulses C (2006) The Rhone River dilution zone present in the northeastern shelf of the Gulf of
Lion in December 2003. Cont Shelf Res 26:1794–1805
Grégori G, Colosimo A, Denis M (2001) Phytoplankton group dynamics in the Bay of Marseilles during a 2-year survey based on analytical
flow cytometry. Cytometry 44:247–256
Hoppe HG (1983) Signifiance of exoenzymatic activities in the ecology of brackish water: measurements by means of
methylumbelliferyl-substrates. Mar Ecol Prog Ser 11:299–308
Hoppe HG (2003) Phosphatase activity in the sea. Hydrobiologia 493:
187–200
Hoppe H, Kim S, Gocke K (1988) Microbial decomposition in aquatic environments: combined process of extracellular enzyme activity
and substrate uptake. Appl Environ Microbiol 54:784–790
Jahnke RA, Craven DB (1995) Quantifying the role of heterotrophic bacteria in the carbon cycle: a need for respiration rate
measure-ments. Limnol Oceanogr 40:436–441
Kirchman D, K’nees E, Hodson R (1985) Leucine incorporation and its
potential as a measure of protein synthesis by bacteria in natural
aquatic systems. Appl Environ Microbiol 49:599–607
Kragh T, Søndergaard M, Tranvik L (2008) Effect of exposure to sunlight and phosphorus-limitation on bacterial degradation of coloured dissolved organic matter (CDOM) in freshwater. FEMS Microbiol
Kritzberg E, Arrieta J, Duarte C (2010a) Temperature and phosphorus regulating carbon flux through bacteria in a coastal marine system.
Aquat Microb Ecol 58:141–151
Kritzberg ES, Duarte CM, Wassmann P (2010b) Changes in Arctic marine bacterial carbon metabolism in response to increasing
tem-perature. Polar Biol 33:1673–1682
Kroer N (1993) Bacterial growth efficiency on natural dissolved organic
matter. Limnol Oceanogr 38:1282–1290
Krom MD, Kress N, Brenner S, Gordon LI (1991) Phosphorus limitation of primary productivity in the eastern Mediterranean Sea. Limnol
Oceanogr 36:424–432
Lami R, Ghiglione J-F, Desdevises Y, West NJ, Lebaron P (2009) Annual patterns of presence and activity of marine bacteria monitored by
16S rDNA–16S rRNA fingerprints in the coastal NW
Mediterranean Sea. Aquat Microb Ecol 54:199–210
Lemée R, Rochelle-Newall E, Van Wambeke F, Pizay M-D, Rinaldi P, Gattuso J-P (2002) Erratum: seasonal variation of bacterial produc-tion, respiration and growth efficiency in the open NW Mediterranean Sea. Aquat Microb Ecol 29:227–237
López-Urrutia A, Morán XAG (2007) Resource limitation of bacterial production distorts the temperature dependence of oceanic carbon cycling. Ecology 88:817–822
Marie D, Partensky F, Jacquet S, Vaulot D (1997) Enumeration and cell cycle analysis of natural populations of marine picoplankton by flow cytometry using the nucleic acid stain SYBR green I. Appl Environ Microbiol 63:186–193
Massana R, Pedros-Alio C, Casamayor EO, Gasol JM (2001) Changes in marine bacterioplankton phylogenetic composition during incuba-tions designed to measure biogeochemically significant parameters. Limnol Oceanogr 46:1181–1188
Middelboe M, Søndergaard M (1993) Bacterioplankton growth yield: seasonal variations and coupling to substrate lability and
beta-glucosidase activity. Appl Environ Microbiol 59:3916–3921
Millot C (1990) The Gulf of Lions’ hydrodynamics. Cont Shelf Res 10:
885–894
Millot C, Wald L (1980) The effects of mistral wind on the Ligurian
current near Provence. Oceanol Acta 3:399–402
Minas H (1968) A propos d’une remontée d’eaux “‘profondes’” dans les
parages du golfe de Marseille (oct. 1964), conséquences
biologiques. Cah Oceanogr 20:647–674
Obernosterer I, Kawasaki N, Benner R (2003) P limitation of respiration in the Sargasso Sea and uncoupling of bacteria from P regeneration
in size-fractionation experiments. Aquat Microb Ecol 32:229–237
Para J, Coble PG, Charrière B, Tedetti M, Fontana C, Sempéré R (2010) Fluorescence and absorption properties of chromophoric dissolved organic matter (CDOM) in coastal surface waters of the northwestern Mediterranean Sea, influence of the Rhône River. Biogeosciences 7:
4083–4103
Pairaud IL, Gatti J, Bensoussan N, Verney R, Garreau P (2011) Hydrology and circulation in a coastal area off Marseille: validation
of a nested 3D model with observations. J Mar Syst 88:20–33
Pinhassi J, Gómez-Consarnau L, Alonso-Sáez L, Sala M, Vidal M, Pedrós-Alió C, Gasol J (2006) Seasonal changes in bacterioplankton nutrient limitation and their effects on bacterial community composition in the
NW Mediterranean Sea. Aquat Microb Ecol 44:241–252
Raimbault P, Slawyk G, Coste B, Fry J (1990) Feasibility of using an automated procedure for the determination of seawater nitrate in the
0–100 nM range: examples from field and cultures. Mar Biol 104:
347–351
Raimbault P, Diaz F, Pouvesle W, Boudjellal B (1999) Simultaneous determination of particulate organic carbon, nitrogen and phospho-rus collected on filters, using a semi-automatic wet-oxidation
meth-od. Mar Ecol Prog Ser 180:289–295
Raimbault P, Lantoine F, Neveux J (2004) Rapid measurement of chlo-rophyll a and of phaeopigments a by fluorimetry after extraction with methanol. Comparison with the classic acetone extraction
method. Océanis 30:189–205
Reffray G, Fraunie P, Marsaleix P (2004) Secondary flows induced by wind forcing in the Rhone region of freshwater influence. Ocean
Dyn 54:179–196
Rivkin RB, Legendre L (2001) Biogenic carbon cycling in the upper
ocean: effects of microbial respiration. Science 291:2398–2400
Sala MM, Karner M, Arin L (2001) Measurement of ectoenzyme activ-ities as an indication of inorganic nutrient imbalance in microbial
communities. Aquat Microb Ecol 23:301–311
Sarmento H, Montoya JM, Vazquez-Dominguez E, Vaqué D, Gasol JM (2010) Warming effects on marine microbial food web processes: how far can we go when it comes to predictions? Philos Trans R Soc Lond B Biol Sci 365:2137–2149
Sebastian M, Ammerman JW (2009) The alkaline phosphatase PhoX is more widely distributed in marine bacteria than the classical PhoA. ISME J 3:563–572
Simó R, Vila-Costa M, Alonso-Sáez L, Cardelús C, Guadayol Ò, Vázquez-Domínguez E, Gasol J (2009) Annual DMSP contribution to S and C fluxes through phytoplankton and bacterioplankton in a NW Mediterranean coastal site. Aquat Microb Ecol 57:43–55 Smith DC, Azam F (1992) A simple, economical method for measuring
bacterial protein synthesis rates in seawater using 3H-leucine. Mar Microbial Food Webs 6:107–114
Thingstad TF, Zweifel UL, Rassoulzadegan F (1998) P limitation of heterotrophic bacteria and phytoplankton in the northwest Mediterranean. Limnol Oceanogr 43:88–94
Thyssen M, Mathieu D, Garcia N, Denis M (2008) Short-term variation of phytoplankton assemblages in Mediterranean coastal waters re-corded with an automated submerged flow cytometer. J Plankton
Res 30:1027–1040
Torréton J-P, Talbot V, Garcia N (2000) Nutrient stimulation of bacterioplankton growth in Tuamotu atoll lagoons. Aquat Microb
Ecol 21:125–137
Tréguer P, Corre P Le (1975) Manuel d’analyse des sels nutritifs dans
l'eau de mer (utilisation de l'autoAnalyseur II Technicon). Laboratoire d'Océanographie chimique, Université de bretagne occidentale
Vallino JJ, Hopkinson CS, Hobbie JE (1996) Modeling bacterial utiliza-tion of dissolved organic matter: optimizautiliza-tion replaces Monod
growth kinetics. Limnol Oceanogr 4:1591–1609
Van Wambeke F, Christaki U, Giannakourou A, Moutin T, Souvemerzoglou K (2002) Longitudinal and vertical trends of bac-terial limitation by phosphorus and carbon in the Mediterranean Sea.
Microb Ecol 43:119–133
Van Wambeke F, Bonnet S, Moutin T, Raimbault P, Alarc G (2008) Factors limiting heterotrophic bacterial production in the southern
Pacific Ocean. Biogeosciences 5:833–845
Van Wambeke F, Ghiglione J-F, Nedoma J, Mével G, Raimbault P (2009) Bottom up effects on bacterioplankton growth and composition during summer-autumn transition in the open NW Mediterranean
Sea. Biogeosciences 6:705–720
Vázquez-Domínguez E, Vaqué D, Gasol JM (2007) Ocean warming enhances respiration and carbon demand of coastal microbial
plank-ton. Glob Chang Biol 13:1327–1334
Williams PJL, Jenkinson NW (1982) A transportable microprocessor-controlled precise Winkler titration suitable for field station and
shipboard use. Limnol Oceanogr 27:576–584
Zweifel UL, Norrman B, Hagstrom A (1993) Consumption of dissolved organic carbon by marine bacteria and demand for inorganic