Dynamics of Human Decision-Making: Vestibular Perception and
Neural Correlates
by Koeun Lim
SUBMITTED TO THE HARVARD-MIT DIVISION OF HEALTH SCIENCES AND TECHNOLOGY IN PARTIAL FULFILLMENT OF THE REQUIREMENTS FOR THE DEGREE OF DOCTOR OF PHILOSOPHY IN HEALTH SCIENCES AND TECHNOLOGY
AT THE
MASSACHUSETTS INSTITUTE OF TECHNOLOGY September 2017
@2017 Koeun Lim. All rights reserved.
The author hereby grants to MIT permission to reproduce and to distribute publicly paper and electronic copies of this thesis document in whole or in part
in any medium now known or hereafter created.
Signature of Author:
Signature redacted
Harvard-MIT Division of Health Sciences and Technology August 20, 2017
Certified by:
Signature redacted
Daniel M. Merfeld Professor of Otolaryngology, Harvard Medical School Thesis Supervisor
Accepted
by:_Signature
redacted
Emery Brown ~i iector, Harvard-MIT Program in Health Sciences and Technology Professor of Computation Neuroscience and Health Sciences and Technology
MASSACHUSES INSTITUTE OF TECHNOLOGY
Dynamics of
Human Decision-Making:
Vestibular Perception and
Neural Correlates
by Koeun Lim
DEGREE OF DOCTOR OF PHILOSOPHY IN HEALTH SCIENCES AND TECHNOLOGY AT THE
MASSACHUSETTS INSTITUTE OF TECHNOLOGY September 2017
Certified by:
Signature redacted
Jennifer R. Melcher Associat rof sor of Otolaryngology, Harvard Medical School Thesis Committee Chair
Certified by:
Signature redacted
Jeremy Wolfe Pro feor of 0 thalmology an Radiology, Harvard Medical School
Thesis Reader
Certified by:
Signature redacted
Patrick L. Purdon Associate Professor of Anesthesia, Massachusetts General Hospital Thesis Reader
Dynamics of Human Decision-Making: Vestibular Perception and
Neural Correlates
by Koeun Lim
Submitted to the Harvard-MIT Division of Health Sciences and Technology on August 23, 2017 in Partial Fulfillment of the
Requirements for the Degree of Doctor of Philosophy in Health Sciences and Technology
ABSTRACT
When making daily decisions, people naturally ask two questions: how soon can I make a decision, and is it a good decision? In experimental setting, humans can subjectively yet quantitatively assess choice confidence (i.e. how good) based on their perceptual
precision even when a decision is made without an immediate reward or feedback. Such choice confidence has been shown to have a non-monotonic relationship with decision time
(i.e. how soon), such that choice confidence can be correlated either positively or
negatively with decision time depending on how decision time is constrained. However, the neural mechanisms underlying the interaction between choice confidence and decision time during perceptual decision-making are still unclear. Hence, the goals of this research were to (1) develop dynamic computational models and to (2) find neural representations of choice confidence in human scalp potentials.
The dynamic models of choice confidence were developed by merging two parallel conceptual frameworks of decision-making, signal detection theory and sequential
analyses (i.e., drift diffusion model). Specifically, in order to capture the end-point statistics of binary choice and confidence, we built on a previous study that defined choice
confidence in terms of psychophysics derived from signal detection theory. At the same time, we augmented this mathematical model to include accumulator dynamics of a drift-diffusion model to characterize the time-dependence of choice behaviors in a standard forced-choice paradigm. Twelve human subjects performed a subjective visual vertical task, simultaneously reporting binary orientation choice and probabilistic confidence. Both binary choice and confidence experimental data displayed statistics and dynamics
consistent with both signal detection theory and evidence accumulation, respectively. Specifically, the computational simulations showed that the unbounded evidence
bounded and unbounded models were indistinguishable for binary choice data. These results suggest that the brain can utilize mechanisms consistent with signal detection theory to assess confidence when observation duration is externally controlled.
As a neural mechanism that binds choice action and confidence, a fronto-parietal network has been implicated. Such bi-local neural circuitry is consistent with dual-route model of metacognition, in which the prefrontal cortex supervises and evaluates object-level parietal cortex. However, the neural dynamics underlying the interaction between choice confidence and decision time in the fronto-parietal network during the perceptual decision-making have yet to be elucidated. Here we show in fifteen human subjects that choice confidence contributes to frontal event-related potential (ERP) during a pre-decisional stage when choice accuracy is emphasized over speed during a free response task. We found that the second positive peak, particularly the curvature, of the stimulus-locked frontal ERP at 400-600ms covaries with confidence while the amplitude of the centro-parietal ERP increases with faster decision response time during the same time interval. This finding provides evidence for a causal role of confidence in perceptual decision-making, complementing earlier ERP evidence supporting a retrospective role.
Altogether, these results suggest that an internal representation of choice confidence evolves concurrently with choice action prior to reporting a decision.
Furthermore, the non-monotonic dynamics of confidence arise from its dual roles that may be determined by the prior expectation of decision time constraint. In other words, the causal role of confidence may underlie the negative correlations between choice confidence and decision time behaviors while the retrospective role may underlie the positive
correlations.
Thesis Advisor: Daniel M. Merfeld, Ph.D.
ACKNOWLEDGEMENTS
This work was made possible with the generous funding support from NIH-NIDCD (5R01
DC 014924-02), Med-El, and HST-SHBT training grant from MIT and NIH.
First of all, I cannot possibly express in words how grateful I am to my advisor, Dan, for his great mentorship, patience, and support throughout the past 10 years. Thanks to my thesis committee, Prof. Jennifer Melcher, Prof. Jeremy Wolfe, and Prof. Patrick Purdon for guiding the direction of this thesis. I also thank Dr. Wei Wang for helping me through statistical analyses. I could not have finished this thesis without her help.
Thanks to everyone in the Jenks Vestibular Physiology Lab at Massachusetts Eye and Ear Infirmary for being a family for the last decade. Dan, I already thanked you for being a great mentor, but you have provided so much more. I will forever cherish the times I worked with you in this lab. Csilla, thank you for being my spiritual advisor as well as all of your wonderful questions. Faisal, thank you for all of your intellectual advices. Susan, Ryan, and
Tania, thank you for being my personal shrinks. Thanks to Bob and Wangsong for helping with experimental setup. Thanks to Kristen for the administrative support. And thanks to former members of JVPL, Torin and Yongwoo, for all of their intellectual contributions and discussions.
Thanks to everyone in SHBT. Thank you, Prof. John Rosowski, for providing academic and emotional support. Thank you, Rachelle, Nate, Sonam, and Jordan, for helping me to
maintain mental sanity during the early years in SHBT. I love you guys so much. One more thanks to Rachelle for going through this together.
Thanks to all of my test subjects for enduring everything I did to them.
I also thank my former M.S. advisor, Prof. Sukyung Park at KAIST, for introducing me to the
world of vestibular research.
Thanks to my family, mom MyungJie, big sister Soeun, and big brother Jaeyoon for believing in me during all these years. I especially thank my mother for her devotion to my education. Lastly, biggest thanks to my husband, Dongkyun. None of this would have happened if I had not met you, DK. You literally changed my life. You taught me love and compassion, and you have provided everything I could ever hope for; you have always been a great role model for both research and life, and you gave me a happy and loving family with our little treasure Hayune. I deeply love you, and thank you, DK.
TABLE OF CONTENTS
A bstract...5
Acknow ledgem ents... 8
List of A cronym s ... 12
List of Figures...13
List of Tables ... 14
Chapter 1 Introduction ... 16
Chapter 2 Study 1: Developing dynamic models of perceptual decision-making and choice confidence during a forced-choice task...21
A b s tra c t... 2 2 New and Noteworthy ... 23
In tro d u c tio n ... 2 3 M e th o d s ... 2 7 H u m a n S tu d ie s... 2 7 C o m p u ta tio n a l M o d e ls ... 2 9 P u re D D M (p D D M )... 3 2 Collapsing bound DDM (cbDDM)... 32
Urgency signal DDM (usDDM)... 33
High-pass filter DDM (hpfDDM) ... 33
Psychophysics, Confidence, and DDM ... 35
Perceptual Threshold in Unbounded DDM's... 36
Perceptual Threshold in Bounded DDM ... 37
F ittin g ... 3 8 Fitting a psychometric function to binary responses... 38
Fitting a confidence function to confidence responses ... 39
Goodness of fit assessment... 40
R e s u lts ... 4 2 O v e rv ie w ... 4 2 Perceptual decision accuracy and confidence data... 42
Parametric study - Nested model analysis ... 44
Model dynamics comparisons... 46
I. Unbounded vs. bounded evidence accumulation ... 46
II. Evidence accumulation dynamics... 51
D is c u s s io n ... 5 3 S u m m a ry ... 5 3 Binary choice behavior in unbounded and bounded evidence accumulators ... 53
Confidence judgment in unbounded and bounded evidence accumulator ... 55
Additional components of accumulator models... 60
Accumulation dynamics - effective time window of evidence accumulation... 61
Confidence model - additional dynamics... 62 A p p e n d ix I... 6 5
Chapter 3 Study 2: Neural correlates of choice confidence during free response task ... 67 A b s tra c t ... 6 8 In tro d u c tio n ... 6 9 M e th o d s ... 7 1 E x p e rim e nta l P ro ce d u re s ... 7 1 EEG Recordings and Data Analyses ... 73
R e s u lts ... 7 5
O v e rv ie w ... 7 5
B e h a v io ra l D a ta ... 7 5
Event-Related Potential (ERP) Data ... 79
D is c u s s io n ... 9 0
S u p p le m e n t I ... 9 4 S u p p le m e n t 11 ... 9 6
chapter 4 Conclusions ... 97
LIST OF ACRONYMS
BIC - Bayesian Information Criterion
cbDDM - collapsing bound Drift-Diffusion Model
CPP - Centroparietal Potential DDM - Drift-Diffusion Model Dev - Deviance
DSCF - Dwass, Steel, Critchlow-Fligner method EEG - Electroencephalography
ERP - Event-Related Potential FP - Frontal Potential
hpfDDM - high-pass filter Drift-Diffusion Model LLR - Log-Likelihood Ratio
NLL - Negative Log-Likelihood pDDM - pure Drift-Diffusion Model RMSE - Root-Mean Squared Error RT - Response Time
SVV- Subjective Visual Vertical
LIST OF FIGURES
Figure 1. Dual-route and hierarchical models of metacognition. ... 17
Figure 2. Experimental procedure for a forced-choice SVV orientation-recognition task ... 2 8 Figure 3. Four drift-diffusion model variants - each including both signal detection theory and partial information for a total of 8 models ... 30
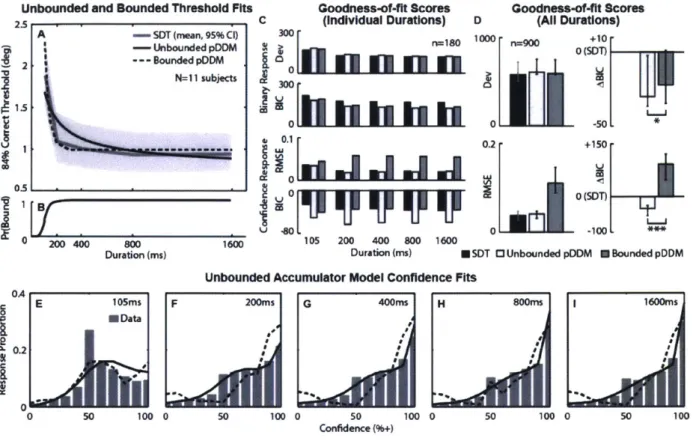
Figure 4. Perceptual binary choice anc confidence data summary from 12 subjects .... 43
Figure 5. Model comparisons: unbounded and bounded pDDM's ... 50
Figure 6. Unbounded model comparisons: 4 variants of accumulator dynamics ... 52
Figure 7. Simulated dataset generated by an unbounded pDD ... 56
Figure 8. Simulated dataset generated by a bounded pDDM ... 58
Figure 9. Experimental procedure and behavioral data for free response paradigm ... 77
Figure 10. Stimulus-locked topography... 80
Figure 11. The effect of confidence, stimulus level, and RT on stimulus-locked event-related potentials (E R P s) ... 8 1 Figure 12. ERP late component areas and gains... 84
Figure 13. The curvature of FP between 400ms and 600ms from the stimulus onset ... 85
Figure 14. Response time-locked ERPs ... 86
Figure 15. Pre-RT and post-RT ERP component areas and gains ... 88
Figure 16. M otor control ER Ps ... 94
Figure 17. Sensory control ER Ps ... 95
Figure 18. RT-locked topography... 96
LIST OF TABLES
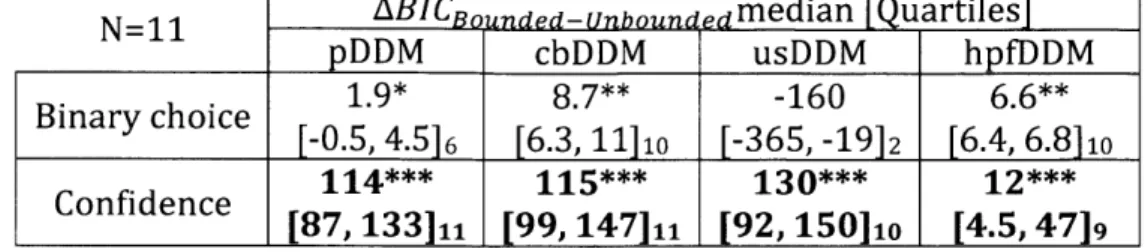
Table 1. Free parameters for each accumulator model ... 31 Table 2. Unbounded models: Nested model hierarchical analysis... 45 Table 3. Bounded models: Nested model hierarchical analysis... 45 Table 4. Goodness-of-Fit score (BIC) comparisons between bounded and unbounded
D D M 's ... 4 7 Table 5. Model parameter values and the comparisons between unbounded and
INTRODUCTION
Decision-making spans scientific disciplines ranging from neuroscience to
experimental psychology to neuroeconomics and is a fundamental component of cognition. Perceptual decision-making is commonly used as a tool to investigate both cognitive
decision-making and sensory perception. In sensory perception, humans can judge
probabilistic confidence associated with choice accuracy (Graziano, Parra, & Sigman, 2015; Lichtenstein, Fischhoff, & Phillips, 1977; Yi & Merfeld, 2016) even when an immediate consequence such as reward or punishment is not apparent. Such choice confidence has been shown to vary non-monotonically with decision time (Baranski & Petrusic, 1998; Drugowitsch, Moreno-Bote, & Pouget, 2014; Moran, Teodorescu, & Usher, 2015; Pleskac & Busemeyer, 2010; Sanders, Hangya, & Kepecs, 2016; Vickers & Packer, 1982). Specifically, choice confidence was shown to increase with increasing decision time when decision time was constrained by experimenter (Pleskac & Busemeyer, 2010; Vickers & Packer, 1982). On the other hand, choice confidence was shown to increase with decreasing decision time when decision time was unconstrained with choice accuracy emphasized over speed
(Baranski & Petrusic, 1998; Drugowitsch et al., 2014; Sanders et al., 2016; Vickers & Packer,
1982).
Such an invertible association between choice confidence and decision time can be interpreted as confidence taking a dual role in decision-making. For instance, under heavy time constraints, confidence takes a retrospective role (Fleming, Weil, Nagy, Dolan, & Rees, 2010) - 'I am less confident because I didn't have enough time'. On the contrary, under minimal time constraints, confidence plays a causal role (Del Cul, Dehaene, Reyes, Bravo, & Slachevsky, 2009) -'I decided sooner because I felt more confident'. To explain these two different roles of confidence, two competing classes of metacognitive models, dual-route (Nelson, 1990) and hierarchical (Shallice, Burgess, & Robertson, 1996) models, have been proposed (Fig. 1). In both models, choice confidence and choice action such as decision time and binary choice are processed in separate loci, illustrated as conscious and
unconscious processes in Figure 1. Here, unconscious processes handle bottom up sensory information processing in sensory cortices in the posterior part of the brain (Fleming & Dolan, 2012; Gu, Fetsch, Adeyemo, Deangelis, & Angelaki, 2010; Kandel, Schwartz, Jessell,
Siegelbaum, & Hudspeth, 2000; Lau & Rosenthal, 2011). On the other hand, conscious processes in the prefrontal cortex impose top down executive control over the unconscious process by evaluating the sensory information and supervising subsequent processing
(Fleming & Dolan, 2012; Fleming et al., 2010; Kandel et al., 2000; Lau & Rosenthal, 2011).
Dual-Route Model
a Physiology Behavior
Conscious Process Subjective Reports
Prefrontal Cortex (e.g. Confidence)
Stimulus
Unconscious Process Task Performance
Posterior Cortex (e.g. Response time,Choice accuracy)
(e.g. LIP neurons, Central-parietal scalp potentials)
Hierarchical Model
b Behavior
Task Performance
(e.g. Response time, Subjective Reports
Choice accuracy) (e.g. Confidence)
Unconscious Process Conscious Process Posterior Cortex Prefrontal Cortex
(e.g. LIP neurons, (e.g. Orbitofrontal neurons, Central-parletal scalp potentials) central-parietal & frontal
scalp potentials)
Physiology
Figure 1. Dual-route and hierarchical models of metacognition.
a Dual-route model and b hierarchical model adopted from (Lau & Rosenthal, 2011). Neural correlates associated with choice action were found in the lateral intra-parietal cortex in non-human primates and in the parietal scalp potential in humans (T. Hanks, Kiani, & Shadlen, 2014; T. D. Hanks, Ditterich, & Shadlen, 2006; O'Connell, Dockree, & Kelly, 2012; Shadlen & Newsome, 2001). These data suggest the unconscious processes contributing to task performance. a In a dual-route model (Nelson, 1990),
both processes governing confidence and choice action can evolve concurrently.
performance is lacking, which is highlighted by the gray shaded box. b In a hierarchical model (Shallice et al., 1996), confidence is assumed as a post-decisional process. Here, neural evidences include orbitofrontal neurons' firing rate and frontal scalp potentials that covary with choice confidence(Graziano et al., 2015; Kepecs, Uchida, Zariwala, & Mainen, 2008).
In dual-route models (Fig. 1a), these two processes are assumed to occur
concurrently, with conscious processes contributing to both confidence and choice action. On the other hand, hierarchical models (Fig. 1b) assume that confidence is processed after a choice action and that choice action is predominantly driven by an unconscious process. Therefore, a primary difference between dual-route and hierarchical models is the
temporal inter-relationship between the unconscious and conscious processes. This may underlie the non-monotonic relationships between confidence and decision time in human behavior. However, the detailed mechanisms connecting the metacognition and human decision behaviors remains elusive since evidence supporting concurrent conscious processes found in dual-route models (gray box in Fig. la) is lacking.
Hence, a general question here is whether confidence is truly a post-decisional (i.e. hierarchical) process, or has direct evidence for pre-decisional contributions of confidence on decision-making just not yet been discovered? In order to investigate this question, we undertook a multi-disciplinary approach combining experimental psychology,
computational modeling, and functional neural imaging. Specifically, human choice behavioral data was collected in a controlled environment using standard experimental psychology methods; computational models were developed in order to infer underlying mechanisms and the resulting dynamics of human choice behavior. Furthermore, human scalp potentials were measured to infer neural activities associated with choice behaviors and their temporal inter-relationships.
In order to help elucidate mechanisms consistent with non-monotonic dynamics of choice confidence, two experiments were performed that imposed different constraints for the decision time. In the first experiment, a forced-choice paradigm was used; for this paradigm, stimulus duration was controlled by operators. This in effect constrained the
decision time was unconstrained by using a free response task, which allowed subjects to control the stimulus duration. As a result, choice confidence showed opposing dynamic findings in these two experiments: choice confidence increased with longer stimulus when decision time was constrained, but choice confidence decreased with longer decision time when decision time was unconstrained. Here, because forced-choice tasks, without
rewards or feedback, are ubiquitous and because no mechanistic model has been
established for such tasks, a goal in modeling was to define a decision-making mechanism that explained the dynamics of forced-choice behaviors by developing and comparing computational models. On the other hand, human scalp potentials were measured in order to find direct neural evidence for pre-decisional confidence as predicted by dual-route model (gray box in Fig. 1a). Here, a free response task was used, which in effect
complemented the post-decisional neural evidence found for a forced-choice task (Graziano et al., 2015; Zizlsperger, Sauvigny, H Andel, & Haarmeier, 2014).
In the first study (Lim, Wang, & Merfeld, Accepted 2017), using a forced-choice tasks in which observation duration is constrained but response time is not, we investigated: (1) whether perceptual choice and confidence mechanisms include evidence accumulation and (2) whether such evidence accumulation is terminated by decision bounds. In short, two accumulator models - bounded DDM with "absorbing" bounds (Ratcliff & McKoon, 2008) and unbounded DDM without decision bounds - were augmented to include confidence probability judgments (Yi & Merfeld, 2016). Then these models were compared with empiric SVV binary choice (i.e., is the visual scene tilted left or right?) and confidence (i.e., what is the probability that the choice is correct?) data obtained from 12 human subjects who performed a forced-choice signal-detection direction-recognition task while
simultaneously reporting their choice confidence. We report that forced-choice SVV choice confidence data were not matched by the bounded DDMs. Data were well matched by the unbounded DDM having a mechanism that continually accumulates information
throughout stimulus presentation (i.e., decision boundaries do not interfere with continual evidence accumulation). This establishes the drift diffusion model having no bounds as a mechanistic confidence model for this forced-choice subjective visual vertical (SVV) direction-recognition task. While we focus our analysis on a simple drift diffusion model, we also show that other DDM variants (e.g., collapsing bounds, urgency signal, high-pass
filtering) yield the same conclusion regarding the contribution of boundaries, which
highlights the robustness of our primary finding that decision boundaries have little, if any, impact on confidence for our forced-choice signal-detection SVV task.
In the second study, we hypothesized that there is a pre-decisional process that directly governs confidence concurrently with choice action. Given that perceptual decision-making is a rapid process, typically taking less than 1sec, we exploited the high temporal resolution of EEG in order to investigate the pre-decisional dynamics of frontal and centroparietal brain activities associated with choice confidence and decision time. Here, we dissociated a choice confidence component from a decision time component by recording high-density (64 channel) EEG while measuring binary choice accuracy, decision time, and choice confidence from 15 human subjects. In particular, we report a
pre-decisional ERP component from the frontal areas between 400ms and 600ms from the stimulus (SVV) onset. We also present the dynamics of frontal and centroparietal ERP's with respect to two temporal events, stimulus onset and RT. Specifically, while the frontal ERP predominantly represents confidence near the onset (400-600ms), the association with decision time grows near the RT to yield a comparable representation for both
confidence and decision time. After the response, the frontal ERP is reduced significantly. In comparison, the effect of choice action dominates the measured centroparietal ERP
STUDY 1: DEVELOPING DYNAMIC MODELS OF
PERCEPTUAL DECISION-MAKING AND CHOICE CONFIDENCE
DURING A FORCED-CHOICE TASK
Unbounded evidence accumulation characterizes
subjective visual vertical (SVV) forced-choice perceptual choice and confidence
Koeun Limt2
Wei Wang34
Daniel M. Merfeld,2,5
1Jenks Vestibular Physiology Lab Massachusetts Eye and Ear Infirmary Boston, MA, USA
2Program in Speech and Hearing Bioscience and Technology MIT-Harvard Division of Health Sciences and Technology Massachusetts Institute of Technology
Cambridge, MA, USA
3Department of Medicine and Neurology Brigham and Women's Hospital
Boston, MA, USA
4Department of Medicine Harvard Medical School Boston, MA, USA
s Department of Otolaryngology Harvard Medical School
Boston, MA, USA
Address for correspondence: Daniel M. Merfeld
Jenks Vestibular Physiology Lab
Room 421, Mass. Eye and Ear Infirmary Boston, MA, USA 02114
[email protected] fax +1 (617) 573-5596
phone +1 (617) 573-5595
Abstract
Humans can subjectively yet quantitatively assess choice confidence based on perceptual precision even when a perceptual decision is made without an immediate reward or feedback. However, surprisingly little is known about choice confidence. Here we investigate the dynamics of choice confidence by merging two parallel conceptual
frameworks of decision-making, signal detection theory and sequential analyses (i.e., drift diffusion modeling). Specifically, in order to capture end-point statistics of binary choice and confidence, we built on a previous study that defined choice confidence in terms of psychophysics derived from signal detection theory. At the same time, we augmented this mathematical model to include accumulator dynamics of a drift-diffusion model to
characterize the time-dependency of the choice behaviors in a standard forced-choice paradigm in which stimulus duration is controlled by the operator. Human subjects performed a subjective visual vertical task, simultaneously reporting binary orientation choice and probabilistic confidence. Both binary choice and confidence experimental data displayed statistics and dynamics consistent with both signal detection theory and
evidence accumulation, respectively. Specifically, the computational simulations showed that the unbounded evidence accumulator model fits the confidence data better than the
classical bounded model, while bounded and unbounded models were indistinguishable for binary choice data. These results suggest that the brain can utilize mechanisms consistent with signal detection theory -especially when judging confidence without time pressure.
New and Noteworthy
We found that choice confidence data show dynamics consistent with evidence
accumulation for a forced-choice subjective visual vertical task. We also found that the evidence accumulation appeared unbounded when judging confidence, which suggests that the brain utilizes mechanisms consistent with signal detection theory to determine choice confidence.
Introduction
Decision-making spans scientific disciplines ranging from neuroscience to
experimental psychology to neuroeconomics and is a fundamental component of cognition. Perceptual decision-making is commonly used as a tool to investigate both cognitive
decision-making and perception. To advance our understanding of both human perception and human cognitive decision-making, we performed studies, in which human subjects performed a standard and easily reproduced forced-choice decision-making task that utilized subjective visual vertical (SVV) stimuli (Baccini, Paci, Del Colletto, Ravenni, & Baldassi, 2014). We specifically chose an SVV direction-recognition task because SVV may be the most well-studied visual-vestibular perception in humans (Baccini et al., 2014; Barnett-Cowan, Dyde, Thompson, & Harris, 2010; Clemens, De Vrijer, Selen, Van Gisbergen,
& Medendorp, 2011; De Vrijer, Medendorp, & Van Gisbergen, 2009; Dyde, Jenkin, & Harris, 2006; Howard & Templeton, 1966; Sch6ne & De Haes, 1968; Vingerhoets, De Vrijer, Van
Gisbergen, & Medendorp, 2009), including possible clinical utility (Barnett-Cowan, Dyde, Fox, et al., 2010; B6hmer & Rickenmann, 1995; Cohen & Sangi-Haghpeykar, 2012; Dieterich
& Brandt, 1992; Dieterich, P6llmann, & Pfaffenrath, 1993; Vibert & Hsusler, 2000; Vibert,
Hsusler, & Safran, 1999; Zwergal et al., 2009). Furthermore, decisions based on vertical perception are fundamentally important; most of us regularly make life or death decisions (e.g., while driving, biking, and/or while reaching on a ladder) related to vertical
As noted in an influential review (Gold & Shadlen, 2007a) two conceptual frameworks - signal detection theory and sequential analysis - are commonly used to study perceptual decision-making. Sequential analysis (Wald, 1947), which is sometimes called drift diffusion modeling (DDM) (Bogacz, Brown, Moehlis, Holmes, & Cohen, 2006; Ratcliff, 1978; Stone, 1960), is commonly used to model response-time tasks in which subjects are provided a stimulus and tasked to respond as soon as they make their decision. Such drift diffusion models are commonly recognized as mechanistic hypotheses for how the brain accumulates information to make decisions (Kiani, Hanks, & Shadlen, 2008; O'Connell et al., 2012; Ratcliff, 1978; Ratcliff & McKoon, 2008). This sequential analysis approach has been so successful that a family of such models have evolved in the literature
- including collapsing bounds models (Bowman, Kording, & Gottfried, 2012; Milica,
Jonathan, Alexander, Christof, & Antonio, 2010; Ratcliff & Frank, 2012), urgency signal models (Churchland, Kiani, & Shadlen, 2008; Cisek, Puskas, & El-Murr, 2009; Thura,
Beauregard-Racine, Fradet, & Cisek, 2012), and models with high-pass dynamics (Bogacz et al., 2006; Busemeyer & Townsend, 1993; Merfeld, Clark, Lu, & Karmali, 2015; Tsetsos, Gao, McClelland, & Usher, 2012; Usher & McClelland, 2001). Models that form this DDM family integrate noisy information over time to yield a decision-variable that represents
accumulated information; these models "make" a decision when the decision-variable crosses a decision bound (Ratcliff & Rouder, 1998).
Signal detection theory (Green & Swets, 1966; Macmillan & Creelman, 2005) is a second framework used to study decision-making and is certainly among the most widely used and most successful formalisms used to study perception and psychophysics. Signal detection theory is commonly applied during the analysis of data obtained using forced-choice tasks in which the operator controls all aspects of stimulus presentation (e.g. amplitude, duration), and the subject must provide a response after the stimulus
presentation is over. Unlike evidence accumulation models that model hypothesized neural mechanisms, signal detection theory is a statistical model that does not explicitly model an underlying neural mechanism for evidence accumulation. In fact, many studies using forced-choice signal-detection tasks do not posit an explicit mechanistic model of the decision-making process, but some have applied sequential analyses (Ratcliff & McKoon,
2008) - in large part, because such sequential analyses have been so successful in their ability to model response-time data.
When sequential analyses have been applied to forced-choice signal-detection tasks, several models assumed that the same decision bounds successfully used for response-time tasks were applicable. For example, previous studies terminated the accumulation process whenever a decision bound was crossed (Ratcliff, 2006; Ratcliff & McKoon, 2008), which
precisely replicates how these models work for response-time tasks. This bounded DDM has been referred to as having "absorbing" bounds (Diederich, 1997). Such a DDM with absorbing bounds was later combined with signal detection theory to address forced-choice tasks. Specifically, a "partial information model" (Ratcliff, 2006) allowed part of the binary choice to be made when accumulated evidence crossed bounds with the remaining portion of the choice determined by signal detection theory using the end-point statistics. Moreover, a leak mechanism replacing the bound mechanism was proposed (Busemeyer & Townsend, 1993) in order to better capture the decision dynamics and the speed-accuracy trade off in forced-choice paradigms (Bogacz et al., 2006; Usher & McClelland, 2001). To compare decision dynamics of the leaky integrator model and DDM in forced-choice paradigms, decision bounds were removed from DDM- making drift variance the key parameter determining the dynamics of the stochastic information accumulation (Usher & McClelland, 2001). This study showed that both an unbounded DDM and and an
unbounded leaky integrator fit the time-accuracy data better than fits provided by bounded models (Usher & McClelland, 2001). As for the speed-accuracy trade-off, it was shown that the DDM bounds are modulated in forced-choice paradigms to maximize the reward rate when reward is provided (Bogacz et al., 2006).
Since forced-choice signal-detection tasks, without rewards or feedback, are
ubiquitous and because no mechanistic model has been established for such tasks, our goal was to determine the pertinent decision-making mechanism for forced-choice signal-detection tasks. More specifically, using forced-choice tasks in which observation duration is constrained but response time is not, we investigated: (1) whether perceptual choice and confidence mechanisms include evidence accumulation and (2) whether such evidence accumulation is terminated by decision bounds. In short, two accumulator models, bounded DDM with "absorbing" bounds (Ratcliff & McKoon, 2008) and unbounded DDM
without decision bounds, were augmented to include confidence probability judgments (Yi
& Merfeld, 2016). And then these models were compared with empiric SW binary choice
(i.e. is the visual scene tilted left or right?) and confidence (i.e. what is the probability that the choice is correct?) data obtained from 12 human subjects who performed a forced-choice signal-detection direction-recognition task while simultaneously reporting their choice confidence.
We report that forced-choice SW! choice confidence data were not matched by the bounded DDMs. Data were well matched by the unbounded DDM having a mechanism that continually accumulates information throughout stimulus presentation (i.e., decision boundaries do not interfere with continual evidence accumulation). This establishes the drift diffusion model having no bounds as a mechanistic confidence model for this forced-choice subjective visual vertical (SW) direction-recognition task. While we focus our analysis on a simple drift diffusion model, we show that other DDM variants (e.g.,
collapsing bounds, urgency signal, high-pass filtering) yield the same conclusion regarding the contribution of boundaries, which highlights the robustness of our primary finding that decision boundaries have little, if any, impact on confidence for our forced-choice signal-detection SW task.
Methods
Human Studies
The MEEI Human Studies Committee and MIT Committee on the Use of Humans as Experimental Subjects approved the study, and informed consent was obtained. Twelve normal volunteers (7 females, 5 males, mean age 31, range 20 to 55 years) participated in the study. Each subject answered health questionnaires, including vestibular function history. All 12 subjects had normal vision after correction; 3 required correction via contact lenses.
The task was to report the perceived orientation of a visual object displayed on a computer monitor. In each trial, a stationary Gabor patch (Baccini et al., 2014)was displayed at the center, and subjects indicated whether the Gabor appeared tilted left
(CCW) or right (CW) of subjective vertical (upright) after the Gabor turned off. Subjects reported simultaneously the binary orientation choice (left or right) and choice confidence
by tapping on an iPad screen (Fig. 2). Subjects were informed that confidence is defined as
the probability that their choice is correct. The confidence ranged between 50% and 100% with 1% resolution, with 100% being the highest confidence and 50% indicating a random guess.
The stimulus was applied with 5 durations (105, 200, 400, 800, and 1600ms) in order to investigate the time-dependency of binary choice accuracy and choice confidence. Also, in order to obtain a psychometric function for each duration, a fixed-interval non-adaptive procedure was used. In other words, stimuli were provided at 7 tilt magnitudes
(0.3, 0.5, 0.8, 1.3, 2.1, 3.3, and 5.50) regardless of the perceptual thresholds of individual
subjects. When combined with the two tilt directions (left and right), this yielded 14 tilt amplitudes between -5.5 and +5.5". The experiment consisted of 900 trials in total per subject, carried out in 5 blocks of 180 trials. 5 durations and 14 amplitudes were randomly interleaved within a block. Prior to the main data collection, a short practice session
consisting of -10 trials was performed in order to familiarize our subjects with the task.
A visual fixation point was displayed during inter-trial intervals of 2000 ms, and
each Gabor stimulus was followed by a visual masker without orientation cues (i.e. a bulls eye target of the same size as the Gabor) to disrupt the influence of any Gabor afterimage
that may have been present (Fig. 2). The iPad turned on only after the Gabor turned off, and then the iPad turned off after the subject submitted a response. The visual scene was
displayed on a computer monitor (Asus VG248QE) and was generated using Psychtoolbox (Brainard, 1997) at a refresh rate of 144Hz. The Gabor patch had a visual angle of 70 in diameter (Lopez, Mercier, Halje, & Blanke, 2011) with 2-cycle/" and 80% contrast (Baccini et al., 2014). Subjects viewed the display through a round window having a 200 viewing angle at a distance 85cm from the eyes inside a dark chamber. Subjects rested their chins on a chin bar to hold their head in a steady position throughout the experiment.
Fixation dot -2000 ms Gabor Stimulus [Stimulus Onset] 0 ms Masker [Stimulus Offset] 105-1600 ms
"R9
97% 6 Confirmi noFigure 2. Experimental procedure for a forced-choice SW orientation-recognition task
Subjects simultaneously reported both orientation choice and confidence after the Gabor stimulus turned off. The observation duration was controlled by the experimenter, pseudo-randomly selected among the 5 stimulus durations (i.e., between 105ms and 1600ms). Stimui were presented on a computer monitor through a round window, and
Computational Models
In this study, we compare four drift-diffusion models (DDM's) that differ in the dynamical features of evidence accumulation and decision bounds. These four models include a pure DDM (pDDM), a collapsing bound DDM (cbDDM), an urgency signal DDM (usDDM), and a high-pass filter DDM (hpfDDM). Figure 3 illustrates the dynamics of the four DDM's, and a list of the model parameters are provided in Table 1. Here, pDDM is the simplest model consisting of an integrator that accumulates sensory evidence until the evidence crosses a fixed decision bound (Fig. 3 Top Left). In cbDDM, the dynamics of evidence accumulation is identical to pDDM, but the decision bounds collapse over time instead of being constant (Fig. 3 Top Right). In usDDM, a signless urgency signal is added to the accumulated evidence in order to boost the signal to cross the bounds earlier (Fig. 3 Bottom Left). Lastly, in hpfDDM, older information leaks away to weigh more recent information when accumulating the sensory evidence (Fig. 3 Bottom Right). Figure 3 also illustrates how the decision bounds affect the binary response statistics, such as choice accuracy (i.e. percent choosing a positive choice when given positive stimulus) in forced-choice paradigm. For instance, in bounded DDM's, the probability choosing a positive
choice %(+) is determined by applying the partial information model (Ratcliff, 2006). In the partial information model, part of the choice is determined when accumulated evidence crosses a bound, and the remaining portion of the choice is determined by the position of the accumulated evidence. Figure 3 shows sensory evidence accumulation in response to positive stimulus. In Figure 3, the probability of accumulated evidence crossing a positive bound A at any time during stimulus presentation is depicted by the gray curve labeled RT(+), which shows a response time (RT) distribution. Then by tend, the total percent
crossing a bound equals the area under the distribution curve (e.g. gray area under RT(+) curve). For the remaining proportion that did not cross a bound by tend, the total
probability of the accumulated evidence positioned between the mean neutral point (zo)
and the positive bound A (e.g. gray area under vertical bell curve) contribute to positive choice. Hence, for bounded DDM's, the total choice accuracy when given a positive stimulus is the sum of two gray areas in Figure 3. On the contrary, in the unbounded DDM's, the choice is determined only by the position of the accumulated evidence at tend. In Figure 3,
the vertical black bell curve illustrates the probability of the accumulated evidence
positioned at tend, and the total %(+) equates the black area under the distribution curve.
pDDM RT(+ A ZO -A A -A 0 A zO -A t cbDDM t
-Bounded Accumulator with Partial Information %(+) = Area (M) Unbounded Accumulator %(+) = Area (U)
usDDM hpfDDM A zo -A
:7'
-
-- ------0 t 0 't
Figure 3. Four drift-diffusion model variants - each including both signal detection theory and partial information for a total of 8 models
Each panel shows one of four individual models, pDDM, cbDDM, hpfDDM, and usDDM. See extended text sections describing the details of each of these four models. Each panel also shows two variants representing signal detection theory and partial information models. As the mean accumulated evidence (thick solid black) increases over time, the variance (light gray shade showing the standard deviation) increases as well. An example decision variable (i.e. accumulated evidence) for a single trial is shown as the jagged thin black line, which starts at mean decision bias zo. For the partial information model, a decision is made whenever the decision variable crosses one of the decision bounds (dashed black starting at A or -A). The probability of hitting a bound, which defines the decision time distribution, is shown as dark gray curves
i irr
--RT(--
-above each plot. The probability of crossing the positive (+) bound is drawn on the top of each panel, and the probability of crossing the negative (-) bound is drawn below the negative bound, inverted. If a stimulus ends before crossing a decision bound, signal detection theory is applied (dark gray curve in a vertical orientation at tend). In a partial information model, the probability responding positive (% (+)) is the sum of a decision variable's (1) probability crossing (+) bound up until the end of the stimulus at tend and
(2) the probability positioned between zo and A at tend, which corresponds to the sum of
the gray areas. On the other hand, if the binary decision is determined purely based on end-point statistics (consistent with signal detection theory), only the position of decision variable at the end of the stimulus tend contributes to the decision. The distribution of decision variables at tend is shown as black bell curve in a vertical orientation. In such case, the %(+) corresponds to the area colored black.
Table 1. Free parameters for each accumulator model
Parameter pDDM cbDDM usDDM hpfDDM Definition
a 0 0 0 0 Diffusion noise
770 0 0 Sensory noise
T 0 Leak time constant
Y0 0 0 0 Sensory bias
zo0 0 0 0 Mean decision bias
z 0 0 0 0 Decision bias range
A0 Maximum urgency signal
TA 0 Urgency signal time constant
a A A A A Decision bound
Ta A Decision bound time constant
Total # of 5 5 7 5 Unbounded models
parameters 6 7 8 6 Bounded models
0 indicates the parameters in both the unbounded and
A indicates the parameters in only the bounded models
PureDDM (pDDM)
Consistent with Ratcliff's model (Ratcliff, 2006), pDDM is modeled as a simple
integrator (f )to accumulate the noisy sensory cue x over time to yield a decision variable y such that
y =f x dt
The noisy sensory cue x is normally distributed around the noiseless stimulus level (=drift rate in Ratcliff 2006) v with a variance 172 and a bias It, such that x-N(v - y, iq2). In
addition to sensory noise, another source of noise in Ratcliff's model is the initial offset parameter that is uniformly distributed yo-U zO - , zo +
j.
During the accumulation process, diffusion noise v-N(0, a.2) is added, yieldingf
= x + v.Consistent with earlier formulations (Bitzer, Park, Blankenburg, & Kiebel, 2014; Ratcliff,
2006), this process is a Weiner diffusion process (Gardiner, 1985).
When a constant stimulus with a magnitude of v is assumed, solving for the continuous time solution yields
y(t) = Yo + xt + W(t) (1-1)
A(t) = a (1-2)
Discrete time solutions are provided in APPENDIX I. In Equation (1-1), xt is noisy sensory information that is accumulated over time, W(t) is diffusion noise associated with decision (non-sensory) process, and yo is the starting point of the accumulator. The variance of yo is
-.Therefore, the expected value and the variance of y(t) are 12
E[y(t)] = zo + (v -- p)t (2-1)
Var [y(t)] = Z + .2t+r1 2t2 (2-2)
Collapsing bound DDM (cbDDM)
cbDDM equations range widely in terms of complexity (Bowman et al., 2012; Milica et al., 2010; Ratcliff & Frank, 2012), but here we consider cbDDM in its simplest form having the fewest free parameters (Milica et al., 2010). As in pDDM, the accumulation
process remains the same (Eq's 1-1 and 2), but the decision bounds decay exponentially towards 0 such that
A(t) = ae-r (3-2)
Urgency signal DDM (usDDM)
usDDM has an even wider range of complexity (Churchland et al., 2008; Cisek et al.,
2009; Thura et al., 2012), but as with cbDDM, we consider the simplest mechanism
(Churchland et al., 2008). In usDDM, an urgency signal A is added to accumulated sensory evidence to make the decision variable rise faster,
y = f xdt+ A
A usually takes the form of exponentially saturating function (Churchland et al., 2008; Cisek
et al., 2009; Thura et al., 2012). One of the simpler versions of A was introduced by
Churchland (2008), who characterized the urgency signal as a half-life formula. However, since this formula is nonlinear when expressed in discrete formulation, we here define A as an exponential decay. Meanwhile, decision bounds stay constant in usDDM. Hence, the continuous time solutions for usDDM are
y(t) = Yo + (v - 1)t + 11(t) + W(t) (4-1)
1(t)
= Ao ( - e S) (4-2)
A(t) = a (4-3)
Here, -cus characterizes the decay rate of the urgency signal, and A,, characterizes the maximum urgency signal. The expected value and the variance of y(t) are then
E[y(t)] = zo + (v - y)t + A0 1 - e~ (51)
Var[y(t)] = _+ .2t+172t2 (5-2)
12
High-pass filter DDM (hpfDDM)
For the hpfDDM, it is assumed that the brain considers only the more recent information while discarding older information (Merfeld et al., 2015; Tsetsos et al., 2012; Usher & McClelland, 2001). This mechanism of putting a time window around incoming sensory input can be modeled as a high-pass filter (HPF), and this HPF is applied
sequentially with a DDM. For the linear model considered herein, the order of these processes (HPF before DDM or DDM before HPF) does not matter. The width of the time window is characterized by a time constant -r, which can be represented by the following expression.
y= f HPFtx) dt
Unlike previous models, the diffusion noise a for an hpfDDM is assumed to originate from the sensory noise (i.e. r1 = a). Also, now the diffusion process is also affected by the leak
(HPF), resulting in a Langevin process (Langevin, 1908) rather than being a pure diffusion (Weiner) process. Applying Langevin's equation (Langevin, 1908) yields a continuous time
solution with the following noise variance:
y(t) = Yo + (v - y)t (1 - e7F) + W(t), W(t)-N (0, (1 - e(6-1)
A(t) = a (6-2)
The expected value and the variance of y(t) are then
E[y(t)] = zo + (v - y)T ( 1 - e -) (7-1)
Var[y(t)] = + (1 - e T(7-2)
12 2 /
An important dynamic characteristics of an hpfDDM is that both the expected value
and the variance of the decision variable reach a steady state ((v - M)r and -+ , 12 2 respectively) as t -> +oo. In contrast, E[y(t)] and Var[y(t)] in the other three models
diverge towards +oo as t -+ +oo. These differences play a crucial role in the assumption about the internal representation of the decision variable noise distribution. In other words, because the steady-state decision variable variance converges to a finite value beyond the time constant, the neural network is not required to track the variance real time. This means that the neurons now can establish a stationary representation of
decision noise, contrary to the other models that require non-stationary, time-dependent noise representations. Here, we assume such steady-state stationary decision noise with variance (Var):
VaZ[y(t) = + (7-3)
The procedures for finding thresholds based on these four DDM's are outlined in equations
(13)~(18).
Psychophysics, Confidence, and DDM
There is a general consensus that confidence reflects the state of the decision variables although it is still debated whether decision and confidence involve a single- or double-stage process (Murphy, Robertson, Harty, & O'Connell, 2015; Navajas, Bahrami, &
Latham, 2016; Pleskac & Busemeyer, 2010; Rahnev, Koizumi, McCurdy, D'Esposito, & Lau,
2015; van den Berg et al., 2016; Yu, Pleskac, & Zeigenfuse, 2015). Yi and Merfeld recently
proposed a psychophysical model explaining the correlations between confidence and perceptual precision (Yi & Merfeld, 2016). Here we combine this earlier confidence model with a DDM. Perceptual precision is effectively modeled as a sigmoidal psychometric function based on signal detection theory (Green & Swets, 1966; Merfeld, 2011; Wichmann
& Hill, 2001). This function represents perceptual noise, and thresholds are defined in
terms of the spread parameter a- of such distribution. Unlike in Yi and Merfeld (2016) that developed the model in the stimulus domain, here we define confidence in terms of the decision-variable (i.e. define confidence in terms of y instead of v).
The direction-recognition psychometric function is typically modeled as the probability of choosing a positive choice given a stimulus in the form of cumulative Gaussian function,
Pr(+j v, t) = cP(E[y(v, t)]; zo, Var[y(t)]), (8-1)
where E[y(v, T)] indicates the expected decision variable driven by the stimulus v with a duration t. Then each individual y(v, t) is a random variable from each trial such that
y(v, t)-N(E[y(v, t)], Var[y(t)]). Therefore the probability density of y(v, t) is a Gaussian
function
p(y(v,
0)
= /(y(v, t); E[y(v, t)], Var[y(t)]) (8-2)Confidence is an internal probabilistic representation of choice accuracy given the decision variable that is driven by the stimulus. Taking Yi's mapping of confidence from the psychophysics, confidence on a single-trial basis can be obtained from
where K(t) is a confidence factor at time t, K < 1 indicating overconfidence and K > 1 indicating underconfidence (Yi & Merfeld, 2016). Here, as an empiric model required to match data, K(t) is modeled as an exponentially decaying function such that
K(t) = (KO - Ko)e-t/rc + Ko (10)
since K showed time-dependence as shown in the supplement (Fig. 4L). The probability density of confidence can be obtained through a coordinate conversion from the stimulus domain in Eq. (9) to the confidence domain by substituting y(v, t) = c- (conf; 0, K-Var[y(t)]) from Eq. (9) into Eq. (8-2),
p(conf) = <p(c -'(conf; zo, K(t) - Var[y(t)]); E[y(v, t)], Var[y(t)]) (11)
When expressed as a discrete probability density, Eq. (11) becomes equivalent to the confidence density equation (Eq. 2) in Yi and Merfeld (2016).
p(conf) ~ Pr (conf - < conf < conf + (12)
= 0
(-1 (conf +- zo, K(t) -Var[y(t)]; E [y(v, t)],Var[y(t)]
-( (-1 (conf - - , K(t) - Var[y(t)]); E[y(v, t)], Var[y(t)]
In Eq. (12), Ac is the resolution allowed for the confidence response. In this study, subjects reported confidence with a 1% resolution (Ac = 1%).
Perceptual Threshold in Unbounded DDM's
In unbounded DDM's, as illustrated in Figure 3, the final position of the decision variable determines the categorical response. This is consistent with signal detection theory (SDT) that assumes no decision bounds, in which the end point statistics determine the probability correct. In binary forced-choice paradigms where there are only two choice categories (positive or negative as in Fig. 3) a decision variable greater than 0 (or zo) yields a positive response. In the direction-recognition paradigm that was utilized in several studies investigating the precision of vestibular perception (Grabherr, Nicoucar, Mast, & Merfeld, 2008; Karmali, Lim, & Merfeld, 2014; Lim, Karmali, Nicoucar, & Merfeld, 2017; Valko, Lewis, Priesol, & Merfeld, 2012), the threshold is defined at the stimulus level that would yield 84% (1a-) correct direction choice. In DDM's, this corresponds to the stimulus level v at which E[y(v, t)] = Var[y(t)]. Then solving for v gives the direction-recognition
threshold Tm,SDT(t) as a function of stimulus duration t for pDDM. Subscript m indicates the DDM variant (p, cb, us, or hpf). Hence the threshold expressions for the four models are
z2 j20 TP,SD7(t) = Tcb,SDT(t) =It 2 212t! 2 L Tus,SDT = 2 Z+O2LO (14) z2 f2 Thpf,SDT(t) =
(-
2TYV e- + i (15)For cbDDM, because SDT assumes no decision-boundary, Tcb,SDT =Tp,SDT(t) as in Equation (13). In Equations (13) and (14), even though the accumulated evidence
approaches infinity with increasing time, the threshold approaches a non-zero asymptote because the variance also increases at a comparable rate. Therefore, the steady-state
threshold asymptotes to qj + ft as t -> oo for pDDM, cbDDM, and usDDM. hpfDDM threshold
also asymptotes but to a different steady-state --+ + y as t - oo.
12 2r
Perceptual Threshold in Bounded DDM
In the past, response time (RT) and choice accuracy (Hawkins, Forstmann, Wagenmakers, Ratcliff, & Brown, 2015; Ratcliff, 2006; Ratcliff & Rouder, 1998; Usher & McClelland, 2001) were used to verify DDM. Although the experimental design herein does not allow RT measurement, the mathematical expression for choice accuracy can still be derived while assuming absorbing decision bounds. For instance, the decision process terminates when a decision variable hits a bound at any time before the stimulus ends, and the choice accuracy corresponds to the cumulative probability of hitting the correct bound plus the remaining decision variables on the correct side (Ratcliff, 2006). This concept of applying SDT to only the decision variables that did not reach a decision bound was proposed as "partial information theory" (Ratcliff, 2006). Since this study investigated direction-recognition decision processes, two decision bounds A or - A are assumed. At
time t, the probability of a decision variable yt hitting either A or -A is denoted as Prt. This A
Prt = Pr(yt > A) + Pr(yt < -A) (16)
A
Then the probability of a decision variable yt hitting one particular bound is the joint probability between the proportion that remains after the previous time t - At and the probability of the current yt distance being greater than the distance to the bound:
Pr(yt > A) = {1 - Pri) -{1 - cD(A; E[yt], Var[yt])} (17-1)
Pr(yt <-A) = {1 - - Pr1) - {cD(-A; E[yt], Var[yt])} (17-2)
The probability density of the correct RT given positive stimulus (e.g. response the positive direction given the positive stimulus) is provided in Eq. (17-1) while the incorrect RT (e.g. response in the negative direction given the positive stimulus) is provided in Eq. (17-2). Based on these, the choice accuracy is the sum of all the correct RT probability up until t and the remaining decision variables that are closer to the correct bound (equivalently
above zo given positive stimulus) at t. For Prt defined as the total choice accuracy, Prt is the
C C
sum of probability correct when given positive stimulus Prt (+I v > p) and when given
C
negative stimulus Prt(-Iv <M).
C
Prt(+Iv > y) = Z =At Pr(y > A1) +
I1
- t Pr) - Pr(yt > zo) (18-1)Prt(-Iv < y) = Z =At Pr(y < -Ai) + {1 - = Pr1). Pr(yt < zo) (18-2)
Prt=Prt(+Iv > y) - Pr (v > pi) + Prt(-Iv < y) - Pr (v < y) (18-3)
C C C
Solving for v(Prt = 0.84) yields the threshold prediction as a function of time. Because of
C
the iterative nature of Eq. (18), an analytical threshold expression was not derived. Rather, these equations were solved numerically via DDM modeling.
Fitting
Fitting a psychometric function to binary responses
The models were fit using maximum-likelihood methods. First, the likelihood
function L for the models based on SDT (Eq. 8) was defined as the joint probability of all of the responses R (-or +) happening given the stimulus and duration arrays V and T,
respectively, while assuming a set of free parameters for an unbounded fit model (Ut) or a different set of parameters for a bounded ('B) fit model.
L(RIV,T;'U) = H R=+O (E[y(V, T)]; zo, Var[y(T)]) '-FR=-1 - c(E [y(V, T)]; zo, Var[y(T)])} (19-1) As one example, as shown in Table 1, pDDM has free parameter set U = {p, a, 1, zo, z}.
Taking a natural log of L(R IV, T; U) yields the log likelihood
InL = ER=+ ln{c (E[y(V, T)]; zo, Var[y(T)])) + R l In{1 - P(E[y(V, T)]; zo, Var[y(T)])} (19-2)
The likelihood for the bounded DDM takes a more complicated form, but is similar in principle to Eq. (19-1),
L(R IV, T; 3) = HR=+{Prc(+Iv > , 01 HR=-( - Pr(+Iv>u,
0)1
(20-1)- HR=-{Prc(-Iv <, ) -HR=+(l - Prc(-Iv <[y, t)))
The free parameter set here includes the bound parameter as well such that
3 = [tp, u, -q, zo, z, al for pDDM. (See Table 1 presented earlier.) Consequently, the log
likelihood of Eq. (20-1) becomes
lnL = ZR=+ln{Pr,(+Iv> X 0) + ZR=. n{(1 - Prc(+Iv > M, t)) (20-2)
+ R- ln{Prc(+Iv< t) + iR=+ln [(1 - Prc(-Iv < y, t)))
The DDM parameters, U and B, that yielded a minimum negative log-likelihood (NLL =
-InL) were found using fmincon in MATLAB.
Fitting a confidence function to confidence responses
Similar to the method used to fit binary data, the confidence models were fitted using maximum-likelihood methods (Yi & Merfeld, 2016) when sufficient measurements were available to calculate the likelihood. This time, instead of binary responses, the likelihood is defined as the joint probability of all of the confidence responses C
E
[0 100]happening given the stimulus and duration arrays V and T, as well as the underlying perceptual parameters, U or B, found from the binary data fit while assuming confidence function parameters K = {KO, K,,
Tc)-L(CIV, T, U or B; K) = H c Pr (c - '< conf < cj + (21-1)
Then the loglikelihood is
InL(CIV, T, U or B; K) = c ln Pr (c-< conf < cj + ' (21-2)
Equations 21-1 and 21-2 require the time at which the confidence is calculated since
confidence at time t is measured against Var[y(t)]. Within SDT, the confidence is calculated always at the end of the stimulus at t=T. However, in the bounded DDM's, the time at which