arXiv:0907.4398v2 [hep-ex] 28 Sep 2009
W W + W Z → ℓνjj events in p ¯
p collisions at
s = 1.96 TeV
V.M. Abazov37, B. Abbott75, M. Abolins65, B.S. Acharya30, M. Adams51, T. Adams49, E. Aguilo6, M. Ahsan59, G.D. Alexeev37, G. Alkhazov41, A. Alton64,a, G. Alverson63, G.A. Alves2, L.S. Ancu36, M.S. Anzelc53, M. Aoki50, Y. Arnoud14, M. Arov60, M. Arthaud18, A. Askew49,b, B. ˚Asman42, O. Atramentov49,b, C. Avila8, J. BackusMayes82,
F. Badaud13, L. Bagby50, B. Baldin50, D.V. Bandurin59, S. Banerjee30, E. Barberis63, A.-F. Barfuss15, P. Bargassa80, P. Baringer58, J. Barreto2, J.F. Bartlett50, U. Bassler18, D. Bauer44, S. Beale6, A. Bean58, M. Begalli3, M. Begel73, C. Belanger-Champagne42, L. Bellantoni50, A. Bellavance50, J.A. Benitez65, S.B. Beri28,
G. Bernardi17, R. Bernhard23, I. Bertram43, M. Besan¸con18, R. Beuselinck44, V.A. Bezzubov40, P.C. Bhat50, V. Bhatnagar28, G. Blazey52, S. Blessing49, K. Bloom67, A. Boehnlein50, D. Boline62, T.A. Bolton59, E.E. Boos39,
G. Borissov43, T. Bose62, A. Brandt78, R. Brock65, G. Brooijmans70, A. Bross50, D. Brown19, X.B. Bu7, D. Buchholz53, M. Buehler81, V. Buescher22, V. Bunichev39, S. Burdin43,c, T.H. Burnett82, C.P. Buszello44, P. Calfayan26, B. Calpas15, S. Calvet16, J. Cammin71, M.A. Carrasco-Lizarraga34, E. Carrera49, W. Carvalho3, B.C.K. Casey50, H. Castilla-Valdez34, S. Chakrabarti72, D. Chakraborty52, K.M. Chan55, A. Chandra48, E. Cheu46,
D.K. Cho62, S.W. Cho32, S. Choi33, B. Choudhary29, T. Christoudias44, S. Cihangir50, D. Claes67, J. Clutter58, M. Cooke50, W.E. Cooper50, M. Corcoran80, F. Couderc18, M.-C. Cousinou15, D. Cutts77, M. ´Cwiok31, A. Das46,
G. Davies44, K. De78, S.J. de Jong36, E. De La Cruz-Burelo34, K. DeVaughan67, F. D´eliot18, M. Demarteau50, R. Demina71, D. Denisov50, S.P. Denisov40, S. Desai50, H.T. Diehl50, M. Diesburg50, A. Dominguez67, T. Dorland82,
A. Dubey29, L.V. Dudko39, L. Duflot16, D. Duggan49, A. Duperrin15, S. Dutt28, A. Dyshkant52, M. Eads67, D. Edmunds65, J. Ellison48, V.D. Elvira50, Y. Enari77, S. Eno61, M. Escalier15, H. Evans54, A. Evdokimov73,
V.N. Evdokimov40, G. Facini63, A.V. Ferapontov59, T. Ferbel61,71, F. Fiedler25, F. Filthaut36, W. Fisher50, H.E. Fisk50, M. Fortner52, H. Fox43, S. Fu50, S. Fuess50, T. Gadfort70, C.F. Galea36, A. Garcia-Bellido71, V. Gavrilov38, P. Gay13, W. Geist19, W. Geng15,65, C.E. Gerber51, Y. Gershtein49,b, D. Gillberg6, G. Ginther50,71,
B. G´omez8, A. Goussiou82, P.D. Grannis72, S. Greder19, H. Greenlee50, Z.D. Greenwood60, E.M. Gregores4, G. Grenier20, Ph. Gris13, J.-F. Grivaz16, A. Grohsjean18, S. Gr¨unendahl50, M.W. Gr¨unewald31, F. Guo72, J. Guo72,
G. Gutierrez50, P. Gutierrez75, A. Haas70, P. Haefner26, S. Hagopian49, J. Haley68, I. Hall65, R.E. Hall47, L. Han7, K. Harder45, A. Harel71, J.M. Hauptman57, J. Hays44, T. Hebbeker21, D. Hedin52, J.G. Hegeman35, A.P. Heinson48,
U. Heintz62, C. Hensel24, I. Heredia-De La Cruz34, K. Herner64, G. Hesketh63, M.D. Hildreth55, R. Hirosky81, T. Hoang49, J.D. Hobbs72, B. Hoeneisen12, M. Hohlfeld22, S. Hossain75, P. Houben35, Y. Hu72, Z. Hubacek10, N. Huske17, V. Hynek10, I. Iashvili69, R. Illingworth50, A.S. Ito50, S. Jabeen62, M. Jaffr´e16, S. Jain75, K. Jakobs23,
D. Jamin15, R. Jesik44, K. Johns46, C. Johnson70, M. Johnson50, D. Johnston67, A. Jonckheere50, P. Jonsson44, A. Juste50, E. Kajfasz15, D. Karmanov39, P.A. Kasper50, I. Katsanos67, V. Kaushik78, R. Kehoe79, S. Kermiche15,
N. Khalatyan50, A. Khanov76, A. Kharchilava69, Y.N. Kharzheev37, D. Khatidze77, M.H. Kirby53, M. Kirsch21, B. Klima50, J.M. Kohli28, J.-P. Konrath23, A.V. Kozelov40, J. Kraus65, T. Kuhl25, A. Kumar69, A. Kupco11, T. Kurˇca20, V.A. Kuzmin39, J. Kvita9, F. Lacroix13, D. Lam55, S. Lammers54, G. Landsberg77, P. Lebrun20, H.S. Lee32, W.M. Lee50, A. Leflat39, J. Lellouch17, L. Li48, Q.Z. Li50, S.M. Lietti5, J.K. Lim32, D. Lincoln50, J. Linnemann65, V.V. Lipaev40, R. Lipton50, Y. Liu7, Z. Liu6, A. Lobodenko41, M. Lokajicek11, P. Love43, H.J. Lubatti82, R. Luna-Garcia34,d, A.L. Lyon50, A.K.A. Maciel2, D. Mackin80, P. M¨attig27, R. Maga˜na-Villalba34,
P.K. Mal46, S. Malik67, V.L. Malyshev37, Y. Maravin59, B. Martin14, R. McCarthy72, C.L. McGivern58, M.M. Meijer36, A. Melnitchouk66, L. Mendoza8, D. Menezes52, P.G. Mercadante5, M. Merkin39, K.W. Merritt50, A. Meyer21, J. Meyer24, N.K. Mondal30, R.W. Moore6, T. Moulik58, G.S. Muanza15, M. Mulhearn70, O. Mundal22,
L. Mundim3, E. Nagy15, M. Naimuddin50, M. Narain77, H.A. Neal64, J.P. Negret8, P. Neustroev41, H. Nilsen23, H. Nogima3, S.F. Novaes5, T. Nunnemann26, G. Obrant41, C. Ochando16, D. Onoprienko59, J. Orduna34, N. Oshima50, N. Osman44, J. Osta55, R. Otec10, G.J. Otero y Garz´on1, M. Owen45, M. Padilla48, P. Padley80, M. Pangilinan77, N. Parashar56, S.-J. Park24, S.K. Park32, J. Parsons70, R. Partridge77, N. Parua54, A. Patwa73,
B. Penning23, M. Perfilov39, K. Peters45, Y. Peters45, P. P´etroff16, R. Piegaia1, J. Piper65, M.-A. Pleier22, P.L.M. Podesta-Lerma34,e, V.M. Podstavkov50, Y. Pogorelov55, M.-E. Pol2, P. Polozov38, A.V. Popov40, M. Prewitt80, S. Protopopescu73, J. Qian64, A. Quadt24, B. Quinn66, A. Rakitine43, M.S. Rangel16, K. Ranjan29,
P.N. Ratoff43, P. Renkel79, P. Rich45, M. Rijssenbeek72, I. Ripp-Baudot19, F. Rizatdinova76, S. Robinson44, M. Rominsky75, C. Royon18, P. Rubinov50, R. Ruchti55, G. Safronov38, G. Sajot14, A. S´anchez-Hern´andez34,
M.P. Sanders26, B. Sanghi50, G. Savage50, L. Sawyer60, T. Scanlon44, D. Schaile26, R.D. Schamberger72, Y. Scheglov41, H. Schellman53, T. Schliephake27, S. Schlobohm82, C. Schwanenberger45, R. Schwienhorst65,
J. Sekaric49, H. Severini75, E. Shabalina24, M. Shamim59, V. Shary18, A.A. Shchukin40, R.K. Shivpuri29, V. Siccardi19, V. Simak10, V. Sirotenko50, P. Skubic75, P. Slattery71, D. Smirnov55, G.R. Snow67, J. Snow74, S. Snyder73, S. S¨oldner-Rembold45, L. Sonnenschein21, A. Sopczak43, M. Sosebee78, K. Soustruznik9, B. Spurlock78,
J. Stark14, V. Stolin38, D.A. Stoyanova40, J. Strandberg64, M.A. Strang69, E. Strauss72, M. Strauss75, R. Str¨ohmer26, D. Strom51, L. Stutte50, S. Sumowidagdo49, P. Svoisky36, M. Takahashi45, A. Tanasijczuk1, W. Taylor6, B. Tiller26, M. Titov18, V.V. Tokmenin37, I. Torchiani23, D. Tsybychev72, B. Tuchming18, C. Tully68,
P.M. Tuts70, R. Unalan65, L. Uvarov41, S. Uvarov41, S. Uzunyan52, P.J. van den Berg35, R. Van Kooten54, W.M. van Leeuwen35, N. Varelas51, E.W. Varnes46, I.A. Vasilyev40, P. Verdier20, L.S. Vertogradov37, M. Verzocchi50, M. Vesterinen45, D. Vilanova18, P. Vint44, P. Vokac10, R. Wagner68, H.D. Wahl49, M.H.L.S. Wang71,
J. Warchol55, G. Watts82, M. Wayne55, G. Weber25, M. Weber50,f, L. Welty-Rieger54, A. Wenger23,g, M. Wetstein61, A. White78, D. Wicke25, M.R.J. Williams43, G.W. Wilson58, S.J. Wimpenny48, M. Wobisch60,
D.R. Wood63, T.R. Wyatt45, Y. Xie77, C. Xu64, S. Yacoob53, R. Yamada50, W.-C. Yang45, T. Yasuda50, Y.A. Yatsunenko37, Z. Ye50, H. Yin7, K. Yip73, H.D. Yoo77, S.W. Youn50, J. Yu78, C. Zeitnitz27, S. Zelitch81, T. Zhao82, B. Zhou64, J. Zhu72, M. Zielinski71, D. Zieminska54, L. Zivkovic70, V. Zutshi52, and E.G. Zverev39
(The DØ Collaboration) 1
Universidad de Buenos Aires, Buenos Aires, Argentina 2
LAFEX, Centro Brasileiro de Pesquisas F´ısicas, Rio de Janeiro, Brazil 3
Universidade do Estado do Rio de Janeiro, Rio de Janeiro, Brazil 4
Universidade Federal do ABC, Santo Andr´e, Brazil 5
Instituto de F´ısica Te´orica, Universidade Estadual Paulista, S˜ao Paulo, Brazil 6
University of Alberta, Edmonton, Alberta, Canada; Simon Fraser University, Burnaby, British Columbia, Canada; York University, Toronto, Ontario, Canada and McGill University, Montreal, Quebec, Canada 7
University of Science and Technology of China, Hefei, People’s Republic of China 8
Universidad de los Andes, Bogot´a, Colombia 9
Center for Particle Physics, Charles University, Faculty of Mathematics and Physics, Prague, Czech Republic 10
Czech Technical University in Prague, Prague, Czech Republic 11
Center for Particle Physics, Institute of Physics,
Academy of Sciences of the Czech Republic, Prague, Czech Republic 12
Universidad San Francisco de Quito, Quito, Ecuador 13
LPC, Universit´e Blaise Pascal, CNRS/IN2P3, Clermont, France 14LPSC, Universit´e Joseph Fourier Grenoble 1, CNRS/IN2P3,
Institut National Polytechnique de Grenoble, Grenoble, France 15
CPPM, Aix-Marseille Universit´e, CNRS/IN2P3, Marseille, France 16
LAL, Universit´e Paris-Sud, IN2P3/CNRS, Orsay, France 17
LPNHE, IN2P3/CNRS, Universit´es Paris VI and VII, Paris, France 18
CEA, Irfu, SPP, Saclay, France 19
IPHC, Universit´e de Strasbourg, CNRS/IN2P3, Strasbourg, France
20IPNL, Universit´e Lyon 1, CNRS/IN2P3, Villeurbanne, France and Universit´e de Lyon, Lyon, France 21
III. Physikalisches Institut A, RWTH Aachen University, Aachen, Germany 22
Physikalisches Institut, Universit¨at Bonn, Bonn, Germany 23Physikalisches Institut, Universit¨at Freiburg, Freiburg, Germany 24
II. Physikalisches Institut, Georg-August-Universit¨at G¨ottingen, G¨ottingen, Germany 25
Institut f¨ur Physik, Universit¨at Mainz, Mainz, Germany 26
Ludwig-Maximilians-Universit¨at M¨unchen, M¨unchen, Germany 27
Fachbereich Physik, University of Wuppertal, Wuppertal, Germany 28
Panjab University, Chandigarh, India 29
Delhi University, Delhi, India
30Tata Institute of Fundamental Research, Mumbai, India 31
University College Dublin, Dublin, Ireland 32
Korea Detector Laboratory, Korea University, Seoul, Korea 33
SungKyunKwan University, Suwon, Korea 34
CINVESTAV, Mexico City, Mexico 35
FOM-Institute NIKHEF and University of Amsterdam/NIKHEF, Amsterdam, The Netherlands 36Radboud University Nijmegen/NIKHEF, Nijmegen, The Netherlands
37
Joint Institute for Nuclear Research, Dubna, Russia 38
Institute for Theoretical and Experimental Physics, Moscow, Russia 39
Moscow State University, Moscow, Russia 40
41
Petersburg Nuclear Physics Institute, St. Petersburg, Russia 42
Stockholm University, Stockholm, Sweden, and Uppsala University, Uppsala, Sweden 43Lancaster University, Lancaster, United Kingdom
44
Imperial College, London, United Kingdom 45
University of Manchester, Manchester, United Kingdom 46University of Arizona, Tucson, Arizona 85721, USA 47
California State University, Fresno, California 93740, USA 48
University of California, Riverside, California 92521, USA 49Florida State University, Tallahassee, Florida 32306, USA 50
Fermi National Accelerator Laboratory, Batavia, Illinois 60510, USA 51
University of Illinois at Chicago, Chicago, Illinois 60607, USA 52
Northern Illinois University, DeKalb, Illinois 60115, USA 53
Northwestern University, Evanston, Illinois 60208, USA 54
Indiana University, Bloomington, Indiana 47405, USA 55
University of Notre Dame, Notre Dame, Indiana 46556, USA 56Purdue University Calumet, Hammond, Indiana 46323, USA
57
Iowa State University, Ames, Iowa 50011, USA 58
University of Kansas, Lawrence, Kansas 66045, USA 59
Kansas State University, Manhattan, Kansas 66506, USA 60
Louisiana Tech University, Ruston, Louisiana 71272, USA 61
University of Maryland, College Park, Maryland 20742, USA 62
Boston University, Boston, Massachusetts 02215, USA 63
Northeastern University, Boston, Massachusetts 02115, USA 64
University of Michigan, Ann Arbor, Michigan 48109, USA 65
Michigan State University, East Lansing, Michigan 48824, USA 66
University of Mississippi, University, Mississippi 38677, USA 67
University of Nebraska, Lincoln, Nebraska 68588, USA 68
Princeton University, Princeton, New Jersey 08544, USA 69
State University of New York, Buffalo, New York 14260, USA 70
Columbia University, New York, New York 10027, USA 71
University of Rochester, Rochester, New York 14627, USA 72State University of New York, Stony Brook, New York 11794, USA
73
Brookhaven National Laboratory, Upton, New York 11973, USA 74
Langston University, Langston, Oklahoma 73050, USA 75University of Oklahoma, Norman, Oklahoma 73019, USA 76
Oklahoma State University, Stillwater, Oklahoma 74078, USA 77
Brown University, Providence, Rhode Island 02912, USA 78University of Texas, Arlington, Texas 76019, USA 79
Southern Methodist University, Dallas, Texas 75275, USA 80
Rice University, Houston, Texas 77005, USA 81
University of Virginia, Charlottesville, Virginia 22901, USA and 82
University of Washington, Seattle, Washington 98195, USA (Dated: July 24, 2009)
We present a direct measurement of trilinear gauge boson couplings at γW W and ZW W vertices in W W and W Z events produced in p¯p collisions at√s = 1.96 TeV. We consider events with one electron or muon, missing transverse energy, and at least two jets. The data were collected using the D0 detector and correspond to 1.1 fb−1of integrated luminosity. Considering two different relations between the couplings at the γW W and ZW W vertices, we measure these couplings at 68% C.L. to be κγ = 1.07+0.26 −0.29, λ = 0.00 +0.06 −0.06, and g Z 1 = 1.04+0.09
−0.09 in a scenario respecting SU (2)L⊗ U(1)Y gauge symmetry and κ = 1.04+0.11
−0.11 and λ = 0.00 +0.06
−0.06 in an “equal couplings” scenario.
PACS numbers: 14.70.Fm, 13.40.Em, 13.85.Rm, 14.70.Hp
I. INTRODUCTION
A primary motivation for studying diboson physics is that the production of two weak bosons and their in-teractions provide tests of the electroweak sector of the standard model (SM) arising from the vertices involving trilinear gauge boson couplings (TGCs) [1]. Any devia-tion of TGCs from their predicted SM values would be an
indication for new physics [2] and could provide informa-tion on a mechanism for electroweak symmetry breaking (EWSB).
The TGCs involving the W boson have been previ-ously probed in W W , W γ and W Z production at the Tevatron p¯p Collider [3, 4, 5, 6] and W W production at the CERN e+e− collider (LEP) [7, 8, 9, 10], at different center-of-mass energies and luminosities but no
devia-tion from the SM predicdevia-tions has been observed. The LEP experiments benefit from the full reconstruction of event kinematics in e+e−collisions, high signal selection efficiencies and small background contamination. At the Tevatron, despite larger backgrounds and limited ability to fully reconstruct event kinematics, larger collision en-ergies are probed and W Z production can be used to di-rectly probe the ZW W coupling. The study of W W and W Z production at hadron colliders has focused primarily on the purely leptonic final states [3, 4, 11]. In this paper we present a measurement of the γW W/ZW W couplings based on the same dataset used to obtain the recent ev-idence for semileptonic decays of W W/W Z boson pairs in hadron collisions [12].
As shown in the tree-level diagrams of Fig. 1, TGCs contribute to W W/W Z production via s-channel dia-grams. Production of W W via the s-channel process contains both trilinear γW W and ZW W gauge boson vertices. On the other hand, W Z production is sensitive exclusively to the ZW W vertex.
(a)
q
_’
q
W
W/Z
q’
(b)q
q
_Z/
γ
*W
W
(c)q
q
_’
W
W
Z
FIG. 1: Tree-level Feynman diagrams for the processes of W W/W Z production at the Tevatron collider via (a) t-channel exchange and (b) and (c) s-t-channel.
II. PHENOMENOLOGY
Unraveling the origins of EWSB and the mass generation mechanism are currently the highest priorities in particle physics. The SM introduces an effective Higgs potential with an upper limit on the Higgs boson mass of ≃ 1 TeV to prevent tree-level unitarity violation [13].
In a Higgs-less scenario or for heavier Higgs boson masses this unitarity limit on the Higgs boson mass indi-cates the mass scale at which the SM must be superseded by new physics in order to restore unitarity at TeV ener-gies. In this case, the SM is considered to be a low-energy approximation of a general theory. Conversely, if a light Higgs boson exists, the SM may nevertheless be incom-plete and new physics could appear at higher energies.
The effects of this general theory can be described by an effective Lagrangian, Leff, describing low-energy interactions of the new physics at higher energies in a model-independent manner. Expanding in powers of (1/ΛN P) [14]: Leff = LSMeff + X n≥1 X i fi Λn N P O(n+4)i (1) where LSM
eff is the SU (2)L× U(1)Y gauge-invariant SM Lagrangian, ΛN P is the energy scale of the new physics and i sums over all operators Oi of the given energy dimension (n + 4). The coefficients fi parametrize all possible interactions at low energies. Effects of the new physics may not be directly observable because the scale of the new physics is above the energies currently exper-imentally accessible. However, there could be indirect consequences with measurable effects; for example, on gauge boson interactions.
For the study of gauge boson interactions, the rele-vant terms in Eq. 1 are those that produce vertices with three or four gauge bosons. The effective Lagrangian, Leff, that parametrizes the most general Lorentz invari-ant V W W vertices (V = Z, γ) involving two W bosons can be defined as [15] LV W W eff gV W W = ig V 1(Wµν† WµVν− Wµ†VνWµν) + iκVWµ†WνVµν+ iMλV2 WW † λµWνµVνλ − gV 4Wµ†Wν(∂µVν+ ∂νVµ) + gV 5ǫµνλρ(Wµ∗∂λWν− ∂λWµ†Wν)Vρ + i˜κVWµ†WνV˜µν+ i ˜ λV M2 WW † λµWνµV˜νλ (2)
where ǫµνλρ is the fully antisymmetric ǫ tensor, W de-notes the W boson field, V dede-notes the photon or Z boson field, Vµν = ∂µVν− ∂νVµ, Wµν = ∂µWν− ∂νWµ, ˜Vµν = 1/2(ǫµνλρVλρ), gγW W = −e, and gZW W = −e cot θW, where e is the electron electric charge, θW is the weak mixing angle and MW is the W boson mass. The 14 cou-pling parameters of V W W vertices are grouped accord-ing to the symmetry properties of their correspondaccord-ing op-erators: C (charge conjugation) and P (parity) conserv-ing (gV
1, κV, and λV), C and P violating but CP con-serving (gV
5), and CP violating (g4V, ˜κV, and ˜λV). In the SM all couplings vanish (gV
5 = g4V = ˜κV = ˜λV = λV = 0) except gV
1 = κV = 1. The value of g1γ is fixed by elec-tromagnetic gauge invariance (g1γ = 1) while the value of gZ
1 may differ from its SM value. Considering the C and P conserving couplings only, five couplings remain, and their deviations from the SM values are denoted as
the anomalous TGCs ∆gZ
1 = (gZ1 − 1), ∆κγ = (κγ− 1), ∆κZ = (κZ− 1), λγ and λZ.
If non zero anomalous TGCs are introduced in Eq. 2, an unphysical increase in the W W and W Z production cross sections will result as the center-of-mass energy, √
ˆ
s, of the partonic constituents approaches ΛN P. Such divergences would violate unitarity, but can be controlled by introducing a form factor for which the anomalous coupling vanishes as ˆs → ∞:
∆a(ˆs) = ∆a0 (1 + ˆs/Λ2
N P)n
(3) where n = 2 for γW W and ZW W couplings, and a0 is a low-energy approximation of the coupling a(ˆs). Thus, the previously described anomalous TGCs scale as ∆a0 in Eq. 3. The values of ∆a0 (and a0) are con-strained by requiring the S-matrix unitarity condition that bounds the J = 1 partial-wave amplitude of inelas-tic vector boson scattering by a constant. These con-stants were derived by Baur and Zeppenfeld [16] for each coupling that contributes to reduced helicity amplitudes in W Z, γW , or W W production via s-channel. Calcu-lated with MW = 80 GeV, MZ = 91.1 GeV and with the dipole form factor as given by Eq. 3, the unitarity bounds for ∆κγ, ∆κZ, ∆g1Z and λ TGCs are
|∆κ0 γ| ≤ n n (n−1)n−11.81 TeV 2 Λ2 N P , |∆λ 0 γ| ≤ n n (n−1)n−10.96 TeV 2 Λ2 N P |∆κ0 Z| ≤ n n (n−1)n−1 0.83 TeV2 Λ2 N P , |∆λ 0 Z| ≤ n n (n−1)n−1 0.52 TeV2 Λ2 N P |∆gZ0 1 | ≤ n n (n−1)n−10.84 TeV 2 Λ2 N P (4) For n = 2 and ΛN P = 2 TeV, the unitarity condition sets constraints on the TGCs of |∆κ0
γ| ≤ 1.81, |∆λ0γ| ≤ 0.96, |∆κ0
Z| ≤ 0.83, |∆λ0Z| ≤ 0.52, and |∆gZ01 | ≤ 0.84. The scale of new physics, ΛN P, was chosen such that the uni-tarity limits are close to, but no tighter than, the cou-pling limits set by data. Clearly, as ΛN P increases the effects on anomalous TGCs decrease and their observa-tion requires either more precise measurements or higher ˆ
s.
III. RELATIONS BETWEEN COUPLINGS
The interpretation of the effective Lagrangian [Eq. 1] de-pends on the specified symmetry and the particle content of the underlying low-energy theory. In general, Leff can be expressed using either the linear or nonlinear realiza-tion of the SU (2)L×U(1)Y symmetry [17] to prevent uni-tarity violation, depending on its particle content. Thus, Leff can be rewritten in a form that includes the opera-tors that describe interactions involving additional gauge bosons, and/or Goldstone bosons, and/or the Higgs field and operators of interest for any new physics effects. The number of operators can be reduced by considering their detectable contribution to the measured coupling.
Assuming the existence of a light Higgs boson, the low-energy spectrum is augmented by the Higgs doublet field φ, and SU (2)L and U (1)Y gauge fields. Because exper-imental evidence is consistent with the existence of an SU (2)L× U(1)Y gauge symmetry, it is reasonable to re-quire Leff to be invariant with respect to this symmetry. Thus, the second term in Eq. 1 consisting of operators up to energy dimension six, is also required to have lo-cal SU (2)L× U(1)Y gauge symmetry and the underly-ing physics is described usunderly-ing a linear realization [18] of the SU (2)L×U(1)Y symmetry. By considering operators that give rise to nonstandard γW W and ZW W couplings at the tree level, Leff can be parametrized in terms of the αi parameters [19]. Those parameters relate to the fi parameters of the Lagrangian given in Eq. 1 and to the TGCs in the Lagrangian of Eq. 2 as follows [20]:
∆κγ = (fW φ+ fBφ) M 2 W 2Λ2 N P = αW φ+ αBφ ∆gZ 1 = fW φ M 2 Z 2Λ2 N P = ∆κZ+ s2W c2 W∆κγ = αW φ c2 W λ = λγ = λZ = 3g2 M 2 W 2Λ2 N PfW W W = αW (5)
where g is the SU (2)L gauge coupling constant (g = e/sinθW), cW = cos θW, sW = sin θW, and indices W φ (Bφ) and W refer to operators that describe the inter-actions between the W (B) gauge boson field and the Higgs field φ, and the gauge boson field interactions, re-spectively. The relations in Eq. 5 give the expected or-der of magnitude for TGCs to be O(M2
W/Λ2N P). Thus, for ΛN P ≈ 2 TeV, the expected order of magnitude for ∆κγ, ∆g1Z, and λ is O(10−3). This gauge-invariant parametrization, also used at LEP, gives the following relations between the ∆κγ, ∆g1Z and λ couplings:
∆κZ = ∆gZ1 − ∆κγ· tan2θW and λ ≡ λZ = λγ (6) Hereafter we will refer to this relationship as the “LEP parametrization” [or SU(2)xU(1) respecting scenario] with three different parameters: ∆κγ, λ and ∆g1Z. The coupling ∆κZ can be expressed via the relation given by Eq. 6.
A second interpretive scenario, referred to as the equal couplings (or ZW W =γW W ) scenario [1], specifies the γW W and ZW W couplings to be equal. This is also relevant for studying interference effects between the photon and Z-exchange diagrams in W W production (see Fig. 1). In this case, electromagnetic gauge in-variance forbids any deviation of gγ1 from its SM value (∆gZ
1 = ∆g γ
1 = 0 ) and the relations between the cou-plings become
∆κ ≡ ∆κZ = ∆κγ and λ ≡ λZ = λγ (7) As already stated, for W W and W Z production the anomalous couplings contribute to the total cross section via the s-channel diagram. Anomalous couplings enter the differential production cross sections through differ-ent helicity amplitudes that depend on ˆs. The coupling
λ primarily affects transversely polarized gauge bosons, which is the main contribution to the total cross section. Consequently, for a given ˆs, the sensitivity to the cou-pling λ is higher than to κ because λ is multiplied by ˆs in dominating amplitudes for W W and W Z production. Different sensitivity to the κ couplings is expected due to the choice of scenario: the sensitivity to the κ coupling in the equal couplings scenario is higher than in the LEP parametrization scenario simply because of the different relations between Eq. 6 and Eq. 7.
IV. D0 DETECTOR
The analyzed data were produced in p¯p collisions at √
s = 1.96 TeV by the Tevatron collider at Fermilab and collected by the D0 detector [21] during 2002 - 2006. They correspond to 1.07 ± 0.07 fb−1 of integrated lu-minosity for each of the two lepton channels (eνq ¯q and µνq ¯q).
The D0 detector is a general purpose collider detec-tor consisting of a central tracking system, a calorimeter system, and an outer muon system. The central track-ing system consists of a silicon microstrip tracker and a central fiber tracker, both located within a 2 T super-conducting solenoidal magnet, with designs optimized for tracking and vertexing at pseudorapidities [22] |η| < 3 and |η| < 2.5, respectively. A liquid-argon and uranium calorimeter has a central section covering pseudorapidi-ties |η| up to ≈ 1.1, and two end calorimeters that extend coverage to |η| ≈ 4.2, with all three housed in separate cryostats [23]. An outer muon system, covering |η| < 2, consists of a layer of tracking detectors and scintillation trigger counters in front of 1.8 T iron toroids, followed by two similar layers after the toroids [24].
Jets at D0 are reconstructed using the Run II cone algorithm [25] with cone radius R =p(∆y)2+ (∆φ)2= 0.5; where y is the rapidity. Jet energies are corrected to the particle level. The jet energy resolution for data, defined as σpT/pT, ranges from ∼ 15% − 25% for jets
with pT = 20 GeV to ∼ 7% − 12% for jets with pT = 300 GeV, depending on the rapidity of the jet.
The D0 detector uses a three-level trigger system for quickly filtering events from a rate of 1.7 MHz down to around 100 Hz that are stored for analysis. Events ana-lyzed in the electron channel had to pass a trigger based on a single electron or electron+jet(s) requirement, re-sulting in an efficiency of 98+2−3%. The triggers based on specific single muon and muon+jet(s) requirements are about 70% efficient. Thus, all available triggers were used for the muon channel to achieve higher efficiency. We select all events that satisfy our kinematic selection requirements with no specific trigger requirement. The efficiency in this kinematic region is very nearly 100%. To estimate and account for possible biases on the shape of kinematic distributions, we compare data selected with the inclusive triggers to data selected with triggers based on a single muon. In the kinematic region of interest, the
inclusive trigger is estimated to have a shape uncertainty of less than 5% and a normalization uncertainty of 2%.
V. EVENT SELECTION AND CROSS SECTION
MEASUREMENT
The analysis presented here builds upon a previous publication in which we reported the first evidence of W W/W Z production with semileptonic final states at a hadron collider [12]. Such events have two energetic jets from the hadronic decay of either a W or Z bo-son as well as an energetic charged lepton and significant missing transverse energy (indicating a neutrino) from the leptonic decay of the associated W boson. Thefore, at the analysis level, we selected events with a re-constructed electron or muon with transverse momen-tum pT ≥ 20 GeV and pseudorapidity |η| ≤ 1.1 (2.0) for electrons (muons), a missing transverse energy of E/T ≥ 20 GeV, and at least two jets with pT ≥ 20 GeV and |η| ≤ 2.5. The jet of highest pT was required to sat-isfy pT ≥ 30 GeV. To reduce background from processes that do not contain W → ℓν, we required the transverse mass [26] from the lepton and E/T to be Mℓν
T ≥ 35 GeV. The multijet background, for which a jet is misidenti-fied as a lepton, was estimated using independent data samples.
Signal (W W and W Z) and background (W +jets, Z+jets, t¯t and single top quark) processes were mod-eled using Monte Carlo (MC) simulation. All MC sam-ples were normalized using next-to-leading-order (NLO) or next-to-next-to-leading-order predictions for SM cross sections, except the dominant background W +jets, which was scaled to match the data as described below.
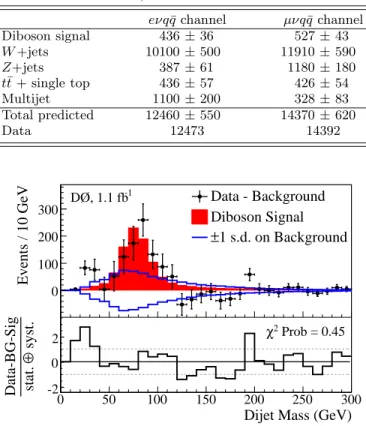
In the previously published cross section measurement analysis [12], the signal and backgrounds were further separated using a multivariate classifier to combine in-formation from several kinematic variables. The multi-variate classifier chosen was a random forest (RF) classi-fier [27, 28]. Thirteen well-modeled kinematic variables that demonstrated a difference in probability density be-tween signal and at least one of the backgrounds were used as inputs to the RF. The effects of systematic uncer-tainties on the normalization and on the shape of the RF distributions were evaluated for signal and backgrounds. The signal cross section was determined from a fit of signal and background RF output distributions to the data by minimizing a Poisson χ2 function (i.e., a neg-ative log likelihood) with respect to variations of the systematic uncertainties [29], assuming SM γW W and ZW W couplings. The fit simultaneously varied the W W/W Z and W +jets contributions, thereby also deter-mining the normalization factor for the W +jets MC sam-ple. The measured yields for signal and each background are given in Table I and the dijet mass peak extracted from data compared to the W W/W Z MC prediction is shown in Fig. 2. The combined fit of both channels to the RF output resulted in a measured cross section of
20.2 ± 2.5(stat) ± 3.6(syst) ± 1.2(lumi) pb, which is consistent with the NLO SM predicted cross section of σ(W W + W Z) = 16.1 ± 0.9 pb [30].
TABLE I: Measured number of events for signal and each background after the combined fit (with total uncertainties determined from the fit) and the number observed in data.
eνq ¯q channel µνq ¯q channel
Diboson signal 436 ± 36 527 ± 43 W +jets 10100 ± 500 11910 ± 590 Z+jets 387 ± 61 1180 ± 180 t¯t + single top 436 ± 57 426 ± 54 Multijet 1100 ± 200 328 ± 83 Total predicted 12460 ± 550 14370 ± 620 Data 12473 14392
Dijet Mass (GeV)
0 50 100 150 200 250 300 Events / 10 GeV 0 100 200 300 syst. ⊕ stat. Data-BG-Sig -2 0 2 Data - Background Diboson Signal 1 s.d. on Background ± -1 DØ, 1.1 fb Prob = 0.45 2 χ
FIG. 2: A comparison of the extracted signal (filled his-togram) to background-subtracted data (points), along with the ±1 standard deviation (s.d.) systematic uncertainty on the background. The residual distance between the data points and the extracted signal, divided by the total uncer-tainty, is given at the bottom.
VI. SENSITIVITY TO ANOMALOUS
COUPLINGS
For TGCs analysis we use the same selection and set limits on anomalous TGCs using a kinematic variable that is highly sensitive to the effects of deviations of ∆κ, λ, and ∆gZ
1. Because TGCs introduce terms in the Lagrangian that are proportional to the momentum of the weak boson, the differential and the total cross sec-tions will deviate from the SM prediction in the presence of anomalous couplings. This behavior is also expected at large production angles of a weak boson. Thus, the weak boson transverse momentum spectrum, pT, is sen-sitive to anomalous couplings and can show a significant enhancement at high values of pT.
The predicted W W and W Z production cross sections in the presence of anomalous TGCs are generated with
the leading order (LO) MC generator of Hagiwara, Zep-penfeld, and Woodside (HZW) [1] with CTEQ5L [31] parton distribution functions (PDFs). For example, the predicted “anomalous” cross sections relative to the SM value given by the HZW generator are shown in Fig. 3 as a function of anomalous couplings. For this figure we vary only the ∆κ coupling with the constraint between ∆κγ and ∆κZ as given by Eq. 6. The couplings λ and ∆g1Z are fixed to their SM values (i.e., λ = ∆gZ
1 = 0). The effects of anomalous couplings on two W W kinematic distributions (pT and rapidity of the q ¯q system) for the LEP parametrization are shown in Fig. 4. Here again, we vary only one coupling at a time (∆κ, λ or ∆gZ
1) ac-cording to Eq. 6 and leave the others fixed to their SM values. Finally, we choose the pq¯Tq (i.e., reconstructed di-jet pT) distribution to be our kinematic variable to probe anomalous couplings in data. Results are interpreted in two different scenarios: LEP parametrization and equal couplings, both with ΛN P = 2 TeV.
VII. REWEIGHTING METHOD
The Pythia [32] LO MC generator with CTEQ6L1 PDFs was used to simulate a sample of W W and W Z events at LO. We use the mc@nlo MC generator [33] with CTEQ6M PDFs to correct the event kinematics for higher order QCD effects by reweighting the differ-ential distributions of pT(W V ) and ∆R(W, V ) produced by Pythia to match those produced via mc@nlo. We simulate the LO effects of anomalous couplings on the pT distribution by reweighting the SM predictions for W W and W Z production from Pythia to include the contribution from the presence of anomalous couplings. The anomalous coupling contribution to the normaliza-tion and to the shape of pq¯Tq distribution relative to the SM is predicted by the HZW LO MC generator.
The reweighting method uses the matrix element val-ues given by the generator to predict an event rate in the presence of anomalous couplings. More precisely, an event rate (R) is assigned representing the ratio of the differential cross section with anomalous couplings to the SM differential cross section. Because the HZW gener-ator does not recalculate matrix element values, we use high statistics samples to estimate the weight as a func-tion of different anomalous couplings. Thus, we consider our approach to be a close approximation of an exact reweighting method.
The basis of the reweighting method is that, in general, the equation of the differential cross section, which has a quadratic dependence on the anomalous couplings, can be written as dσ = const · |M|2dX = const · |M|2 SM |M|2 |M|2 SMdX = const · |M|2 SM[1 + A(X)∆κ + B(X)∆κ2 + C(X)λ + D(X)λ2+ E(X)∆κλ + ...]dX = dσSM · R(X; ∆κ, λ, ...) (8)
where dσ is the differential cross section that includes the contribution from the anomalous couplings, dσSM is the SM differential cross section, X is a kinematic distribution sensitive to the anomalous couplings and A(X), B(X), C(X), D(X), and E(X) are reweighting coefficients dependent on X.
In the LEP parametrization, Eq. 8 is parametrized with the three couplings ∆κγ, λ, and ∆gZ1 and nine reweighting coefficients, A(X) − I(X). Thus, the weight R in the LEP parametrization scenario is defined as
R (X; ∆κ, λ, ∆g1) = 1 + A(X)∆κ + B(X)(∆κ)2+ C(X)λ + D(X)λ2 + E(X)∆g1+ F (X)(∆g1)2+ G(X)∆κλ + H(X)∆κ∆g1+ I(X)λ∆g1 (9) with ∆κ = ∆κγ, λ = λγ = λZ, and ∆g1= ∆g1Z.
In the equal couplings scenario, Eq. 8 is parametrized with the two couplings ∆κ and λ and five reweighting coefficients, A(X) − E(X). In this case the weight is defined as
R (X; ∆κ, λ) = 1 + A(X)∆κ + B(X)∆κ2
+ C(X)λ + D(X)λ2+ E(X)∆κλ (10)
with ∆κ = ∆κγ = ∆κZ and λ = λγ = λZ.
The kinematic variable X is chosen to be the pT of the q ¯q system, which is highly sensitive to anomalous couplings, as demonstrated in Fig. 4. Depending on the number of reweighting coefficients, a system of the same number of equations allows us to calculate their values for each event. Applied on the SM distribution of X for any combination of anomalous couplings, the distribu-tion of X weighted by R corresponds to the kinematic distribution in the presence of the given non-SM TGC.
To calculate reweighting coefficients in the LEP parametrization scenario, we generate nine different func-tions, Fi(i = 1 − 9), fitting the shape of the pqTq¯ distribu-tions in the presence of anomalous couplings. The values of anomalous TGCs are chosen to deviate ± 0.5 relative to the SM as shown in Table II. We calculate nine weights Ri normalizing the functions Fi with the cross sections given by the HZW generator.
TABLE II: The values of ∆κγ, λ and ∆gZ1 used to calcu-late the reweighting coefficients A(X) − I(X) in the LEP parametrization scenario. F1 F2 F3 F4 F5 F6 F7 F8 F9 ∆κγ 0 0 +0.5 -0.5 0 0 +0.5 +0.5 0 λ +0.5 -0.5 0 0 0 0 +0.5 0 +0.5 ∆gZ 1 0 0 0 0 +0.5 -0.5 0 +0.5 +0.5
To verify the derived reweighting parameters, we cal-culated the weight R for different ∆κ, λ, and/or ∆gZ 1 values, applied the reweighting coefficients and compared
reweighted pqTq¯shapes to those predicted by the genera-tor. Discrepancies in the pqTq¯shape of less than 5% and in normalization of less than 0.1% from those predicted by the generator represent reasonable agreement.
When measuring TGCs in the LEP parametrization, we vary two of the three couplings at a time, leaving the third coupling fixed to its SM value. This gives the three two-parameter combinations (∆κ, λ), (∆κ, ∆gZ
1), and (λ, ∆gZ
1). For the equal couplings scenario there is only the (∆κ, λ) combination. In each case, the two couplings being evaluated are each varied between -1 and +1 in steps of 0.01. For a given pair of anomalous cou-pling values, each event in a reconstructed dijet pT bin is weighted by the appropriate weight R and all the weights are summed in that bin. The observed limits are deter-mined from a fit of background and reweighted signal MC distributions for different anomalous couplings contribu-tions to the observed data using the dijet pT distribution of candidate events.
VIII. SYSTEMATIC UNCERTAINTIES
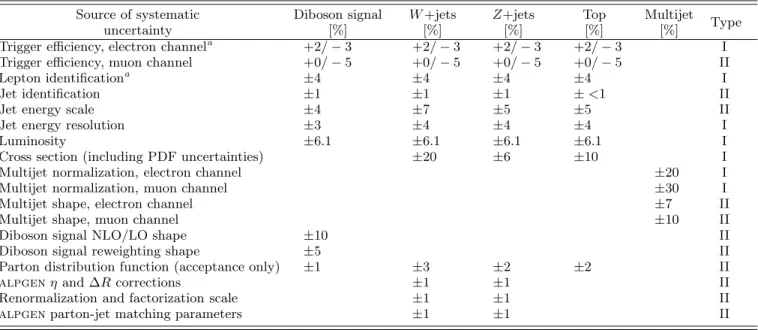
We consider two general types of systematic uncertain-ties. Uncertainties of the first class (type I) are related to the overall normalization and efficiencies of the var-ious contributing physical processes. The largest con-tributing type I uncertainties are those related to the accuracy of the theoretical cross section used to normal-ize the background processes. These uncertainties are considered to arise from Gaussian parent distributions. The second class (type II) consists of uncertainties that, when propagated through the analysis selection, impact the shape of the dijet pT distribution. The dependence of the dijet pT distribution on these uncertainties is deter-mined by varying each parameter by its associated un-certainty (±1 s.d.) and reevaluating the shape of the dijet pT distribution. The resulting shape dependence is considered to arise from a Gaussian parent distribution. Although type II uncertainties may also impact efficien-cies or normalization, any uncertainty shown to impact the shape of the dijet pT distribution is treated as type II. Both types of systematic uncertainty are assumed to be 100% correlated amongst backgrounds and signals. All sources of systematic uncertainty are assumed to be mutually independent, and no intercorrelation is propa-gated. A list of the systematic uncertainties used in this analysis can be found in Table III.
IX. ANOMALOUS COUPLING LIMITS
The fit utilizes the Minuit [34] software package to min-imize a Poisson χ2 with respect to variations to the sys-tematic uncertainties [29]. The χ2 function used is
χ2 = −2 ln Nb Y i=1 LP(d i; mi( ~R)) LP(d i; di) Ns Y k=1 LG(R kσk; 0, σk) LG(0; 0, σ k) !
TABLE III: Systematic uncertainties in percent for Monte Carlo simulations and multijet estimates. Uncertainties are identical for both lepton channels except where otherwise indicated. The nature of the uncertainty, i.e., whether it refers to a normal-ization uncertainty (type I) or a shape dependence (type II), is also provided. The values for uncertainties with a shape dependence correspond to the maximum amplitude of shape fluctuations in the dijet pT distribution (0 GeV ≤ pT≤ 300 GeV) after ±1 s.d. parameter changes. However, the full shape dependence is included in the calculations.
Source of systematic Diboson signal W +jets Z+jets Top Multijet
Type
uncertainty [%] [%] [%] [%] [%]
Trigger efficiency, electron channela
+2/ − 3 +2/ − 3 +2/ − 3 +2/ − 3 I
Trigger efficiency, muon channel +0/ − 5 +0/ − 5 +0/ − 5 +0/ − 5 II
Lepton identificationa
±4 ±4 ±4 ±4 I
Jet identification ±1 ±1 ±1 ± <1 II
Jet energy scale ±4 ±7 ±5 ±5 II
Jet energy resolution ±3 ±4 ±4 ±4 I
Luminosity ±6.1 ±6.1 ±6.1 ±6.1 I
Cross section (including PDF uncertainties) ±20 ±6 ±10 I
Multijet normalization, electron channel ±20 I
Multijet normalization, muon channel ±30 I
Multijet shape, electron channel ±7 II
Multijet shape, muon channel ±10 II
Diboson signal NLO/LO shape ±10 II
Diboson signal reweighting shape ±5 II
Parton distribution function (acceptance only) ±1 ±3 ±2 ±2 II
alpgenη and ∆R corrections ±1 ±1 II
Renormalization and factorization scale ±1 ±1 II
alpgenparton-jet matching parameters ±1 ±1 II
a
Lepton efficiencies depend on kinematics; however, their frac-tional uncertainties are much less kinematically dependent and have a negligible effect on the shape of the dijet pT distribution.
= 2 Nb X i=1 mi( ~R) − di− diln mi( ~R) di ! + Ns X k=1 R2k , in which the indices i and k run over the number of histogram bins (Nb) and the number of systematic un-certainties (Ns), respectively. In this function LP(α; β) is the Poisson probability for α events with a mean of β events; LG(x; µ, σ) is the Gaussian probability for x events in a distribution with a mean value of µ and a variance σ2; R
k is a dimensionless parameter describing departures in nuisance parameters in units of the associ-ated systematic uncertainty σk; di is the number of data events in bin i; and mi( ~R) is the number of predicted events in bin i [29].
Systematics are treated as Gaussian-distributed un-certainties on the expected numbers of signal and back-ground events. The individual backback-ground contributions are fitted to the data by minimizing this χ2function over the individual systematic uncertainties [29]. The fit com-putes the optimal central values for the systematic uncer-tainties, while accounting for departures from the nom-inal predictions by including a term in the χ2 function that sums the squared deviation of each systematic in units normalized by its ±1 s.d. uncertainties.
Figure 5 shows the dijet pT distributions in the com-bined electron and muon channels after the fit. The value of χ2 is measured between data and MC dijet p
T dis-tributions as the signal MC is varied in the presence of anomalous couplings. The ∆χ2values of 1 and 3.84 from
the minimum χ2 in the parameter space, for which all other anomalous couplings are zero, represent the 68% confidence level (C.L.) and 95% C.L. limits, respectively. For the LEP parametrization, the most probable cou-pling values as measured in data with associated uncer-tainties at 68% C.L. are κγ = 1.07+0.26−0.29, λ = 0.00
+0.06 −0.06, and gZ
1 = 1.04+0.09−0.09. For the equal couplings scenario the most probable coupling values as measured in data with associated uncertainties at 68% C.L. are κ = 1.04+0.11−0.11 and λ = 0.00+0.06−0.06. The observed 95% C.L. limits esti-mated from the single parameter fit are -0.44 < ∆κγ < 0.55, -0.10 < λ < 0.11, and -0.12 < ∆gZ
1 < 0.20 for the LEP parametrization or -0.16 < ∆κ < 0.23 and -0.11 < λ < 0.11 for the equal couplings scenario (Table IV).
The observed 68% C.L. and 95% C.L. limits in two-parameter space are shown in Figs. 6 and 7 as a function of anomalous couplings along with the most probable val-ues of ∆κ, λ, and ∆gZ
1.
As shown in Table V, the 95% C.L. limits on anoma-lous couplings ∆κγ, ∆λ, and ∆g1Z set using the dijet pT distribution of W W/W Z → ℓνjj events are com-parable with the 95% C.L. limits set by the D0 Col-laboration from W W [3], W Z [4], and W γ [5] produc-tion in fully leptonic channels using ≈ 1 fb−1 of data. The most recent 95% C.L. one-parameter limits from the CDF Collaboration under the equal couplings sce-nario at ΛN P = 1.5 TeV are −0.46 < ∆κ < 0.39 and −0.18 < λ < 0.17 using 350 pb−1 of data, combining the ℓνjj and ℓνγ (l = e, µ) final states [6]. These
re-TABLE IV: The most probable values with total uncertainties (statistical and systematic) at 68% C.L. for κγ, λ, and g1Zalong with observed 95% C.L. one-parameter limits on ∆κγ, λ, and ∆gZ1 measured in 1.1 fb−1 of W W/W Z → ℓνjj events with ΛN P= 2 TeV. 68% C.L. κγ λ = λγ= λZ g1Z LEP parametrization κγ= 1.07+0.26 −0.29 λ = 0.00 +0.06 −0.06 g Z 1 = 1.04+0.09 −0.09 Equal couplings κγ= κZ= 1.04+0.11−0.11 λ = 0.00+0.06−0.06 95% C.L. ∆κγ λ = λγ= λZ ∆gZ1 LEP parametrization -0.44 < ∆κγ< 0.55 -0.10 < λ < 0.11 -0.12 < ∆g1Z< 0.20 Equal couplings -0.16 < ∆κ < 0.23 -0.11 < λ < 0.11
TABLE V: Comparison of 95% C.L. one-parameter TGC limits between the different channels studied at D0 with ≈ 1 fb−1of data: W W → ℓνℓν, W γ → ℓνγ, W Z → ℓℓℓν and W W + W Z → ℓνjj (l = µ, e) at ΛN P = 2 TeV.
LEP parametrization ∆κγ λ = λγ= λZ ∆gZ1 W Z → ℓνℓℓ (1 fb−1) - -0.17 < λ < 0.21 -0.14 < ∆gZ 1 < 0.34 W γ → ℓνγ (0.7 fb−1) -0.51 < ∆κ γ< 0.51 -0.12 < λ < 0.13 W W → ℓνℓν (1 fb−1) -0.54 < ∆κ γ< 0.83 -0.14 < λ < 0.18 -0.14 < ∆g1Z< 0.30 W W + W Z → ℓνjj (1.1 fb−1) -0.44 < ∆κ γ< 0.55 -0.10 < λ < 0.11 -0.12 < ∆g1Z< 0.20 equal couplings ∆κγ λ = λγ= λZ ∆gZ1 W Z → ℓνℓℓ (1 fb−1) -0.17 < λ < 0.21 W γ → ℓνγ (0.7 fb−1) -0.12 < λ < 0.13 W W → ℓνℓν (1 fb−1) -0.12 < ∆κ < 0.35 -0.14 < λ < 0.18 W W + W Z → ℓνjj (1.1 fb−1) -0.16 < ∆κ < 0.23 -0.11 < λ < 0.11
sults are limited by statistics, but a factor of nearly 10 times more data is expected to be available for analysis by D0 by the end of Run II of the Fermilab Tevatron. With additional data the potential to reach the individ-ual LEP2 anomalous TGC limits [7, 8, 9] shown in Ta-ble VI is significant. The combined LEP2 results still represent the world’s tightest limits on charged anoma-lous couplings [10] and give the most probable values of κγ, λ, and gZ1 as κγ = 0.973+0.044−0.045, λ = −0.028+0.020−0.021, and gZ
1 = 0.984+0.022−0.019at 68% C.L.
In summary, we have presented a measurement of γW W /ZW W couplings using a sample of semilep-tonic decays of W W/W Z boson pairs corresponding to 1.1 fb−1 of p¯p collisions collected with the D0 detector at the Fermilab Tevatron Collider. The measurement is in agreement with the SM. On the other hand, this analysis yields the most stringent limits on γW W /ZW W anoma-lous couplings from the Tevatron to date, complementing similar measurements performed in fully leptonic decay modes from W γ, W W , and W Z production.
TABLE VI: Measured values of κγ, λ and g1Z couplings and their associated uncertainties at 68% C.L. obtained from the one-parameter fits combining data from different topologies and energies at LEP2 experiments. The last column shows the D0 result obtained from the ℓνjj final states only selected from 1 fb−1 of data. The uncertainties include both statistical and systematic sources. 68% C.L. ALEPH OPAL L3 D0 (ℓνjj) κγ 0.971±0.063 0.88+0.09 −0.08 1.013±0.071 1.07 +0.26 −0.29 λ -0.012±0.029 -0.060+0.034 −0.033 -0.021±0.039 0.00 +0.06 −0.06 gZ 1 1.001±0.030 0.987+0.034 −0.033 0.966±0.036 1.04 +0.09 −0.09 κ ∆ -3 -2 -1 0 1 2 3 SM σ / σ 1 1.5 2 2.5 3 3.5 ) γ κ ∆ = f( σ ) Z κ ∆ = f( σ (a) ∆κ -3 -2 -1 0 1 2 3 SM σ / σ 0.9 1 1.1 1.2 1.3 1.4 1.5 1.6 1.7 1.8 1.9 ) γ κ ∆ = f( σ ) Z κ ∆ = f( σ (b)
FIG. 3: Semileptonic production cross sections for (a) W W and (b) W Z normalized to the SM prediction as a function of anomalous coupling ∆κ (λ = ∆gZ
1 = 0) in the LEP parametrization scenario. The new physics scale ΛN P is set to 2 TeV.
T Hadronic W p 0 50 100 150 200 250 W T / dp σ d 0 0.002 0.004 0.006 0.008 0.01 0.012 0.014 0.016 0.018 (a) Standard Model = +0.5 λ = +0.5 γ κ ∆ = +0.5 Z 1 g ∆ Hadronic W Rapidity -3 -2 -1 0 1 2 3 W / dy σ d 0 0.005 0.01 0.015 0.02 0.025 0.03 (b) Standard Model = +0.5 λ = +0.5 γ κ ∆ = +0.5 Z 1 g ∆
FIG. 4: Normalized distributions of the hadronic W boson (a) pT and (b) rapidity at the parton level in W W production including anomalous couplings under the LEP parametrization scenario: ∆κγ= +0.5 (λ = ∆g1Z= 0, ∆κZ= -0.15), λ = +0.5 (∆κγ= ∆κZ= ∆g1Z= 0), and ∆g1Z= +0.5 (∆κγ= λ = 0, ∆κZ= 1.5) compared to the SM distribution for W W production with unity normalization. The new physics scale ΛN P is set to 2 TeV.
T Dijet p (GeV) 0 50 100 150 200 250 300 Events / 10 GeV 1 10 2 10 3 10 4 10 T Dijet p (GeV) 0 50 100 150 200 250 300 Events / 10 GeV 1 10 2 10 3 10 4 10 Data Diboson Signal W+jets Z+jets Top Multijet (a) -1 DØ Run II, 1.1 fb T Dijet p (GeV) 0 50 100 150 200 250 300 syst.) ⊕ Events / (stat. -3 -2 -1 0 1 2 3 4 Data - (SM Sig+Bkgd) κ 95% CL for λ 95% CL for (b) -1 DØ Run II, 1.1 fb
FIG. 5: (a) The dijet pT distribution of combined (electron+muon) channels for data and SM predictions following the fit of MC to data. (b) The difference between data and simulation divided by the uncertainty (statistical and systematic) for the dijet pT distribution. Also shown are the MC signals for anomalous couplings corresponding to the 95% C.L. limits for ∆κ and λ in the LEP parametrization scenario. The full error bars on the data points reflect the total (statistical and systematic) uncertainty, with the ticks indicating the contribution due only to the statistical uncertainty.
γ
κ
∆
-0.6 -0.4 -0.2 0 0.2 0.4 0.6λ
-0.15 -0.1 -0.05 0 0.05 0.1 0.15 SM Minimum 68% Contour 95% Contour -1 DØ Run II, 1.1 fb (a) γκ
∆
-0.6 -0.4 -0.2 0 0.2 0.4 0.6 Z 1g
∆
-0.2 -0.1 0 0.1 0.2 SM Minimum 68% Contour 95% Contour -1 DØ Run II, 1.1 fb (b)λ
-0.1 -0.05 0 0.05 0.1 Z 1g
∆
-0.2 -0.1 0 0.1 0.2 SM Minimum 68% Contour 95% Contour -1 DØ Run II, 1.1 fb (c)FIG. 6: The 68% C.L. and 95% C.L. two-parameter limits on the γW W/ZW W coupling parameters ∆κγ, λ, and ∆g1Z, in the LEP parametrization scenario and ΛN P = 2 TeV. The dots indicate the most probable values of anomalous couplings from the two-parameter combined (electron+muon) fit and the star markers denote the SM prediction.
κ
∆
-0.3 -0.2 -0.1 0 0.1 0.2 0.3λ
-0.15 -0.1 -0.05 0 0.05 0.1 0.15 SM Minimum 68% Contour 95% Contour -1 DØ Run II, 1.1 fbFIG. 7: The 68% C.L. and 95% C.L. two-parameter limits on the γW W/ZW W coupling parameters ∆κ and λ, in the equal couplings scenario and ΛN P = 2 TeV. The dot indicates the most probable values of anomalous couplings from the two-parameter combined (electron+muon) fit and the star marker denotes the SM prediction.
We thank the staffs at Fermilab and collaborating institutions, and acknowledge support from the DOE and NSF (USA); CEA and CNRS/IN2P3 (France); FASI, Rosatom and RFBR (Russia); CNPq, FAPERJ, FAPESP and FUNDUNESP (Brazil); DAE and DST (In-dia); Colciencias (Colombia); CONACyT (Mexico); KRF and KOSEF (Korea); CONICET and UBACyT
(Ar-gentina); FOM (The Netherlands); STFC and the Royal Society (United Kingdom); MSMT and GACR (Czech Republic); CRC Program, CFI, NSERC and WestGrid Project (Canada); BMBF and DFG (Germany); SFI (Ire-land); The Swedish Research Council (Sweden); CAS and CNSF (China); and the Alexander von Humboldt Foun-dation (Germany).
[a] Visitor from Augustana College, Sioux Falls, SD, USA. [b] Visitor from Rutgers University, Piscataway, NJ, USA. [c] Visitor from The University of Liverpool, Liverpool, UK. [d] Visitor from Centro de Investigacion en Computacion
-IPN, Mexico City, Mexico.
[e] Visitor from ECFM, Universidad Autonoma de Sinaloa, Culiac´an, Mexico.
[f] Visitor from Universit¨at Bern, Bern, Switzerland. [g] Visitor from Universit¨at Z¨urich, Z¨urich, Switzerland. [1] K. Hagiwara, J. Woodside, and D. Zeppenfeld, Phys.
Rev. D 41, 2113 (1990).
[2] S. Weinberg, Phys. Rev. D 13, 974 (1976); L. Susskind, Phys. Rev. D 20, 2619 (1979); H. P. Nilles, Phys. Rep. 110, 1 (1984); H. E. Haber and G. L. Kane, Phys. Rep. 117, 75 (1985); A. G. Cohen, D. B. Kaplan and A. E. Nel-son, Phys. Lett. B 388, 588 (1996); C. Csaki, C. Gro-jean, L. Pilo and J. Terning, Phys. Rev. Lett. 92, 101802 (2004); R. Foadi, S. Gopalakrishna and C. Schmidt, JHEP 0403, 042 (2004).
[3] D0 Collaboration, V. M. Abazov et al., arXiv:hep-ex/0904.0673 (2009), submitted to Phys. Rev. Lett. . [4] D0 Collaboration, V. M. Abazov et al., Phys. Rev. D
76, 111104(R) (2007).
[5] D0 Collaboration, V. M. Abazov et al., Phys. Rev. Lett. 100, 241805 (2008).
[6] CDF Collaboration, T. Aaltonen et al., Phys. Rev. D 76, 111103(R) (2007).
[7] ALEPH Collaboration, S. Schael et al., Phys. Lett. B 614, 7 (2005).
[8] OPAL Collaboration, G. Abbiendi et al., Eur. Phys. J. C 33, 463 (2004).
[9] L3 Collaboration, P. Achard et al., Phys. Lett. B 586, 151 (2004).
[10] LEP Collaborations ALEPH, DELPHI, L3, OPAL, and LEP TGC Working Group, Report No. LEPEWWG/TGC/2005-01 (2005).
[11] CDF Collaboration, D. Acosta et al., Phys. Rev. Lett. 94, 211801 (2005); A. Abulencia et al., Phys. Rev. Lett. 98, 161801 (2007); T. Aaltonen et al., Phys. Rev. Lett. 100, 201801 (2008).
[12] D0 Collaboration, V. M. Abazov et al., Phys. Rev. Lett. 102, 161801 (2009).
[13] B. W. Lee, C. Quigg, and H. B. Thacker, Phys. Rev. D 16, 1519 (1977); W. Marciano, G. Valencia, and S. Wil-lenbrock, Phys. Rev. D 40, 1725 (1989); S. Dawson and S. Willenbrock, Phys. Rev. Lett. 62, 1232 (1989). [14] S. Alam, S. Dawson and R. Szalapski, Phys. Rev. D 57,
1577 (1998).
[15] K. Hagiwara et al., Nucl. Phys. B282, 253 (1987). [16] U. Baur and D. Zeppenfeld, Phys. Lett. B 201, 383
(1988).
[17] T. Appelquist and C. Bernard, Phys. Rev. D 22, 200 (1980); C. N. Leung, S. T. Love and S. Rao, Z. Phys. C 31433 (1986).
[18] C. Grosse-Knetter, I. Kuss, D. Schildknecht, Phys. Lett. B 358, 87 (1995).
[19] M. Bilenky, J. L. Kneur, F. M. Renard and D. Schild-knecht, Nucl. Phys. B409, 22 (1993); Nucl. Phys. B419, 240 (1994); G. Gounaris et al., arXiv:hep-ph/9601233 (1996); C. Grosse-Knetter, I. Kuss and D. Schildknecht, Z. Phys. C 60, 375 (1993).
[20] K. Hagiwara, S. Ishihara, R. Szalapski and D. Zeppen-feld, Phys. Rev. D 48, 2182 (1993).
[21] D0 Collaboration, V. M. Abazov et al., Nucl. Instrum. Methods Phys. Res. A 565, 463 (2006).
[22] D0 uses a cylindrical coordinate system with the z axis running along the beam axis. Angles θ and φ are the polar and azimuthal angles, respectively. Pseudorapid-ity is defined as η = − ln [tan(θ/2)], in which θ is measured with respect to the proton beam direction. In the massless limit, η is equivalent to the rapidity y = (1/2) ln [(E + pz)/(E − pz)]. ηdetis the pseudorapid-ity measured with respect to the center of the detector. [23] D0 Collaboration, S. Abachi et al., Nucl. Instrum.
Meth-ods Phys. Res. A 338, 185 (1994).
[24] V. M. Abazov et al., Nucl. Instrum. Methods Phys. Res. A 552, 372 (2005).
[25] G. C. Blazey et al., arXiv:hep-ex/0005012 (2000). [26] J. Smith, W. L. van Neerven, and J. A. M. Vermaseren,
Phys. Rev. Lett. 50, 1738 (1983).
[27] L. Breiman, Machine Learning 45, 5 (2001).
[28] I. Narsky, arXiv:physics/0507143 [physics.data-an] (2005).
[29] W. Fisher, FERMILAB-TM-2386-E.
[30] J. M. Campbell and R. K. Ellis, Phys. Rev. D 60, 113006 (1999). Cross sections were calculated with the same parameter values given in the paper, except with √s = 1.96 TeV.
[31] J. Pumplin et al., JHEP 0207, 012 (2002).
[32] T. Sj¨ostrand et al., Comput. Phys. Commun. 135, 238 (2001).
[33] S. Frixione and B. R. Webber, JHEP 0206, 029 (2002). [34] F. James, “Minuit Function
Minimiza-tion and Error Analysis, Reference Manual,” http://wwwasdoc.web.cern.ch/wwwasdoc/minuit/ minmain.html