HAL Id: hal-03037769
https://hal.archives-ouvertes.fr/hal-03037769
Submitted on 13 Jan 2021HAL is a multi-disciplinary open access archive for the deposit and dissemination of sci-entific research documents, whether they are pub-lished or not. The documents may come from teaching and research institutions in France or abroad, or from public or private research centers.
L’archive ouverte pluridisciplinaire HAL, est destinée au dépôt et à la diffusion de documents scientifiques de niveau recherche, publiés ou non, émanant des établissements d’enseignement et de recherche français ou étrangers, des laboratoires publics ou privés.
Nitrous acid formation on Zea mays leaves by
heterogeneous reaction of nitrogen dioxide in the
laboratory
Aurélie Marion, Julien Morin, Adrien Gandolfo, Elena Ormeño, B. d’Anna,
Henri Wortham
To cite this version:
Aurélie Marion, Julien Morin, Adrien Gandolfo, Elena Ormeño, B. d’Anna, et al.. Nitrous acid forma-tion on Zea mays leaves by heterogeneous reacforma-tion of nitrogen dioxide in the laboratory. Environmental Research, Elsevier, 2021, 193, pp.110543. �10.1016/j.envres.2020.110543�. �hal-03037769�
1
Nitrous acid formation on Zea mays leaves by heterogeneous
reaction of nitrogen dioxide in the laboratory
Aurélie Marion1,*, Julien Morin1, Adrien Gandolfo1, Elena Ormeño2, Barbara D’Anna1, Henri Wortham1
1Aix Marseille Univ, CNRS, LCE, UMR 7376, 13331, Marseille, France
2IMBE, CNRS, Aix Marseille Univ, Univ Avignon, IRD, Marseille, France
*Corresponding author: aurelie.marion@etu.univ-amu.fr, 3 place Hugo - case 29, 13003 Marseille,
2
Abstract
Nitrous acid (HONO) is of considerable interest because it is an important precursor of hydroxyl radicals (OH), a key species in atmospheric chemistry. HONO sources are still not well understood, and air quality models fail to predict OH as well as HONO mixing ratios. As there is little knowledge about the potential contribution of plant surfaces to HONO emission, this laboratory work investigated HONO formation by heterogeneous reaction of NO2 on Zea mays.
Experiments were carried out in a flow tube reactor; HONO, NO2 and NO were measured online
with a Long Path Absorption Photometer (LOPAP) and a NOx analyzer. Tests were performed on leaves under different conditions of relative humidity (5 to 58 %), NO2 mixing ratio
representing suburban to urban areas (10 to 80 ppbv), spectral irradiance (0 to 20 W m-2) and
temperature (288 to 313 K). Additional tests on plant wax extracts from Zea mays leaves showed that this component can contribute to the observed HONO formation. Temperature and NO2 mixing ratios were the two environmental parameters that showed substantially increased
HONO emissions from Zea mays leaves. The highest HONO emission rates on Zea mays leaves were observed at 313 K for 40 ppbv of NO2 and 40% RH and reached values of
(5.6 ± 0.8) × 109 molecules cm-2 s-1. Assuming a mixing layer of 300 m, the HONO flux from Zea mays leaves was estimated to be 171 ± 23 pptv h-1 during summertime, which is comparable to what has been reported for soil surfaces.
Keywords: HONO sources, hydroxyl radicals, atmospheric chemistry, solid/gas reactivity, leaf
3
Funding
This work was supported by ADEME who funding the project HONO-CORN, included in PRIMEQUAL program.
4
1. Introduction
Since its first atmospheric measurement in 1979 by Perner and Platt (1979), nitrous acid (HONO) has become of considerable interest in atmospheric chemistry, as its photolysis (R1) is an important source of hydroxyl radicals (OH), a key species in atmospheric reactivity and photooxidative pollution episodes (Acker et al., 2006; Alicke and Platt, 2002; Kleffmann et al., 2005).
HONO + hν → NO + OH (R1)
To model and predict OH formation, it is essential to identify and estimate HONO emission sources in the atmosphere, as it can contribute up to 55% of the atmospheric OH radicals during the morning hours (Elshorbany et al., 2009). Highly contrasting HONO mixing ratios were observed between rural environments with values of a few pptv (Honrath et al., 2002; Li et al., 2012; Liao et al., 2006; Zhou et al., 2001) and polluted urban areas with values of several ppbv at night (Huang et al., 2017; Li et al., 2010; Michoud et al., 2014). The major HONO sources currently considered in atmospheric models include heterogeneous processes (the main pathway for HONO formation), homogeneous gas-phase reactions, and direct emissions (e.g., on-road transport, biomass burning) (Aumont et al., 2002; Michoud et al., 2014; Vogel et al., 2003).
Modeling studies have shown discrepancies between predicted HONO mixing ratios and ambient measurements, indicating missing sources, estimated to account for 2.6 ppbv h-1 of HONO (Spataro et al., 2013). This unknown source correlates with NO2 mixing ratios and
reaches a maximum value at, approximately, midday (Acker et al., 2006; Kleffmann et al., 2005; Li et al., 2012; Michoud et al., 2014; Spataro et al., 2013; Villena et al., 2011; Zhou et al., 2002). As a result, additional sources were proposed, such as heterogeneous conversion of HNO3 (Yang et al., 2018) and orthonitrophenol photolysis (Bejan et al., 2006), but both
5 processes were discredited. Indeed, for realistic values of HNO3 concentrations and relative
humidity, the proposed reaction was too low and could not explain the observed HONO (Kleffmann et al., 2004). Moreover, considering the low ambient concentrations of nitrophenols, this source is unlikely to produce the amount of HONO detected (Li et al., 2010). Zhou et al. (2003) suggested nitric acid (HNO3) photolysis as a possible HONO source, and a
modeling study in the United States confirmed that this reaction pathway is important and could represent up to 32% of HONO diurnal levels (Sarwar et al., 2008). When adding the gas phase reaction between excited NO2 and water (Li et al., 2008) into the model, only slight
improvements were achieved because 25% of the observed HONO was missing. Li et al. (2010) added in their model the NO2 reaction on semivolatile organics adsorbed on atmospheric
particles, and this implementation enabled them to correctly evaluate HONO production in Mexico city. More recently, abiotic release from soil (Donaldson et al., 2014), as well as biological processes such as nitrification or denitrification, were proposed to be this unknown HONO source (Oswald et al., 2013; Scharko et al., 2015; Wu et al., 2019). HONO fluxes were measured above a maize field by Laufs et al. (2017), who then proposed the heterogeneous reaction of NO2 on soil as a major HONO source. Nevertheless, field measurements in Finland
reported higher HONO mixing ratios above the canopy than close to the ground (Oswald et al., 2015), suggesting that vegetative surfaces could play a role in HONO formation through the heterogeneous reduction of NO2.
It is generally assumed that HONO formation on various surfaces is driven by NO2 hydrolysis
(R2), according to the following equation (Jenkin et al., 1988; Kleffmann et al., 1998; Ramazan et al., 2004; Svensson et al., 1987):
6 Several studies demonstrated that HONO could also be formed by photoinduced processes through the generation of intermediate species that act as efficient electron donors (Cazoir et al., 2014; George et al., 2005; Stemmler et al., 2007).
In France, agricultural surfaces represent approximately 33 million hectares, while wooded areas account for 19 million ha (Moreau, 2015). Depending on the season, the foliage in rural or cultivated suburban areas can be very dense, implying a considerably higher available surface than that provided by the soil. If foliage surfaces were involved in the heterogeneous conversion of NO2 to HONO, it would be important to quantify this emission and to evaluate its impact on
the OH budget in agricultural or rural areas.
The main aim of this study was to quantify HONO formation on Zea mays leaves by investigating the influence of environmental factors such as relative humidity, NO2 mixing
ratio, reaction temperature, and photon flux on the emission rate. Zea mays leaves were chosen as a model for cultivated vegetation because they are one of the most common cultures in the world and represent a cultivated surface of more than 6 million ha in Europe (Eurostat, 2019; Wrigley et al., 2004). Then, HONO fluxes from leaves were estimated to evaluate the potential contribution of vegetation to the missing HONO sources. To our knowledge, this is the first work reporting a systematic investigation of HONO formation on plant leaves under simulated environmental conditions.
2. Materials and methods
2.1. Chemical reagents
Synthetic air (≥ 99.999%, Linde gas) and NO2 (100 ppmv in helium, Linde gas) were used in
Teflon tubes (perfluoroalkoxy). The air flow was humidified with Milli-Q water (18 MΩ cm).
Long path absorption photometer (LOPAP) solutions were prepared with sulfanilamide (≥ 99%, Sigma Aldrich), N-(1-naphthyl) ethylene di-amine dihydrochloride (≥ 98%, Sigma
7 Aldrich), sodium hydroxide pellets (≥ 98%, Sigma Aldrich) and hydrochloric acid (37%, Fisher). A nitrite standard solution (NaNO2 in H2O, 1000 mg L-1, Merck) was used for LOPAP
calibration.
Surface proxies were prepared using chlorophyll a (United States Pharmacopeia (USP) Reference Standard, Sigma Aldrich), diethyl ether (≥ 99.5%, Sigma Aldrich), acetone (HPLC grade, Carlo Erba), and n-hexane (99%, Carlo Erba).
2.2. Experimental setup
Experiments were carried out in a cylindrical flow tube reactor (V = 130 cm3) made of borosilicate glass. Gas flows, hereafter referred to as Fi, were controlled using mass flow
controllers (Brooks SLA Series, accuracy ± 1%). The experimental setup is depicted in Figure 1 and Figure S2. A 3D sketch of the system was previously presented (Gandolfo et al., 2017), and a photo of the flow tube reactor is shown in Figure S1. Synthetic air was continuously injected in the reactor as a sheath flow (F4; 990 mL min-1), while NO2 gas was introduced via a
movable injector (F2; 10 mL min-1). The total flow (F2 + F4 = 1 L min-1) was chosen to ensure
laminar flow in the reactor. Before introduction into the movable injector, NO2 gas (F1) was
diluted in synthetic air (F3) with variable flows to adjust the desired NO2 concentration. The
total flow in the reactor was kept constant, and the contact time between the reactant gas and the leaf surface was controlled by varying the injector position.
Upstream of the reactor, the sheath flow (F4) was split into two fluxes controlled by two needle
valves. The first one consisted of dry air gas, while the second one was humidified by bubbling in deionized water. Mixing these two flows at different ratios generated a sheath flow at controlled RH. Downstream of the reactor, a hygrometer “Hygrolog NT2” (Rotronic) with a “HygroClip SC04” probe was used to measure the resulting relative humidity (accuracy = 1.5% RH). For these experiments, the RH ranged between 5 and 58%. The flow tube reactor was
8 thermostated using a circulating water bath (Lauda RC6 refrigerated bath with RCS thermostat, temperature accuracy ± 0.1 K at 263 K) connected to the double wall of the reactor.
The reactor was placed in a stainless-steel box containing six UV fluorescent lamps (Philips TL-D18W, 340-400 nm, λmax = 368 nm) that could be switched on/off individually. The
integrated irradiance of the six lamps in the wavelength region 340-400 nm was 20 W m-2 ,
which is of the same order of magnitude as the solar irradiance during a spring sunny day in southern France.
At the reactor outlet, two analyzers (LOPAP and NOx monitor) were connected for online detection of HONO and NOx (NOx = NO + NO2). The LOPAP analyzer (QUMA) has been
previously described in detail elsewhere (Heland et al., 2001, 2001). Briefly, gaseous HONO is dissolved in a hydrochloric acid solution and then converted into an azo dye, detected by long path absorption using a mini spectrometer equipped with a diode array detector. The detection limit (twice the noise) was approximately 2 pptv, and the total accuracy was ± 10%. The instrument was calibrated with a nitrite standard solution following the manufacturer’s protocol. The NOx analyzer was an Eco Physics model (CLD 88p) associated with an Eco Physics photolytic (metal-halide lamp; 180 W) converter (PLC 860) used to alternatively monitor NO and NOx mixing ratios. NO was first analyzed by chemiluminescence (reaction of NO with ozone). Then, NOx was measured after NO2 photoconversion to NO and reaction with
ozone. Finally, NO2 was calculated from the difference between the NOx and NO mixing ratios.
The detection limit was 50 pptv, and the relative uncertainty was approximately 1%. Downstream of the reactor, an air flow (F5) of 1 L min-1 was added to achieve the flow rate
needed for the two analyzers.
9 The experiments were carried out on fully expanded leaves of Zea mays plants (hybrid MB866) provided by INREA (Institut National de recherche pour l’agriculture, l’alimentation et l’environment) and grown in the greenhouse facilities of Aix-Marseille University. Leaves were harvested at mid-height 10 to 20 weeks after planting at stage V6. A cut leaf was introduced in the reactor and adapted to cover a glass flat surface (2 cm width and 30 cm length) within the reactor. To assure physical integrity of the reactive surface, a mature cut leaf was used every day. Since HONO production from glass surfaces has been previously reported (Finlayson-Pitts et al., 2003; Jenkin et al., 1988; Ramazan et al., 2004), blank experiments were carried out in the reactor replacing the leaf with a glass plate. As a result, hereafter, all the graphs present blank and Zea mays leaf experiments.
Leaf exposure to UV light promoted large emissions of water molecules for several hours. Consequently, a new protocol was implemented where the leaves were cut 24 hours before the experiment and irradiated for approximately 8 h. Water release from plant leaves is a well-known phenomenon that results from passive transpiration induced by hydropassive stomatal opening (Franks et al., 1998, 1995; Raschke, 1970). After this treatment, the plant leaves were used for kinetic investigations.
Additionally, experiments were carried out using commercial chlorophyll a and wax extracts from Zea mays leaves as reactive surfaces to better understand the origin of HONO emission on the studied leaves. The chlorophyll a film was prepared by dissolving chlorophyll a in acetone. Then, 4 mL of this solution was immediately deposited on a glass plate (less than 2 min after solution preparation) and placed in the dark under a fume cupboard until complete solvent evaporation. The experiments were carried out at three chlorophyll a concentrations (0.6, 1.6, and 2.3 µg cm-2). Concerning the plant wax experiments, 6 g of fresh Zea mays leaves were mixed with 20 mL of a mixture of hexane/diethyl ether 90/10 (v/v) for 20 seconds as proposed by Loneman et al. (2017). Then, 6 mL of the resulting solution was deposited on two different
10 glass plates, and solvents were evaporated as previously described for chlorophyll a experiments. In both cases, blank experiments were carried out with pure acetone or hexane/diethyl ether on glass plates.
To ensure the statistical significance of our results, three replicates were conducted on leaf and wax plate experiments, while four replicates were carried out on chlorophyll a experiments. The published values represent the calculated means and standard deviations. Fitting curves presented in this work and their corresponding errors were determined using a least squared fitting procedure (Igor Pro software). The associated errors correspond to one standard deviation (1) (Table S1).
2.4. Experimental methodology and data analysis
First, the movable injector was pushed to the end of the reactor (position P0) to avoid any contact
between the gaseous NO2 and the leaf surface. The NO2 mixing ratio in the injector was adjusted
to the chosen value, and light was switched on. NO2 loss as well as HONO and NO formation
were measured moving the injector and successively exposing 14, 29 and 44 cm2 of leaf surface corresponding to injector positions P1, P2 and P3, respectively. After each measurement, the
injector was pushed back to position P0 to control the initial signal level. Each position was held
for 30 minutes for signal stabilization and to have enough measurement points. The injector positions enable us to vary the contact time between the gaseous NO2 and the leaf surface and
allow the calculation of the reaction kinetics. HONO and NO emission rates as well as NO2
losses are defined as the average formation/consumption rates per unit of area calculated for each injector position. The influence of air relative humidity (5 to 58%), NO2 mixing ratio (10
to 80 ppbv), light intensity (0 to 20 W m-2) and temperature leaf surface (288 to 313 K) was investigated.
11 HONOER = [HONO] × V
Rt × S
where [HONO] is the concentration of HONO (molecules cm-3) measured at a defined residence time (Rt in s), V is the volume of the reactor (cm3) and S is the reactive surface (cm2).
The uptake coefficient of the leaf surface was determined by integrating the “drop” in the NO2
signal as a function of the contact time - according to the following equation:
𝛾 = 4𝑘𝑁𝑂2𝑉 𝜈𝑁𝑂2𝑆
where the injector distance (cm), the mass flow rate (cm3 min-1) and the reactor inner diameter (cm) are known, 𝑘𝑁𝑂2 is the pseudofirst-order rate for the reaction of NO2 with the surface,
𝜈𝑁𝑂2is the diffusion coefficient determined as √8𝑅𝑇
𝜋𝑀, with R being the universal gas constant
(J mol-1 K-1), T being the temperature (K), M being the molar mass (g mol-1), V being the reactor volume (cm3) and S being the reactive surface (cm2).
The pseudofirst-order reaction rate of NO2 is defined as ln( [𝑁𝑂2]𝑡
[𝑁𝑂2]0) = −𝑘𝑁𝑂2t, with [𝑁𝑂2]𝑡 being
the measured NO2 mixing ratio versus exposure time, [𝑁𝑂2]0 being the initial NO2 mixing ratio
at P0 and t being the contact time between NO2 and the leaf surface. Under irradiation
conditions, the consumption rate of NO2 is lower than the sum of the emission rates of HONO,
NO, and NO3-/HNO3 (assumed to be equal to the HONO emission rate according to equation
R2). This phenomenon is due to the photolysisof NO2 in the injector (up to a 10% NO2 mixing
ratio). It would be interesting to calculate this photolysis frequency, but unfortunately, the actinic flux in the movable injector cannot be measured because of its low inner diameter (approximately 2 mm). Under the experimental conditions used in this study, HONO and HNO3
12 Finally, HONO production on vegetation under field conditions was estimated by knowing HONO production on glass plates, on Zea mays leaves and the LAI of Zea mays plants (up to 6 m2 m-2). As suggested in the literature, ground-level HONO can be assimilated to a production
rate in the mixing layer by considering a homogeneous HONO mixing ratio throughout the air column (Meusel et al., 2018; Stemmler et al., 2006; Xue et al., 2019). As explained by Meusel et al. (2018), this calculation mode does not take into account the HONO vertical gradient but enables estimation of the order of magnitude of the gap between the calculated emission rate and the HONO missing source (Stemmler et al., 2006; Xue et al., 2019). As a result, the HONO maximal emission rate from Zea mays leaves was estimated per unit of ground surface at several temperatures, and approximations of the HONO production rate in the mixing layer were calculated with and without blank subtraction. Meusel et al. (2018) and Xue et al. (2019) evaluated the contribution of HONO emissions from soil using an averaged mixing layer height of 300 m. To enable a direct comparison with these previous studies, the same mixing layer height was chosen in this work.
3. Results
3.1. NO2 uptake and HONO surface emission rates
Figure 2 depicts the HONO surface emission rates for a set of experimental conditions (temperature, irradiation flux, NO2 mixing ratio and relative humidity), while Table 2 lists a
summary of HONO emission rates reported in the literature. The impact of light intensity (from 0 to 20 W m-2) on the HONO emission rate was investigated (Figure 2A). Depending on the
experimental conditions, the values ranged from (5.4 ± 2.0) × 108 to (1.4 ± 0.2) × 109 molecules cm-2 s-1 on the reactor surfaces (blank experiments) and from (2.2 ± 0.5) × 109 to (3.3 ± 2.0) × 109 molecules cm-2 s-1 on Zea mays leaves. Based on experimental uncertainties, it can be concluded that there was no clear influence of UV-A light on the HONO emission rate from Zea mays leaves. The NO2 uptake on leaves was calculated in the dark under steady-state
13 conditions at 303 K, 40 ppb of NO2 and 40% RH after approximately 20 minutes of exposure,
and the average was (6.5 ± 0.2) × 10-7. Under these experimental conditions, uptake on the glass plate was negligible.
The effect of variable humidity from 5 to 58% was also tested (Figure 2B). HONO emission rates ranged from (5.1 ± 1.4) × 108 to (1.5 ± 0.5) × 109 molecules cm-2 s-1 in the Pyrex reactor
(blank experiment) and from (2.0 ± 0.5) × 109 to (2.9 ± 0.4) × 109 molecules cm-2 s-1 on Zea mays leaves. The HONO emission rate linearly increased with RH on both substrates.
A linear correlation between HONO emission rates and NO2 mixing ratios was highlighted
from 10 to 80 ppbv (Figure 2C). The observed HONO formation ranged from (9.0 ± 2.5) × 108 to (2.2 ± 0.6) × 109 molecules cm-2 s-1 on reactor Pyrex surfaces and from (6.7 ± 0.5) × 108 to
(4.2 ± 1.2) × 109 molecules cm-2 s-1 on Zea mays leaves.
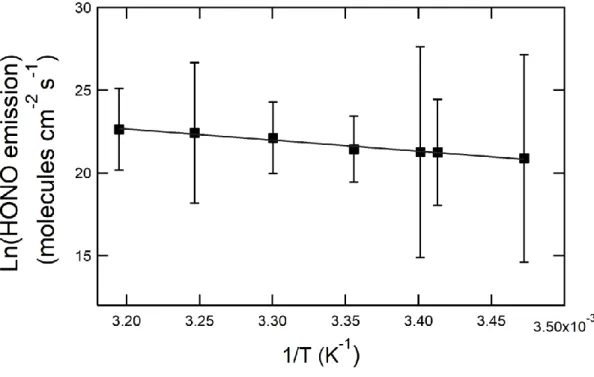
The temperature dependence of HONO formation on Zea mays leaves was tested by varying the experimental temperature from 288 and 313 K (Figure 2D). The emission rates varied by a factor of six, ranging from (1.2 ± 0.4) × 109 to (6.8 ± 0.8) × 109 molecules cm-2 s-1. No temperature dependence was observed on the reactor surface, which showed an average formation rate of (1.3 ± 0.9) × 109 molecules cm-2 s-1. From the experimental data on Zea mays leaves, an overall activation energy of 56 ± 10 kJ mol-1 could be derived.
Table 3 presents an estimation of HONO emissions under environmental conditions for Zea Mays, which possesses an LAI of 6 m2 m-2. Zea mays leaf emissions correspond to emission rates from (5.8 ± 1.2) × 1017 molecules m-2 h-1 at 303 K to (1.2 ± 0.2) × 1018 at 313 K.
3.2. HONO formation on chlorophyll a and wax surfaces
HONO emission rates on chlorophyll a and wax surfaces are presented in Figure 4. Chlorophyll a experiments showed a high decrease in the HONO signal over time, suggesting a very fast depletion of the reactive sites. As a result, only the first position of the injector was used to
14 calculate HONO emission rates for chlorophyll thin films. However, the chlorophyll a concentrations deposited on the glass plate were lower than those measured inside the Zea mays leaves, which normally range from 24 to 30 µg cm-2 (Zhao et al., 2003). Despite these low
concentrations, the HONO formation rate on chlorophyll a films was over a factor ten higher than the values observed on the leaf surface.
To evaluate the repeatability of the measurements on wax films, two different plates (wax plates 1 and 2, Figure 4) covered by aliquots of the same wax extract were tested. The results showed similar HONO emissions on both plates: (4.1 ± 0.5) × 109 molecules cm-2 s-1 and (4.8 ± 0.9) × 109 molecules cm-2 s-1. The HONO emission from the wax plates was clearly closer to the values calculated on leaves than those measured on chlorophyll a. To test the wax reactivity over time, two experiments were realized on the same wax plate film, one after the other. The results in Figure 4 show average emission rates of (4.6 ± 0.8) × 109 molecules cm
-2 s-1 from wax plates 1 and 2 and (2.3 ± 0.3) × 109 molecules cm-2 s-1 from wax plate 1bis,
suggesting a fast depletion of the reactive sites on this type of thin film.
4. Discussion
This study highlighted the efficient conversion of NO2 to HONO on Zea mays leaves and
elucidated the dependence of this heterogeneous reaction on several environmental parameters.
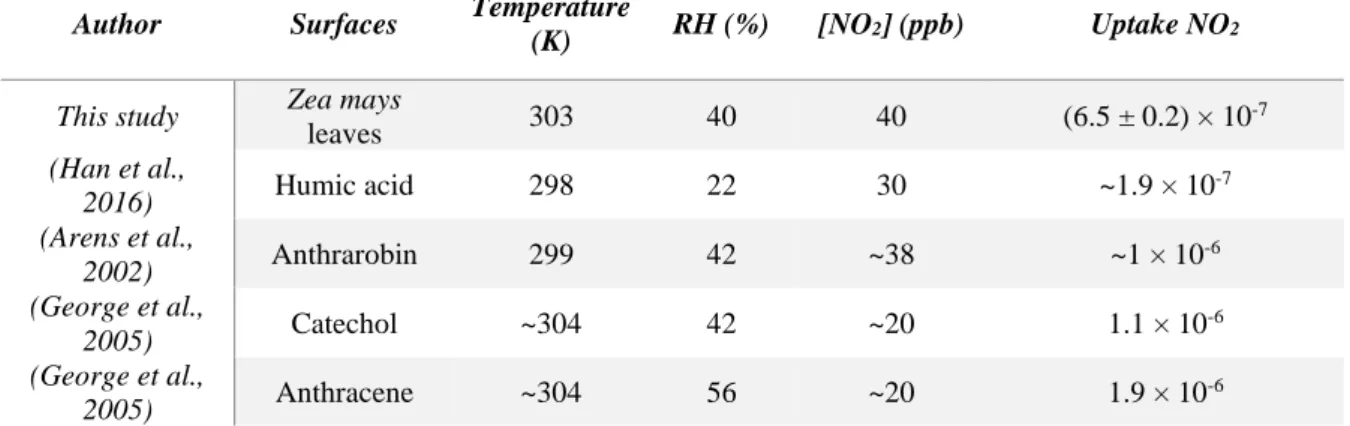
A steady-state uptake of (6.5 ± 0.2) × 10-7 was measured in this work. As this is the first time that NO2 uptake has been reported on a leaf surface, uptake on other organic surfaces is
presented for comparison in Table 1. Humic acid films are an important chemical system because they are part of the soil composition and could be a good representation of soil reactivity (Stemmler et al., 2006). The uptakes observed on humic acids and at the leaf surface are similar (on the order of 10-7), suggesting that the heterogeneous reactivity of NO2 on both
15 showed larger uptakes up to 10-6, suggesting faster electron transfer from substrates containing monoaromatic compounds and PAHs (Arens et al., 2002; George et al., 2005).
The observed linear dependence of HONO formation on the NO2 mixing ratio suggests that the
leaf surface sites were not saturated under the experimental conditions. A similar increase was previously reported on several organic surfaces, but most of the time, HONO formation ended in a plateau for high NO2 mixing ratios, probably due to saturation of the adsorption sites (Arens
et al., 2002; Han et al., 2016; Stemmler et al., 2007). The differences regarding the concentration at which the saturation effect appears can be explained by the number of sites at the surface and the accessibility of NO2 to the inner layer of the substrate. Thin films or
suspended particles of humic acids presented saturation effects for NO2 concentrations above
50-60 ppbv (Stemmler et al., 2007), while other surfaces with multiple layers or porous surfaces showed saturation at higher NO2 mixing ratios (Arens et al., 2002; Han et al., 2016). Han et al.
(2016) stated that the whole thickness of their humic acid film was both accessible and reactive towards NO2, leading to saturation for NO2 concentrations higher than 160 ppbv. Similarly,
anthrarobin films presented high surface roughness and were composed of 1 × 10³ monolayers,
explaining why no saturation effects were observed until 120 ppbv (Arens et al., 2002). The Zea mays leaf surfaces present a certain roughness, as shown by electron microscopy images (Januszkiewicz et al., 2019), which implies a higher number of adsorption sites than a thin film and probably explains why saturation was not observed for the NO2 mixing ratio of 80 ppbv,
the highest value tested.
The influence of humidity on HONO emissions on the blank and Zea mays leaves resulted in two parallel linear fits (Figure 4B). This behavior suggests that the observed increment is due to the contribution from the reactor walls rather than from the leaf surface. Finlayson-Pitts et al. (2003) previously observed a similar behavior on borosilicate glass. The experiments were carried out by varying the humidity from 10 to 60%, which corresponded to an increase from
16 one to five water layers adsorbed on the glass surface. They interpreted the results of HONO formation on the glass plate as correlated to the number of water molecules adsorbed on the surface rather than the water vapor molecules in the gas phase colliding with the substrate surface (Finlayson-Pitts et al., 2003). The number of water layers on plant leaves has been previously determined using electric conductivity measurements, and it was estimated that a water monolayer can be formed for RH above 50% (Lammel, 1999). The lack of dependence of HONO emissions on ambient humidity observed in this work could be an indication that even at the highest humidity (58%) used in our experiments, a water monolayer was not formed. Furthermore, Arens et al. (2001) showed that HONO formation on soot particles needed water molecules but was independent of humidity in the range of 4 to 77%. Some experiments using D2O molecules showed the formation of DONO, assessing the important role of water
molecules in the heterogeneous mechanism (Kleffmann et al., 1999; Longfellow et al., 1999). When using H218O in the gas phase, only HONO was formed, suggesting that the oxygen of the
water molecules did not participate in the reaction (Longfellow et al., 1999). The authors also demonstrated that an efficient conversion of NO2 to HONO on soot surfaces could take place
at a low humidity of 4% (Arens et al., 2001; Kleffmann et al., 1999). It was then concluded that the overall reaction rate of HONO formation must be limited by another chemical process (Arens et al., 2001; Kleffmann et al., 1999).
Temperature variation produced the most remarkable increase in HONO emissions (a factor of 28 between 293 and 313 K). Two possible effects were invoked to explain this observation. The first is that temperature affects partitioning between the gas and solid phases, favoring desorption of molecules from the surface (Liu et al., 2008; Tlili et al., 2010). Mainly, the leaf temperature increase enhanced HONO desorption kinetics, leaving access to reactive sites for the adsorption of a new H2O and/or NO2 molecule. A second hypothesis is that the conversion
17 (Arens et al., 2002). Unfortunately, the relative contribution of each of these two individual processes can neither be demonstrated nor computed separately. From the temperature dependence measurements, an overall activation energy of 56 ± 10 kJ mol-1 was calculated.
This overall activation energy represents the sum of the activation energy and the reaction enthalpies of all the heterogeneous reaction steps. Values of the same order of magnitude of 47.1 kJ mol-1 were reported for soot particles (Shrivastava et al., 2010), while anthrarobin films showed a slightly lower activation energy of 39 kJ mol-1. The reaction of NO2 therefore requires
more energy on leaves and soot than on anthrarobins. This may be tentatively explained by the fact that their surfaces are a complex medium and contain less efficient electron donors than anthrarobin films, which are composed of pure aromatic compounds.
Apparently, NO2 to HONO conversion on Zea mays leaves did not show dependence on the
photon flux, and the emission rates observed were comparable in the darkness and under irradiation up to a light intensity of 20 W m-2. The NO2 to HONO conversion requires an
electron donor available on the reactive surface. Under the leaf surface, many pigments are available, including chlorophyll a, which is well known as an efficient electron donor. However, chlorophyll a is not directly available to oxidants, as it is protected by a cuticular wax layer and epidermal cells (which do not possess chlorophyll). Waxes are recognized as a major component of the leaf surface (Barthlott et al., 1998; Croft and Chen, 2018), forming a protective interface towards the atmosphere and preventing water loss from the leaf (Barthlott et al., 2017). Maize wax investigations revealed that plant wax contains hydrocarbons, fatty acids, aldehydes, esters and alcohol (Javelle et al., 2010; Loneman et al., 2017). Several functional groups, such as carbonyls and/or unsaturated groups, can potentially act as electron donors and therefore contribute to HONO formation (Kunst, 2003; Prasad et al., 1990; Wen and Jetter, 2009). Since waxes are present on the leaf surface and HONO formation on these films was quite similar to the values observed on Zea mays leaves, it is more likely that waxes
18 are partly responsible for the HONO measured. Many structures and wax compositions are reported in the literature, suggesting that different plants could emit different amounts of HONO (Barthlott et al., 1998; Holloway et al., 1976; Koch et al., 2008; Reynhardt and Riederer, 1994). Our experiments on wax extracts deposited on thin films also showed a rapid depletion of the reactive sites not observed on Zea mays leaves. It is difficult to say if this is due to the different surfaces (one flat and the other with a certain roughness) or if other chemical components of the leaf surface could additionally contribute to HONO formation (for example, components of the cutin that contain both unsaturated carboxylic acids or diacids).
Table 2 presents several surfaces onto which the formation of HONO has been reported. Recently, soil was proposed as a possible contributor to missing HONO sources. HONO production in soil is highly variable depending on soil composition, moisture, and the presence of fertilizers (Bhattarai et al., 2018; Donaldson et al., 2014; Meusel et al., 2018; Scharko et al., 2015; Wu et al., 2019). Bhattarai et al. (2018) and Wu et al. (2019) evaluated the HONO emission rate from soil ranging from 9.6 × 10⁷ to 8.2 × 10¹¹ molecules cm-2 s-1. On a thin film of humic acid exposed to 17 ppbv of NO2 at 20% RH, the HONO emission rate was
approximately 2.5 × 10¹⁰ molecules cm-2 s-1 (Stemmler et al., 2006); a similar value was reported for soot surfaces (Arens et al., 2001; Han et al., 2017). Most of these surfaces produce at least 3 times more HONO than the tested Zea mays leaf surface. However, to assess which surface may mostly contribute to the total HONO formation in the environment, the total available surface of plant leaves should be considered. Considering HONO emission rates from soil calculated from previous work (Bhattarai et al., 2018; Meusel et al., 2018; Wu et al., 2019; Xue et al., 2019), HONO fluxes ranged from 0.5 pptv h-1 to 400 pptv h-1 depending on the soil properties. Estimations of HONO fluxes from Zea mays leaf surfaces were negligible below 303 K and ranged from 79 ± 17 pptv h-1 at 303 K to 171 ± 23 pptv h-1 at 313 K. Therefore, for warm environments in the presence of 40 ppbv of NO2, leaf contribution to HONO emission
19 can compete with production from soil. In the literature, the so-called “HONO missing sources” were estimated to range from 0.3 - 0.6 ppbv h-1 in a rural mountain site in Germany (Acker et al., 2006), approximately 0.22 ppbv h-1 in a rural site in New York state, USA (Zhou et al.,
2002), and 0.05 - 1.3 ppbv h-1 in a suburban site in the Paris region, France (Michoud et al., 2014). As a result, HONO fluxes from Zea mays leaves may partially contribute to missing HONO sources.
5. Conclusions
For the first time, a systematic investigation of NO2 to HONO conversion on Zea mays leaf
surfaces is reported in the literature. HONO formation was highly enhanced by increasing the temperature and NO2 mixing ratios, while RH (5-58%) and UVA irradiation (0 to 20 W m-2
between 340 and 400 nm) showed no effect. The highest emission rate values reached (5.6 ± 0.8) × 109 molecules cm-2 s-1 at 313 K, 40 ppbv of NO2, 20 W m-2, and 40% RH.
Experiments on synthetic surfaces prepared using wax extract from the leaves suggest that waxes could play a role in HONO formation. Estimations of HONO fluxes under environmental conditions showed that leaves can contribute up to 171 pptv h-1 at 313 K. Based on our results
and considering the high foliage surface present in natural environments, HONO emission on leaves could represent a relevant source of HONO in the boundary layer. As HONO formation depends on environmental conditions, the importance of this source is expected to exhibit both daily and seasonal variations.
Acknowledgements
We thank ADEME for funding the project HONO-CORN, included in PRIMEQUAL program. We also thank Sylvie Dupouyet for the growth of Zea mays plants and INRA (Gif sur Yvette) for providing the Zea mays seeds.
20
References
Acker, K., Möller, D., Wieprecht, W., Meixner, F.X., Bohn, B., Gilge, S., Plass-Dülmer, C., Berresheim, H., 2006. Strong daytime production of OH from HNO2 at a rural
mountain site. Geophysical Research Letters 33, L02809. https://doi.org/10.1029/2005GL024643
Alicke, B., Platt, U., 2002. Impact of nitrous acid photolysis on the total hydroxyl radical budget during the limitation of oxidant production/Pianura Padana Produzione di Ozono study in Milan. Journal of Geophysical Research 107, 8196–8214.
https://doi.org/10.1029/2000JD000075
Arens, F., Gutzwiller, L., Baltensperger, U., Gäggeler, H.W., Ammann, M., 2001.
Heterogeneous reaction of NO2 on diesel soot particles. Environmental Science &
Technology 35, 2191–2199. https://doi.org/10.1021/es000207s
Arens, F., Gutzwiller, L., Gäggeler, H.W., Ammann, M., 2002. The reaction of NO2 with
solid anthrarobin (1,2,10-trihydroxy-anthracene). Physical Chemistry Chemical Physics 4, 3684–3690. https://doi.org/10.1039/b201713j
Aumont, B., Chervier, F., Laval, S., 2002. Contribution of HONO sources to the
NOx/HOx/O3 chemistry in the polluted boundary layer. Atmospheric Environment 37,
487–498. https://doi.org/10.1016/S1352-2310(02)00920-2
Barthlott, W., Mail, M., Bhushan, B., Koch, K., 2017. Plant Surfaces: Structures and Functions for Biomimetic Innovations. Nano-Micro Letters 9, Article 23. https://doi.org/10.1007/s40820-016-0125-1
Barthlott, W., Neinhuis, C., Cutler, D., Ditsch, F., Meusel, I., Theisen, I., Wilhelmi, H., 1998. Classification and terminology of plant epicuticular waxes. Botanical Journal of the Linnean Society 126, 237–260. https://doi.org/10.1111/j.1095-8339.1998.tb02529.x Bejan, I., Aal, Y.A.E., Barnes, I., Benter, T., Bohn, B., Wiesen, P., Kleffmann, J., 2006. The
photolysis of ortho-nitrophenols: a new gas phase source of HONO. Physical Chemistry Chemical Physics 8, 2028–2035. https://doi.org/10.1039/B516590C Bhattarai, H.R., Virkajärvi, P., Yli-Pirilä, P., Maljanen, M., 2018. Emissions of
atmospherically important nitrous acid (HONO) gas from northern grassland soil increases in the presence of nitrite (NO2). Agriculture, Ecosystems & Environment
256, 194–199. https://doi.org/10.1016/j.agee.2018.01.017
Cazoir, D., Brigante, M., Ammar, R., D’Anna, B., George, C., 2014. Heterogeneous photochemistry of gaseous NO2 on solid fluoranthene films: A source of gaseous
nitrous acid (HONO) in the urban environment. Journal of Photochemistry and Photobiology A: Chemistry 273, 23–28.
https://doi.org/10.1016/j.jphotochem.2013.07.016
Croft, H., Chen, J.M., 2018. Leaf Pigment Content, in: Comprehensive Remote Sensing. Elsevier, pp. 117–142. https://doi.org/10.1016/B978-0-12-409548-9.10547-0
Donaldson, M.A., Bish, D.L., Raff, J.D., 2014. Soil surface acidity plays a determining role in the atmospheric-terrestrial exchange of nitrous acid. Proceedings of the National Academy of Sciences 111, 18472–18477. https://doi.org/10.1073/pnas.1418545112 Elshorbany, Y.F., Kurtenbach, R., Wiesen, P., Lissi, E., Rubio, M., Villena, G., Gramsch, E.,
Rickard, A.R., Pilling, M.J., Kleffmann, J., 2009. Oxidation capacity of the city air of Santiago, Chile. Atmospheric Chemistry and Physics 9, 2257–2273.
https://doi.org/10.5194/acp-9-2257-2009
Eurostat, 2019. Main annual crop statistics, statistics explained 1–17.
Finlayson-Pitts, B.J., Wingen, L.M., Sumner, A.L., Syomin, D., Ramazan, K.A., 2003. The heterogeneous hydrolysis of NO2 in laboratory systems and in outdoor and indoor
21 atmospheres: an integrated mechanism. Physical Chemistry Chemical Physics 5, 223– 242. https://doi.org/10.1039/b208564j
Gandolfo, A., Rouyer, L., Wortham, H., Gligorovski, S., 2017. The influence of wall temperature on NO2 removal and HONO levels released by indoor photocatalytic
paints. Applied Catalysis B: Environmental 209, 429–436. https://doi.org/10.1016/j.apcatb.2017.03.021
George, C., Strekowski, R.S., Kleffmann, J., Stemmler, K., Ammann, M., 2005.
Photoenhanced uptake of gaseous NO 2 on solid organic compounds: a photochemical
source of HONO? Faraday Discussions 130, 195. https://doi.org/10.1039/b417888m Han, C., Yang, W., Wu, Q., Yang, H., Xue, X., 2016. Heterogeneous Photochemical
Conversion of NO 2 to HONO on the Humic Acid Surface under Simulated Sunlight.
Environmental Science & Technology 50, 5017–5023. https://doi.org/10.1021/acs.est.5b05101
Han, C., Yang, W., Yang, H., Xue, X., 2017. Influences of O2 and O3 on the heterogeneous
photochemical reaction of NO2 with humic acids. Atmospheric Environment 152, 77–
84. https://doi.org/10.1016/j.atmosenv.2016.12.027
Heland, J., Kleffmann, J., Kurtenbach, R., Wiesen, P., 2001. A new instrument to measure gaseous nitrous acid (HONO) in the atmosphere. Environmental Science &
Technology 35, 3207–3212. https://doi.org/10.1021/es000303t
Holloway, P.J., Jeffree, C.E., Baker, E.A., 1976. Structural determination of secondary alcohols from plant epicuticular waxes. Photochemistry 15, 1768–1770.
https://doi.org/10.1016/S0031-9422(00)97477-6
Honrath, R.E., Lu, Y., Peterson, M.C., Dibb, J.E., Arsenault, M.A., Cullen, N.J., Steffen, K., 2002. Vertical fluxes of NOx, HONO, and HNO3 above the snowpack at Summit,
Greenland. Atmospheric Environment 36, 2629–2640. https://doi.org/10.1016/S1352-2310(02)00132-2
Huang, R.-J., Yang, L., Cao, J., Wang, Q., Tie, X., Ho, K.-F., Shen, Z., Zhang, R., Li, G., Zhu, C., Zhang, N., Dai, W., Zhou, J., Liu, S., Chen, Y., Chen, J., O’Dowd, C.D., 2017. Concentration and sources of atmospheric nitrous acid (HONO) at an urban site in Western China. Science of The Total Environment 593–594, 165–172.
https://doi.org/10.1016/j.scitotenv.2017.02.166
Januszkiewicz, K., Mrozek-Niećko, A., Różański, J., 2019. Effect of surfactants and leaf surface morphology on the evaporation time and coverage area of ZnIDHA droplets. Plant Soil 434, 93–105. https://doi.org/10.1007/s11104-018-3785-4
Javelle, M., Vernoud, V., Depège-Fargeix, N., Arnould, C., Oursel, D., Domergue, F., Sarda, X., Rogowsky, P.M., 2010. Overexpression of the Epidermis-Specific Homeodomain-Leucine Zipper IV Transcription Factor outer cell layer in Maize Identifies Target Genes Involved in Lipid Metabolism and Cuticle Biosynthesis. Plant Physiology 154, 273–286. https://doi.org/10.1104/pp.109.150540
Jenkin, M.E., Cox, R.A., Williams, D.J., 1988. Laboratory studies of the kinetics of formation of nitrous acid from the thermal reaction of nitrogen dioxide and water vapour.
Atmospheric Environment 22, 487–498. https://doi.org/10.1016/0004-6981(88)90194-1
Kleffmann, J., Becker, K.H., Lackhoff, M., Wiesen, P., 1999. Heterogeneous conversion of NO2 on carbonaceous surfaces. Physical Chemistry Chemical Physics 1, 5443–5450.
https://doi.org/10.1039/a905545b
Kleffmann, J., Becker, K.H., Wiesen, P., 1998. Heterogeneous NO2 conversion processes on
acid surfaces: possible atmospheric implications. Atmospheric Environment 32, 2721– 2729. https://doi.org/10.1016/S1352-2310(98)00065-X
22 Kleffmann, J., Benter, T., Wiesen, P., 2004. Heterogeneous reaction of nitric acid with nitric
oxide on glass surfaces under simulated atmospheric conditions. The Journal of Physical Chemistry A 108, 5793–5799. https://doi.org/10.1021/jp040184u Kleffmann, J., Gavriloaiei, T., Hofzumahaus, A., Holland, F., Koppmann, R., Rupp, L.,
Schlosser, E., Siese, M., Wahner, A., 2005. Daytime formation of nitrous acid: A major source of OH radicals in a forest. Geophysical Research Letters 32, L05818. https://doi.org/10.1029/2005GL022524
Koch, K., Bhushan, B., Barthlott, W., 2008. Diversity of structure, morphology and wetting of plant surfaces. Soft Matter 4, 1943–1963. https://doi.org/10.1039/b804854a
Kunst, L., 2003. Biosynthesis and secretion of plant cuticular wax. Progress in Lipid Research 42, 51–80. https://doi.org/10.1016/S0163-7827(02)00045-0
Lammel, G., 1999. Formation of nitrous acid: parameterisation and comparison with observations (No. 286). Max-Planck-Institut für Meteorologie.
Laufs, S., Cazaunau, M., Stella, P., Kurtenbach, R., Cellier, P., Mellouki, A., Loubet, B., Kleffmann, J., 2017. Diurnal fluxes of HONO above a crop rotation. Atmospheric Chemistry and Physics 17, 6907–6923. https://doi.org/10.5194/acp-17-6907-2017 Li, G., Lei, W., Zavala, M., Volkamer, R., Dusanter, S., Stevens, P., Molina, L.T., 2010.
Impacts of HONO sources on the photochemistry in Mexico City during the MCMA-2006/MILAGO Campaign. Atmospheric Chemistry and Physics 10, 6551–6567. https://doi.org/10.5194/acp-10-6551-2010
Li, S., Matthews, J., Sinha, A., 2008. Atmospheric hydroxyl radical production from electronically excited NO2 and H2O. Science 319, 1657–1660.
https://doi.org/10.1126/science.1151443
Li, X., Brauers, T., Häseler, R., Bohn, B., Fuchs, H., Hofzumahaus, A., Holland, F., Lou, S., Lu, K.D., Rohrer, F., Hu, M., Zeng, L.M., Zhang, Y.H., Garland, R.M., Su, H., Nowak, A., Wiedensohler, A., Takegawa, N., Shao, M., Wahner, A., 2012. Exploring the atmospheric chemistry of nitrous acid (HONO) at a rural site in Southern China. Atmospheric Chemistry and Physics 12, 1497–1513. https://doi.org/10.5194/acp-12-1497-2012
Liao, W., Case, A.T., Mastromarino, J., Tan, D., Dibb, J.E., 2006. Observations of HONO by laser-induced fluorescence at the South Pole during ANTCI 2003. Geophysical Research Letters 33, L09810. https://doi.org/10.1029/2005GL025470
Liu, Y., He, H., Ma, Q., 2008. Temperature Dependence of the Heterogeneous Reaction of Carbonyl Sulfide on Magnesium Oxide. The Journal of Physical Chemistry A 112, 2820–2826. https://doi.org/10.1021/jp711302r
Loneman, D.M., Peddicord, L., Al-Rashid, A., Nikolau, B.J., Lauter, N., Yandeau-Nelson, M.D., 2017. A robust and efficient method for the extraction of plant extracellular surface lipids as applied to the analysis of silks and seedling leaves of maize. PLoS ONE 12, e0180850. https://doi.org/10.1371/journal.pone.0180850
Longfellow, C.A., Ravishankara, A.R., Hanson, D.R., 1999. Reactive uptake on hydrocarbon soot: Focus on NO 2. Journal of Geophysical Research: Atmospheres 104, 13833–
13840. https://doi.org/10.1029/1999JD900145
Meusel, H., Tamm, A., Kuhn, U., Wu, D., Leifke, A.L., Fiedler, S., Ruckteschler, N., Yordanova, P., Lang-Yona, N., Pöhlker, M., Lelieveld, J., Hoffmann, T., Pöschl, U., Su, H., Weber, B., Cheng, Y., 2018. Emission of nitrous acid from soil and biological soil crusts represents an important source of HONO in the remote atmosphere in Cyprus. Atmospheric Chemistry and Physics 18, 799–813.
https://doi.org/10.5194/acp-18-799-2018
Michoud, V., Colomb, A., Borbon, A., Miet, K., Beekmann, M., Camredon, M., Aumont, B., Perrier, S., Zapf, P., Siour, G., Ait-Helal, W., Afif, C., Kukui, A., Furger, M., Dupont,
23 J.C., Haeffelin, M., Doussin, J.F., 2014. Study of the unknown HONO daytime source at a European suburban site during the MEGAPOLI summer and winter field
campaigns. Atmospheric Chemistry and Physics 14, 2805–2822. https://doi.org/10.5194/acp-14-2805-2014
Moreau, S., 2015. L’occupation des sols en France : progression plus modérée de l’artificialisation entre 2006 et 2012 [WWW Document]. URL
https://www.statistiques.developpement-durable.gouv.fr/loccupation-des-sols-en-france-progression-plus-moderee-de-lartificialisation-entre-2006-et-2012 (accessed 5.3.20).
Oswald, R., Behrendt, T., Ermel, M., Wu, D., Su, H., Cheng, Y., Breuninger, C., Moravek, A., Mougin, E., Delon, C., Loubet, B., Pommerening-Roser, A., Sorgel, M., Poschl, U., Hoffmann, T., Andreae, M.O., Meixner, F.X., Trebs, I., 2013. HONO emissions from soil bacteria as a major source of atmospheric reactive nitrogen. Science 341, 1233–1235. https://doi.org/10.1126/science.1242266
Oswald, R., Ermel, M., Hens, K., Novelli, A., Ouwersloot, H.G., Paasonen, P., Petäjä, T., Sipilä, M., Keronen, P., Bäck, J., Königstedt, R., Hosaynali Beygi, Z., Fischer, H., Bohn, B., Kubistin, D., Harder, H., Martinez, M., Williams, J., Hoffmann, T., Trebs, I., Sörgel, M., 2015. A comparison of HONO budgets for two measurement heights at a field station within the boreal forest in Finland. Atmospheric Chemistry and Physics 15, 799–813. https://doi.org/10.5194/acp-15-799-2015
Perner, D., Platt, U., 1979. Detection of nitrous acid in the atmosphere by differential optical absorption. Geophysical Research Letters 6, 917–920.
https://doi.org/10.1029/GL006i012p00917
Prasad, R.B.N., Moller, E., Gülz, P.-G., 1990. Epicuticular waxes from leaves of Quercus robur. Phytochemistry 29, 2101–2103. https://doi.org/10.1016/0031-9422(90)83013-Q Ramazan, K.A., Syomin, D., Finlayson-Pitts, B.J., 2004. The photochemical production of
HONO during the heterogeneous hydrolysis of NO2. Physical Chemistry Chemical
Physics 6, 3836–3843. https://doi.org/10.1039/b402195a
Reynhardt, E.C., Riederer, M., 1994. Structures and molecular dynamics of plant waxes: II. Cuticular waxes from leaves of Fagus sylvatica L. and Hordeum vulgare L. European Biophysics Journal 23, 59–70. https://doi.org/10.1007/BF00192206
Sarwar, G., Roselle, S.J., Mathur, R., Appel, W., Dennis, R.L., Vogel, B., 2008. A comparison of CMAQ HONO predictions with observations from the Northeast Oxidant and Particle Study. Atmospheric Environment 42, 5760–5770.
https://doi.org/10.1016/j.atmosenv.2007.12.065
Scharko, N.K., Schütte, U.M.E., Berke, A.E., Banina, L., Peel, H.R., Donaldson, M.A., Hemmerich, C., White, J.R., Raff, J.D., 2015. Combined flux chamber and genomics approach links nitrous acid emissions to ammonia oxidizing bacteria and archaea in urban and agricultural soil. Environmental Science & Technology 49, 13825–13834. https://doi.org/10.1021/acs.est.5b00838
Shrivastava, M., Nguyen, A., Zheng, Z., Wu, H.-W., Jung, H.S., 2010. Kinetics of Soot Oxidation by NO 2. Environmental Science & Technology 44, 4796–4801.
https://doi.org/10.1021/es903672y
Spataro, F., Ianniello, A., Esposito, G., Allegrini, I., Zhu, T., Hu, M., 2013. Occurrence of atmospheric nitrous acid in the urban area of Beijing (China). Science of The Total Environment 447, 210–224. https://doi.org/10.1016/j.scitotenv.2012.12.065
Stemmler, K., Ammann, M., Donders, C., Kleffmann, J., George, C., 2006. Photosensitized reduction of nitrogen dioxide on humic acid as a source of nitrous acid. Nature 440, 195–198. https://doi.org/10.1038/nature04603
24 Stemmler, K., Ndour, M., Elshorbany, Y., Kleffmann, J., D’Anna, B., George, C., Bohn, B.,
Ammann, M., 2007. Light induced conversion of nitrogen dioxide into nitrous acid on submicron humic acid aerosol. Atmospheric Chemistry and Physics 7, 4237–4248. https://doi.org/10.5194/acp-7-4237-2007
Svensson, R., Ljungström, E., Lindqvist, O., 1987. Kinetics of the reaction between nitrogen dioxide and water vapour. Atmospheric Environment 21, 1529–1539.
https://doi.org/10.1016/0004-6981(87)90315-5
Tlili, S., Nieto-Gligorovski, L.I., Temime-Rousell, B., Gligorovski, S., Wortham, H., 2010. Humidity and temperature dependences of the adsorption and desorption rates for acetone and xylene on silicon wafer. Journal of The Electrochemical Society 157, 43– 48. https://doi.org/10.1149/1.3321964
Villena, G., Wiesen, P., Cantrell, C.A., Flocke, F., Fried, A., Hall, S.R., Hornbrook, R.S., Knapp, D., Kosciuch, E., Mauldin, R.L., McGrath, J.A., Montzka, D., Richter, D., Ullmann, K., Walega, J., Weibring, P., Weinheimer, A., Staebler, R.M., Liao, J., Huey, L.G., Kleffmann, J., 2011. Nitrous acid (HONO) during polar spring in Barrow, Alaska: A net source of OH radicals? Journal of Geophysical Research 116, D00R07. https://doi.org/10.1029/2011JD016643
Vogel, B., Vogel, H., Kleffmann, J., Kurtenbach, R., 2003. Measured and simulated vertical profiles of nitrous acid—Part II. Model simulations and indications for a photolytic source. Atmospheric Environment 37, 2957–2966. https://doi.org/10.1016/S1352-2310(03)00243-7
Wen, M., Jetter, R., 2009. Composition of secondary alcohols, ketones, alkanediols, and ketols in Arabidopsis thaliana cuticular waxes. Journal of Experimental Botany 60, 1811–1821. https://doi.org/10.1093/jxb/erp061
Wrigley, C., Corke, H., Seetharaman, K., Faubion, J., 2004. Encyclopedia of Food Grains, Academic Press. ed.
Wu, D., Horn, M.A., Behrendt, T., Müller, S., Li, J., Cole, J.A., Xie, B., Ju, X., Li, G., Ermel, M., Oswald, R., Fröhlich-Nowoisky, J., Hoor, P., Hu, C., Liu, M., Andreae, M.O., Pöschl, U., Cheng, Y., Su, H., Trebs, I., Weber, B., Sörgel, M., 2019. Soil HONO emissions at high moisture content are driven by microbial nitrate reduction to nitrite: tackling the HONO puzzle. The ISME Journal 13, 1688–1699.
https://doi.org/10.1038/s41396-019-0379-y
Xue, C., Ye, C., Zhang, Y., Ma, Z., Liu, P., Zhang, C., Zhao, X., Liu, J., Mu, Y., 2019. Development and application of a twin open-top chambers method to measure soil HONO emission in the North China Plain. Science of The Total Environment 659, 621–631. https://doi.org/10.1016/j.scitotenv.2018.12.245
Yang, W., Han, C., Yang, H., Xue, X., 2018. Significant HONO formation by the photolysis of nitrates in the presence of humic acids. Environmental Pollution 243, 679–686. https://doi.org/10.1016/j.envpol.2018.09.039
Zhao, D., Raja Reddy, K., Kakani, V.G., Read, J.J., Carter, G.A., 2003. Corn (Zea mays L.) growth, leaf pigment concentration, photosynthesis and leaf hyperspectral reflectance properties as affected by nitrogen supply. Plant and Soil 257, 205–218.
https://doi.org/10.1023/A:1026233732507
Zhou, X., Beine, H.J., Honrath, R.E., Fuentes, J.D., Simpson, W., Shepson, P.B., Bottenheim, J.W., 2001. Snowpack photochemical production of HONO: A major source of OH in the Arctic boundary layer in springtime. Geophysical Research Letters 28, 4087–4090. https://doi.org/10.1029/2001GL013531
Zhou, X., Civerolo, K., Dai, H., Huang, G., Schwab, J., Demerjian, K., 2002. Summertime nitrous acid chemistry in the atmospheric boundary layer at a rural site in New York
25 State: summertime nitrous acid chemistry. Journal of Geophysical Research:
Atmospheres 107, ACH 13-1-ACH 13-11. https://doi.org/10.1029/2001JD001539 Zhou, X., Gao, H., He, Y., Huang, G., Bertman, S.B., Civerolo, K., Schwab, J., 2003. Nitric
acid photolysis on surfaces in low-NOx environments: Significant atmospheric implications: nitric acid photolysis on surface. Geophysical Research Letters 30, 2217–2220. https://doi.org/10.1029/2003GL018620
26 Figure 1: Experimental setup for the determination of HONO formation on Zea mays leaves
Figure 2: Surface emission rates of HONO on a glass plate or a Zea mays leaf at different conditions of A) light intensity (at relative humidity = 40%, [NO2] = 40 ppbv, temperature =
303 K), B) relative humidity (at [NO2] = 40 ppbv, light intensity = 20 W m-2, temperature =
27 temperature = 303 K), and D) temperature (at relative humidity = 40%, [NO2] = 40 ppbv, light
intensity = 20 W m-2). Points represent the average and error bars are the standard deviations for 3 positions of the injector.
Figure 3: Arrhenius plot of HONO formation rates on Zea mays leaves at 40 ppbv of NO2, 40%
relative humidity and 20 W m-2. Points represent the average and error bars are the standard
28 Figure 4: HONO emission rates (molecule cm-2 s-1) for chlorophyll a (Chl a), wax and leaf surfaces at 313 K, 40 ppbv of NO2, 40% relative humidity and 20 W m-2 (Experiments wax
plate 1 and 1 bis are carried out on the same plate one after the other while wax plate 1 and 2 are experiments with two different plates covered by the same wax extract)
29
Author Surfaces Temperature
(K) RH (%) [NO2] (ppb) Uptake NO2
This study Zea mays
leaves 303 40 40 (6.5 ± 0.2) × 10 -7 (Han et al., 2016) Humic acid 298 22 30 ~1.9 × 10 -7 (Arens et al., 2002) Anthrarobin 299 42 ~38 ~1 × 10 -6 (George et al., 2005) Catechol ~304 42 ~20 1.1 × 10 -6 (George et al., 2005) Anthracene ~304 56 ~20 1.9 × 10 -6
Table 1: NO2 uptakes measured in darkness under different conditions of temperature, RH and
NO2 concentrations
Table 2: HONO surface emission rates under different conditions of temperature and RH on several surfaces
Author Surfaces Temperature (K) RH (%) [NO2] (ppb) HONO emission rates
(molecules cm-2 s-1)
This study Zea mays leaves 288-313 6 - 58 10 - 80 (6.9 ± 0.5) × 10
8 to (6.8 ± 0.8) × 109 (Battarai et al. 2018) Northern grassland soil 294 - - 9.6 × 10 7 to 4.4 × 10⁹ (Wu et al. 2019) Soil 298 - - 2.2 × 10 11 to 8.2 × 10¹¹ (Arens et al. 2001) Diesel soot 295 30% 20 ~2.5 × 10 10 (Han et al.,
2017) Fuel rich soot 298 30 - 70 160 2.9 × 10
10 (Arens et al., 2002) Anthrarobin film 299 42 40 8 × 10 9
30
Conditions
HONO fluxes from Zea mays leaves (molecules cm-2 s-1) HONO fluxes estimated by unit of ground surface (molecules m-2 h-1) HONO fluxes from leaves considering a mixing layer height of 300 m (ppt h-1) With subtraction of blank experiments T = 303 K (2.7 ± 0.6) × 109 (5.8 ± 1.2) × 1017 79 ± 17 T = 313 K (5.6± 0.8) × 109 (1.2 ± 0.2) × 1018 171 ± 23 Without subtraction of blank experiments T = 303 K (4.1 ± 0.4) × 109 (8.9 ± 0.9) × 1017 122 ± 12 T = 313 K (6.8 ± 0.8) × 109 (1.5 ± 0.2) × 1018 208 ± 22
Table 3: Estimation of HONO fluxes from leaves in a rural environment in France assuming vegetation would possess an LAI of 6 m2 m-2 at 303 K and 313 K (RH = 40%, [NO2] = 40 ppb)
![Figure 2 : Surface emission rates of HONO on a glass plate or a Zea mays leaf at different conditions of A) light intensity (at relative humidity = 40%, [NO 2 ] = 40 ppbv, temperature = 303 K), B) relative humidity (at [NO 2 ] = 40 ppbv](https://thumb-eu.123doks.com/thumbv2/123doknet/13734885.436668/27.892.94.787.108.439/surface-emission-different-conditions-intensity-relative-humidity-temperature.webp)
![Table 3: Estimation of HONO fluxes from leaves in a rural environment in France assuming vegetation would possess an LAI of 6 m 2 m -2 at 303 K and 313 K (RH = 40%, [NO 2 ] = 40 ppb)](https://thumb-eu.123doks.com/thumbv2/123doknet/13734885.436668/31.892.66.704.119.357/table-estimation-fluxes-environment-france-assuming-vegetation-possess.webp)
