j
March 1981
(9
Guillermo Ijtra A. 1981The author hereby grants to M.I.T. per'ssion reprod d to distribute copies of this thesis cum nt i or in par7.
SII eartjletOfNr .A arVgineig Signature of Author
Certified by
/D-epar tpient o f Nuc gl neerl ng March 25, 1981
javtd-D. Lanning4. Thesis Supervi sot Certified by
Paul -J.( Ncholson, Thesis Co-SUpervisor
Certified by
aoug -a-s- Carmithael, Thesis Reader
Accepted by
MASSACHUSETTS INSTAIanF.enryE;hairman, epartmenaraduate Cormittee
JLIPRF for a Marine Nuclear Propulsion Plant
by
Guillermo Baltra Aedo
Ingeniero Naval Electricista, Academia Politecnica Naval (1977)
SUBMITTED TO THE DEPARTMENT OF NUCLEAR ENGINEERING
IN PARTIAL FULFILLMENT OF THE REQUIREMENTS OF THE
DEGREES OF NUCLEAR ENGINEER
and
A MARINE NUCLEAR PROPULSION PLANT
by
GUILLERMO BALTRA AEDO
Submitted to the Department of Nuclear Engineering on March 18, 1981 in partial fulfillment of the requirements for the Degree of Nuclear Engineer
and Master of Science in Naval Architecture and Marine Engineering
ABSTRACT
A methodology to achieve the preliminary design of a surveillance, data validation and control system (SDCS) for a power plant is
developed. This method is applied to the specific case of designing a surveillance, data validation and control system for the N.S. Savannah nuclear propulsion plant. The study has two major sections. The first part develops the procedure for the preliminary design of the SDCS. The second part has the design and analysis of the pressure and volume control system for the N.S. Savannah pressurizer. This second part is included as an example of the procedure to be followed beyond the
preliminary design stage.
The preliminary design stage starts with a study of the N.S. Savannah nuclear propulsion plant to obtain the input-output
characteristics required for control. With this information, the SDCS is sized and eight alternative architectures are developed.
The selection of the best alternative is made by means of a figure of merit calculated as the Expected Monetary Value for each
architecture. The results of this study indicate that a distributed architecture using star interconnection with serial communication is
the optimal alternative for the specific case of N.S. Savannah nuclear propulsion plant.
The proposed design of the pressure and volume control system is made on the basis of a Proportional-Integral-Derivative (PID)
controller, and motor operated valves. In order to test the transient responses obtained with the control system, a quasi-steady state model for the pressurizer is developed.
that no integral action is required for the controller. Also the PID controller is tuned with a strong derivative action. The response of
the system under transient conditions is predicted to be within the quarter amplitude decay criterion.
Thesis Supervisor: Dr. David D. Lanning
Title: Professor of Nuclear Engineering
Thesis Co-Supervisor: Dr. Paul J. Nicholson Title: Visiting Scientist
Thesis Reader: Dr. Douglas A. Carmichael
ACKNOWLEDGMENTS
I would like to express my gratitude to my thesis advisors, Dr. David D. Lanning, Dr. Paul J. Nicholson, and Dr. Douglas A. Carmichael for their continued support and encouragement during the term of this work. I would also like to thank the support given by the Chilean Navy sponsoring this study. I would like to acknowledge the cooperation provided by the Digital Equipment Corporation and in particular I appreciate the assistance provided by Mr. Carl L. Noelcke, Mr. Timothy Litt, and Mr. Richard A. Gaudette. I would like to thank Mrs. Alice J. Sanderson and Mrs. Priscilla F. Kelly for production of the manuscript and drawings.
Guillermo Baltra A. was born the 16th of January, 1951 in Santiago, Chile. He completed grammar school studies at the Manuel Barros
Borgono School, and high school studies at Gabriela Mistral School. Both institutions are in Santiago, Chile. From 1966 to 1970, the author attended the Naval Academy where he graduated as a Navy officer with the higher rank in his promotion. From 1974 to 1977 he attended
the Naval Polytechnic Academy where he graduated as a Naval Electrical Engineer with the higher rank in his promotion. From 1978 to 1981 he attended Massachusetts Institute of Technology, where his degree
program included both Nuclear Engineer and Master of Science in Naval Architecture and Marine Engineering.
The author has previously published his Electrical Engineering thesis entitled "Design and Construction of a Nuclear Reactor
Simulator" in 1977. He has worked in several Navy posts, including one as manager of a major electrical project at the Naval Shipyards at Talcahuano, Chile.
Page
Introduction 17
1. Design Methodology 22
1.1 Introduction 22
1.2 Operational Requirements 22
1.3 System Characteri stics 24
1.3.1 Coordinated Control of the Load 25
1.3.2 Safety Control 25
1.3.3 Data Validation 26
1.3.4 Surveillance and Diagnosis 28
1.3.5 Operator Advice 29
1.3.6 Offline Data Supply 29
1.4 Preliminary Design 29
1.4.1 Expected Monetary Value 30
References 34
2. Preliminary Design 36
2.1 Introduction 36
2.2 Organization and Definition of the Functions 37
2.2.1 Control Function 38
2.2.2 Communication Function 40
2.3 Function Specifications 41
2.3.1 Basic Control Functions 41
2.3.2 Advanced Control Functions 62
TABLE OF CONTENTS
Page
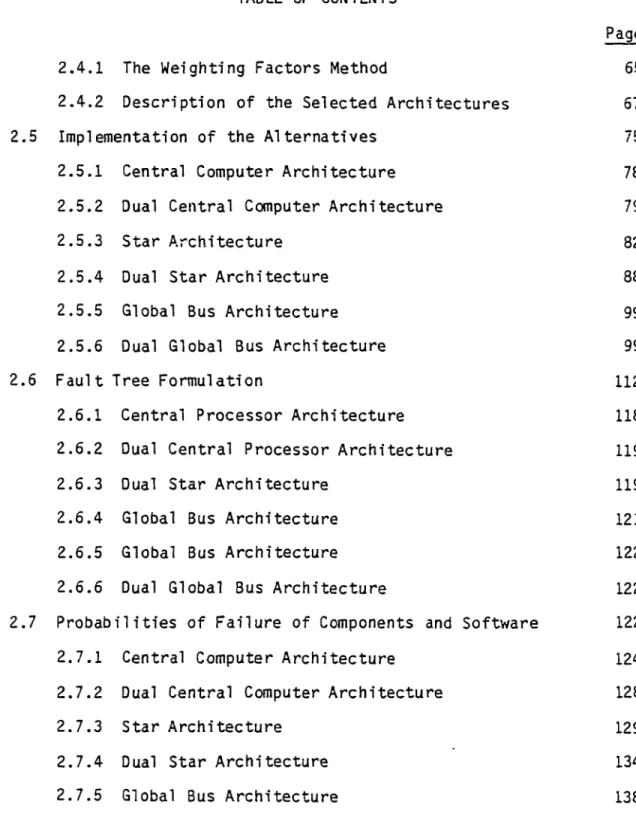
2.4.1 The Weighting Factors Method 65
2.4.2 Description of the Selected Architectures 67
2.5 Implementation of the Alternatives 75
2.5.1 Central Computer Architecture 78
2.5.2 Dual Central Computer Architecture 79
2.5.3 Star Architecture 82
2.5.4 Dual Star Architecture 88
2.5.5 Global Bus Architecture 99
2.5.6 Dual Global Bus Architecture 99
2.6 Fault Tree Formulation 112
2.6.1 Central Processor Architecture 118
2.6.2 Dual Central Processor Architecture 119
2.6.3 Dual Star Architecture 119
2.6.4 Global Bus Architecture 121
2.6.5 Global Bus Architecture 122
2.6.6 Dual Global Bus Architecture 122 2.7 Probabilities of Failure of Components and Software 122
2.7.1 Central Computer Architecture 124
2.7.2 Dual Central Computer Architecture 128
2.7.3 Star Architecture 129
2.7.4 Dual Star Architecture 134
Page
2.7.6 Dual Global Bus Architecture 140
2.8 Cost of the Architectures 141
2.8.1 Central Computer Architecture Cost 143 2.8.2 Dual Central Computer Architecture Cost 144
2.8.3 Star Architecture Cost 145
2.8.4 Dual Star Architecture Cost 146
2.8.5 Global Bus Architecture Cost 147 2.8.6 Dual Global Bus Architecture Cost 147
2.9 Expected Monetary Value Analysis 147
2.9.1 Introduction 147
2.9.2 Decision Tree 148
2.9.3 Payoff Calculations 150
2.9.4 EMV Analysis 153
2.9.5 EMY Analysis with a Fault Tolerant Computer 156
2.10 Sensitivity Analysis 159
2.10.1 Introduction 159
2.10.2 Discussion of the Results 161
References 173
3. Model of N.S. Savannah Nuclear Reactor Pressurizer 175
3.1 Introduction 175
3.2 Mathematical Model for the Pressurizer 175
3.2.1 Steam Control Volume 176
TABLE OF CONTENTS
Page
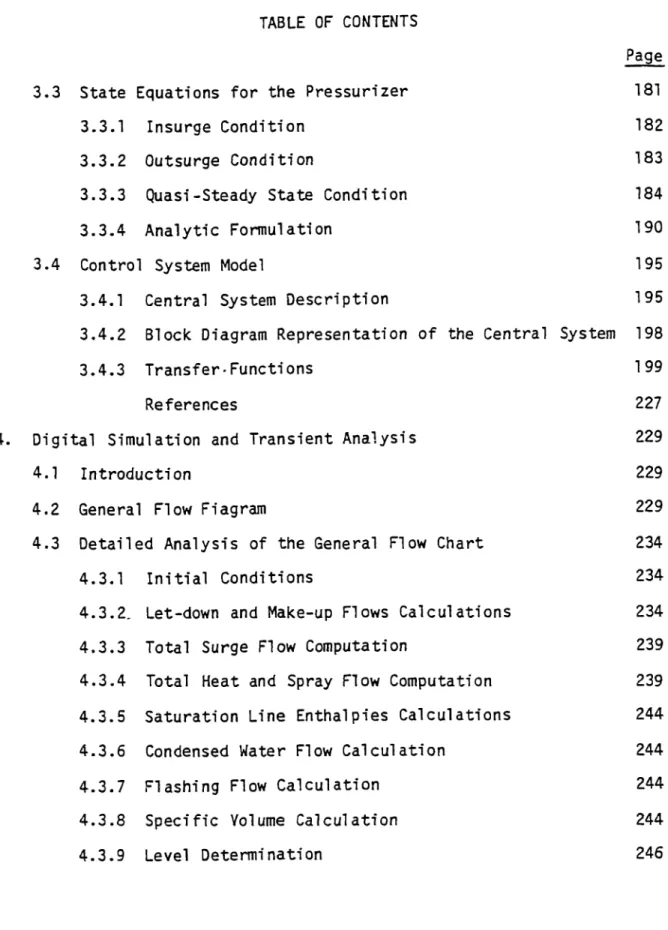
3.3 State Equations for the Pressurizer 181
3.3.1 Insurge Condition 182
3.3.2 Outsurge Condition 183
3.3.3 Quasi-Steady State Condition 184
3.3.4 Analytic Formulation 190
3.4 Control System Model 195
3.4.1 Central System Description 195
3.4.2 Block Diagram Representation of the Central System 198
3.4.3 Transfer-Functions 199
References 227
4. Digital Simulation and Transient Analysis 229
4.1 Introduction 229
4.2 General Flow Fiagram 229
4.3 Detailed Analysis of the General Flow Chart 234
4.3.1 Initial Conditions 234
4.3.2. Let-down and Make-up Flows Calculations 234
4.3.3 Total Surge Flow Computation 239
4.3.4 Total Keat and Spray Flow Computation 239 4.3.5 Saturation Line Enthalpies Calculations 244 4.3.6 Condensed Water Flow Calculation 244
4.3.7 Flashing Flow Calculation 244
4.3.8 Specific Volume Calculation 244
TABLE OF CONTENTS
Page
4.3.10 Surge Enthalpy Calculation 246
4.3.11 Print Sequence 246
4.3.12 Pressure Integration 246
4.3.13 Water Enthalpy Integration 246
4.3.14 Steam Mass Integration 246
4.3.15 Water Mass~ Integration 248
4.3.16 Iteration 248
4.4 The Program 248
4.5 Control System Tuning 249
4.5.1 Simulation Input Data 249
4.5.2 Control System Tuning 251
4.5.3 Study Cases 253
References 264
5. Summary and Conclusions 265
5.1 Preliminary Design Conclusions 266
5.2 Pressure and Volume Control System Design Conclusions 267
5.3 General Recommendations 268
APPENDICES
A. N.S. Savannah Reactor Features 272
B. Software Parameters Forecasting 284
C. Configuring Sheet for Architectures 295
TABLE OF CONTENTS
Page
E. Debugging Time Calculations 444
F. Sensitivity Analysis 447
G. State Equations for the Quasi-Steady State Condition 453,
H. Control System Simulation Program 458
LIST OF FIGURES
Page
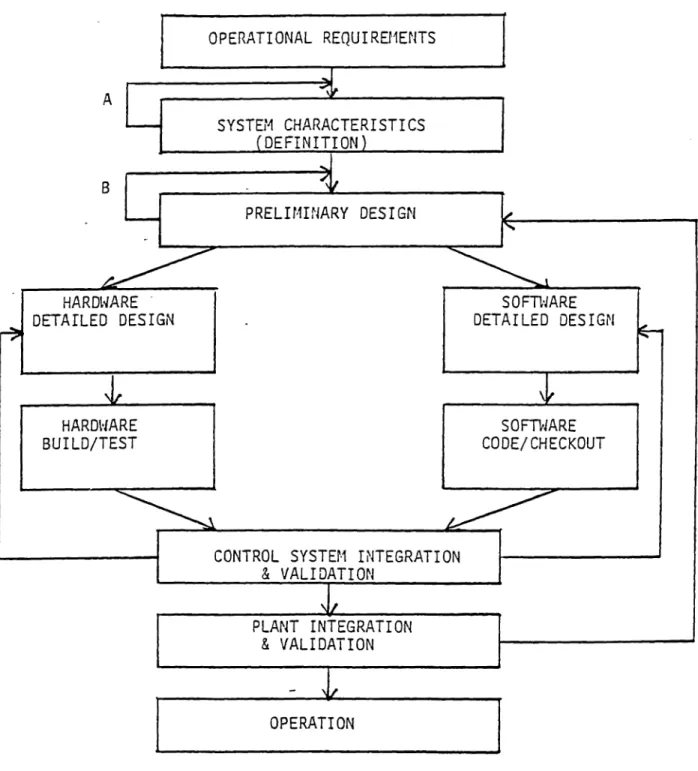
1.1.1 Design Process Flow Diagram 23
1.4.1 Generalized Decision Tree 32
2.4.1 Central Processor Architecture, Block Diagram 69 2.4.2 Dual Central Computer Architecture, Block Diagram 70 2.4.3 Global Data Bus Architecture, Block Diagram 71 2.4.4 Dual Global Data Bus Architecture, Partial Block Diagram 73
2.4.5 Star Architecture, Block Diagram 74
2.4.6 Dual Star Architecture, Parallel Transmission,
Partial Block Diagram 76
2.4.7 Dual Star Architecture, Serial Transmission, Parallel
Block Diagram 77
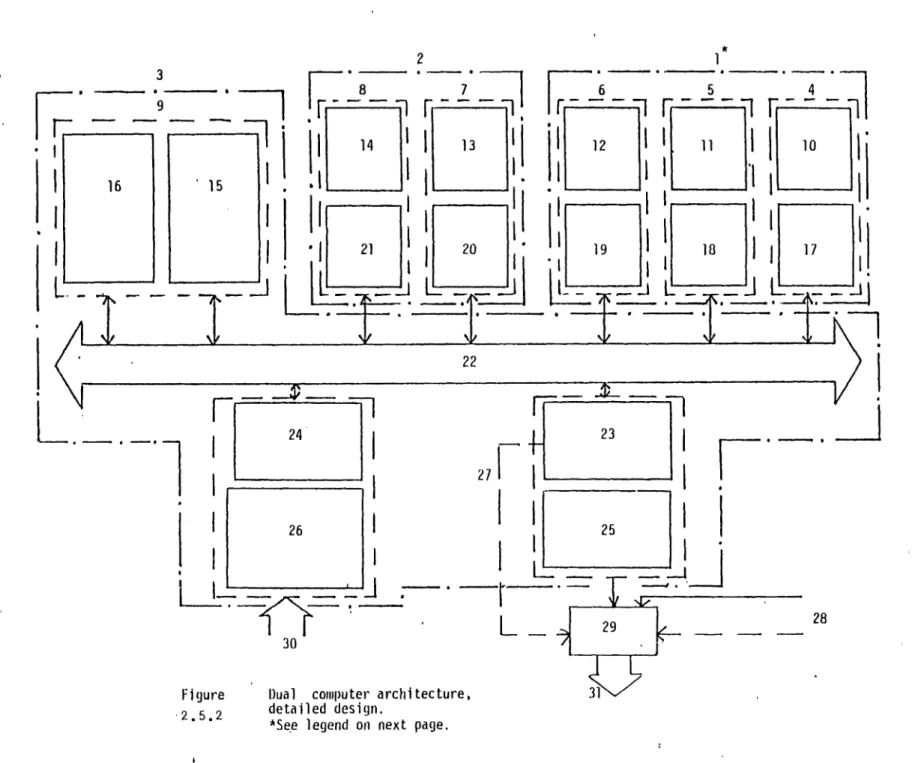
2.5.1 Central Computer Architecture, Detailed Design 80 2.5.2 Dual Computer Architecture, Detailed Design 83 2.5.3 Star Architecture, Parallel Transmission, Detailed Design 89 2.5.4 Star Architecture, Serial Transmission, Detailed Design 95 2.5.5 Dual Star Architecture, Parallel Transmission,
Detailed Design 100
2.5.6 Dual Star Architecture, Serial Transmission,
Detailed Design 104
2.5.7 Global Bus Architecture, Block Diagram 108 2.5.8 Dual Global Bus Architecture, Detailed Design 113
2.9.1 Decision Tree for Situation One 149
LIST OF FIGURES
2.10.1 EMV Sensitivity to Cost Variations (Situation One) 2.10.2 EMV Sensitivity to Probability of a Control
Microprocessor Failure (Situation One)
2.10.3 EMV Sensitivity to Probability of a Diagnosis Microprocessor Failure (Situation One)
2.10.4 EMV Sensitivity to Probability of a Diagnosis Microprocessor Failure (Situation One)
2.10.5 EMV Sensitivity (Situation One) 2.10.6 EMY Sensitivity 2.10.7 EMY Sensitivity (Situation One) 2.10.8 EMV Sensitivity (Situation One) 2.10.9 EMV Sensitivity 2.10.10 EMV Sensitivity 2.10.11 EMV Sensitivity (Situation Two) 2.10.12 EMY Sensitivity (Situation Two) 2.10.13 EMY Sensitivity 2.10.14 EMV Sensitivity (Situation Two)
to Probability of a Software Failure
to to
164 164 Payoff of Success (Situation One)
Probability of Line Failure
165 to Time Between Maintenance Policy
to to to
Alternative Cost (Situation Two) Operator Failure (Situation Two) a Central Processor Failure
165 166 166 167 167 168 to a Diagnosis Microprocessor Failure
to to
Line Failure (Situation Two) Time Between Maintenance Policy
168 Page 162 162 163 163
LIST OF FIGURES 2.10.15 2.10.16 3.2.1 a 3.2.1 b 3.3.1
EMV Sensitivity to Software Failure (Situation Two) EMV Sensitivity to Probability of Software Failure Dual Star Serial Architecture (Situation One)
Steam Control Volume Water Control Volume Quasi-Steady State Model
3.4.1 Pressure and Volume Control System
3.4.2 Pressure and Volume Control System, Detailed Block Diagram
3.4.3 Analog-Digital (A/D), Digital-Analog (D/A), Transfer Function Model
3.4.4a Armature Controlled DC Motor
3.4.4b Armature Controlled DC Motor, Block Diagram 3.4.5 Hysteresis Cycles for the Heaters
4.2.1 General Flow Chart
4.3.1 Wlet and wmak Computations 4.3.2 QH and w sp Computations
4.3.3 Wf1 Computations
4.3.4 wsu (h su -hf) Computations 4.5.1 PID Controller Tuning
4.5.2 Pressurizer Pressure Behavior Under Transient Conditions 4.5.3 Pressurizer Level Behavior Under Transient Conditions 4.5.4 Pressurizer Pressure Behavior Under Transient Conditions
Page 169 170 177 177 186 196 200 207 211 211 221 231 237 240 245 247 252 256 257 258
LIST OF FIGURES 4.5.5 4.5.6 4.5.7 A.1 D.1 D.2 D.3 D.4 D.5 D.6 D.9 D.10 D. 11 D.13 D.14 D.15 D.16 I.1
Pressurizer Level Behavior Under Transient Conditions Pressurizer Pressure Behavior Under Transient Conditions Pressurizer Level Behavior Under Transient Conditions N.S. Savannah Nuclear Propulsion Plant
Central Computer Architecture, Situation One Central Computer Architecture, Situation Two Dual Central Computer, Situation One
Dual Central Computer Architecture, Situation Two Star Architecture, Parallel Transmission Alternative, Situation One
Star Architecture, Parallel Transmission Alternative, Situation Two
Dual Star Architecture, Parallel Transmission Alternativ Situation One
Dual Star Architecture, Parallel Transmission Alternativ( Situation Two
Dual Star Architecture, Serial Transmission Alternative, Situation One
Global Bus Architecture, Situation One Global Bus Architecture, Situation Two Dual Global Bus Architecture, Situation One Dual Global Bus Architecture, Situation Two Pressurizer Page 259 260 261 273 336 338 340 345 349 362 e, e, 370 385 392 412 416 421 436 469
INTRODUCTION
In order to satisfy social needs, and with the assistance of accelerated technological development, complex industrial processes have been developed. Examples include the chemical industry, the metallurgical industry and the electric power generation industry. All of these industries are characterized by a coordinated operation among
several devices which are organized to perform a specific task.
Another feature of these processes is the high volume of data flowing between the processes and their central control systems. Central control systems are responsible for coordinating all the tasks and
guiding the complex toward the optimal point of its capabilities. Traditionally it has been the human operator who bore most of the control and coordination burden, but the volumes of information
together with the short time constants involved in complex industrial processes, have threatened to overwhelm human reaction capabilities. This is especially true in situations with sharp changes in process parameters. Recent trends have been to utilize automatic controls which can handle such situations, thus making the process operation
safer and more closely optimal.
The detailed analysis on industrial trends performed by Merrit (Reference Int.1) makes clear that direct digital control (DDC) and distributed digital control are the best automatic control system
design alternatives for the near future, to replace the present analog control instruments that are now used in most process control systems.
related to the following peculiar characteristics of digital control: 1. Digital control can handle a larger amount of information
simul taneously.
2. Digital control has the capability of making logical decision. 3. Digital control has the capability of storing and recalling
information.
4. Digital control algorithms can be easily updated by changing the software.
5. Digital control hardware can be used in association with very important- tasks of sensor validation, process surveillance, and aiding the operator in critical situations.
These characteristics make digital control ideal for controlling devices to be used in a nuclear power plant in which a high
availability plus an optimal fuel utilization, and overall, a high level of safety, are required. What is desired then is to find the appropriate digital architecture which performs these functions in the best possible way.
This thesis seeks mainly to answer the question of finding the digital architecture most appropriate for controlling the plant,
performing data validation, plant surveillance, and operator aid. The plant chosen for the analysis (the N.S. Savannah nuclear propulsion plant) is a marine propulsion plant: this plant has a
pneumatic-electrical control system (analog control system).
Alternatives for replacing the original control system with a digital' control system with data validation and surveillance capabilities are
studied, and a method for selecting the best architecture to perform these tasks is demonstrated.
The work has been divided into two major areas:
1. Design and selection of the optimal digital architecture.
2. Design of the automatic control system of one dedicated control loop in the plant. The loop chosen is the pressure and volume control at the pressurizer.
Because the scope of the work is broad, it was decided to develop a general methodology which first leads to the design and then to the
selection of the optimal architecture. The design of the pressurizer control loop is intended as an example which can be followed with further work in other distributed control loops.
Although the design will be performed on a specific N.S. Savannah case, the methodology developed is intended to be general and it can be applied to other nuclear power control systems.
The sequence of the work performed in the first part of this study is summarized as follows.
1. Eight feasible architectures are selected among several alternatives, by using a weighting factor method. This step narrows the number of possibilities to a manageable group of alternatives.
2. Each one of the alternative designs is detailed to the component level.
3. A figure of merit for selecting the optimal alternative is
the weighting factors and requires: knowledge of the probability of failure for each alternative, their corresponding costs, and the payoff (negative or positive) that the failure or success of the architectures willinvolve.
4. In order to calculate the probability of failure for each
alternative, the corresponding fault trees are derived. The basic event probabilities will be calculated on the basis of data
supplied by component vendors.
5. The figure of merit is calculated and the best architecture is selected by analyzing the sensitivity of the figure of merit to changes in its parameters.
The complete process of designing the eight alternatives and selecting the optimal is explained in detail in Chapter 2. The methodology for the design process and the background for implementing the figure of merit are described in Chapter 1.
The second part of this work concerning with the design of the pressure and volume control systern for the primary circuit of the 4.S. Savannah nuclear reactor, follows these steps:
1. A statement of the methodology for designing the control system is given. Because the transfer functions of the devices involved in the control process are highly nonlinear, the common linear
approaches (Back, Nyquist, root locus) are discarded. Thus, the only practical method available is to perform an analysis in the time domain in order to find the appropriate control system.
whole system (plant and controller). Therefore the state equations are developed. In order to simulate the pressurizer behavior a
two-control volume approach has been used.
3. The control system chosen is a common PID controller operating on DC (direct current) actuators. The transfer functions for the controller and actuators are also developed.
4. Using the state equations, a computer code which will simulate the whole system behavior is then written.
5. The final step is to adjust the constants of the controller in the computer code, to demonstrate that the response of the system is acceptable for its future tasks.
The criterion for analyzing the acceptability of the control system will be based on the overshoot (quarter-amplitude decay criterion) and rise time of the response. (No unstable behavior will be accepted.)
The state equations and transfer functions are developed in Chapter 3. Chapter 4 is devoted to the design of the simulating code, and the tuning process of the controller. Chapter 5 is the final section, and contains the conclusions obtained from the work and some
recommendations for further work in this field.
REFERENCES
1. Large systems are in control. Richard Merrit. Instrument and control systems. November 1978.
CHAPTER 1 DESIGN METHODOLOGY 1.1 INTRODUCTION
The flow diagram (Figure 1.1.1) shows the stages that have been followed in order to complete the new design for the control system of the N.S. Savannah nuclear propulsion plant. The A and B feedbacks
(Fig. 1.1.1) point out the need of comparing the results obtained at the end of each stage with the boundary conditions previously stated. That is, if the system characteristics do not meet the operational requirements, the specific set of characteristics should be modified until the set meets the requirements.
The three last feedbacks are adjustments to the previous design. For example, if at the end of the plant integration and validation stage, the system does not work, the design process has to be fed back
to the preliminary design stage where the changes that the designer deems appropriate should be made.
The scope of this work will cover up to the preliminary design stage. The preliminary design stage is considered finished when the optimal digital architecture is selected.
1.2 OPERATIONAL REQUIREMENTS
The operational requirements are implicit in the design objective. The design objective is defined as follows: "To replace the automatic control system of the N4.S. Savannah nuclear plant by a modern system which offers better performance and safer operation than the original.
A
B
PLANT INTEGRATION & VALIDATION
The implementation of the new system has to be done with a minimum of changes in the propulsion plant itself, and using the technology
available in the market." The performance of the control system can be judged by the behavior of the plant during transients. The improvement
in safety during operation can be judged in terms of the features added to the control system which help the operator's performance. (This is a characteristic that the original design did not have.)
1.3 SYSTEM CHARACTERISTICS
The characteristics that the system must have in order to meet the stated objective are the following:
1. To supply, automatically, the necessary power to follow the load demand.
2. To assist the operator continuously on the state of the plant,
supplying the necessary information with reliable values. This set of critical parameters displayed to the operator is called the safety state vector (Ref. 1.5).
3. To perform surveillance on-line over the plant, in order to make early detection of malfunctions.
4. To advise the operator, in case of accidents or malfunctions, on probable courses of action to follow.
5. To supply offline data related to the plant, as required by the plant management staff.
1.3.1 COORDINATED CONTROL OF THE LOAD
Basically, this characteristic is similar to that of the original system. Appendix A has a brief description of the N.S. Savannah
nuclear plant that is helpful in the following description. A detailed description of the plant is given in References 1.1 and 1.2.
The ship propulsive plant can be seen as a system of variable load, which must adapt to the different speeds ordered from the bridge. This situation is especially critical when the ship arrives or leaves ports, and when the ship is crossing channels. The variable load has to be matched by the power supply system (the reactor).
Seven loops of dedicated automatic control make up the whole coordinated control system.
- Pressure and volume control in the pressurizer Level control in the steam generators
- Steam pressure and flow control in the secondary circuit - Load following and temperature control in the primary circuit - Propeller speed control (optional, only when manoeuvring) - Pressure and temperature control in the buffer seals system - Temperature and flow control of the primary purification system
1.3.2 SAFETY CONTROL
Safety control is another characteristic retained from the original system. The distinguishing characteristic of the safety control is its absolute independence from the diagnostic and coordinated control
1 .3.3 DATA VALIDATION
Validation of the information coming from the sensors is a new operation required by the control system. Fundamentally, data
validation means to eliminate the failure uncertainty related with the information given by the instruments. This uncertainty is caused by sensor failures, sensor aging or large random noise added to the
readings.
One method used to validate instrument readings is to take 3
signals coming from 3 different sensors (same parameter). The readings are averaged; if one sensor deviates by a specific amount from the average, it is considered to have failed, and the readings coming from that sensor are neglected. The validation process follows with the
remaining sensors. The obtained averages are smoothed by means of a fitting algorithm (for example, the least squares method) applied to a group of previous readings, e.g., the ten readings immediately before the current reading. In this way it becomes a smoother signal showing clearly its trend. Finally, the signal is input to a mathematical
filter (for example the Kalman- filter) with the aim of obtaining a signal which is the best estimation of the variable that can be
obtained. Another consequence of using a mathematical filter is that some variables which are not directly measureable can also be estimated.
The information validated in this way can follow four different paths:
1. It can be displayed directly to the operator
3. It can be used as an input to the diagnosis algorithms 4. It can be stored offline for further analysis
In the new control system design the data coming from the following subsystems will be validated.
1. Nuclear parameters of the reactor 2. Control rods
3. Primary circuit with its pumps 4. Steam generators
5. Main feed pumps 6. Condensate pumps
7. High and low pressure heaters 8. Main condenser
9. Deaerating tank 10. Main turbines
11. Buffer seals system
12. High pressure steam circuit 13. Primary purification system
14. Electrical generation system.
Only the validated data which are meaningful to the operator will be displayed on a top level display. (Other information can be
obtained on demand.) This preselective process is intended to relieve the operator from considering unimportant signals and to show him the significant variables which will help him in making decisions. The preselected set of variables is called the safety vector of the plant
1.3.4 SURVEILLANCE AND DIAGNOSIS
This is one particularly interesting feature added to the control system. This characteristic is defined as the ability to detect a malfunction and to diagnose its cause.
There are several techniques which aim to achieve these
capabilities. To detect malfunctions, the following techniques are -available (Refs. 1.6, 1.7, 1.8, 1.9):
- Spectral densities method - Reactivity balances method - Coherence function method - Linear discriminating function
- Multivariable analysis
To diagnose the detected errors the following techniques are available (Refs. 1.10, 1.5):
- Linear regression analysis - Pattern recognition
- Thermodynamic bal ances - Cause-consequence analysis.
In order to estimate the implicit variables (variables which are not directly measureable), the control algorithm will have a model of the process which is controlled. The reactivity balances and thermodynamic balances method also use a model of plant to perform their diagnosis functions. This makes the two latter techniques suitable to be
employed together with the filtering technique by shearing the common model of the plant.
1.3.5 OPERATOR ADVICE
Once the malfunction or accident is detected and diagnosed, the system must advise the operator on the proper course of action to cope with the emergency. To do so a predicting algorithm has to be added, which functions foreseeing the behavior of the variables if the
situation continues as at the actual moment. There are also several techniques devoted to this advising function. Some of them are (Refs. 1 .3, 1.11):
- Fault treee analysis
- Cause consequence charts.
1.3.6 OFFLINE DATA SUPPLY
This feature is intended to be a help to the reactor plant
managers. All relevant data will be stored offline to be available for consulting.
1.4 PRELIMINARY DESIGN
The goal of the preliminary design stage is to produce several alternatives satisfying the operational requirements and system characteristics. After that the most suitable alternative will be selected by means of a figure of merit. This figure of merit has to reflect the design policy governing the work.
Once the minimum acceptable requirements of safety and performance are satisfied, the process of selecting the best alternative has to be ruled by a figure of merit which penalizes high cost and low
availability. Cost is defined as the total cost of the system
calculated at its Net Present Value (NPV). By availability is meant the percentage of operating time compared with its useful life, measured over the life cycle of the control and surveillance system.
The whole problem shows the characteristics of a decision analysis case. The decision maker has several alternatives to decide, each
alternative has its own cost. Moreover, the success or the failure of each alternative involves a certain amount of benefits or losses.
Finally each alternative has a particular probability of being successful during its time between repairs.
Therefore a figure of merit obtained by applying decision analysis theory is appropriate to this case.
1.4.1 EXPECTED MONETARY VALUE
The Expected Monetary Value (EMY) is a technique used to assess the decision process among several feasible alternatives. Each one of the alternatives satisfies the basic requirements, but they have different costs and different benefits. These benefits are also tied to
different probabilities of achieving them.
The EMV of one alternative with several outcomes is obtained by multiplying each possible cash outcome by its probability of occurrence
and summing these products over all possible outcomes. The decision analysis theory states that a decision maker will be indifferent between two alternatives with the same EMY and he will prefer the
Thus the EMV has the appropriate characteristics to be used as a figure of merit for this study.
The first step to achieve the figure of merit (EMV) is to develop a decision tree which is a graphic display of the alternatives faced by the decision maker. The alternatives that can be controlled by the decision maker are represented by a square, or if they are ruled by chance, and they appear as circles.
Figure 1.4.1 shows a decision tree for a simple but general case. A manager placed at S faces N alternatives e0, el. ... eN and each one of them has a set of further decisions to be taken by the person, for
example, at the point A0 are a01, a01,...a0N al ternatives to choose. The same rules for the A. nodes. The subset of alternatives a i, a 1,a which is a general branch of the decision tree, has a related cost and a related payoff. The payoffs are tied with a finite probability of success of the alternative, in other words, the alternative has a finite probability of obtaining a positive revenue (success) measured in money, and a finite probability of getting a negative revenue also measured in money, or a less desirable revenue than the first one
(failure).
The following nomenclature will be used.
POS(a.) = Payoff of success in alternative a.. POF(aj) = Payoff of failure in alternative a PF(a.) = Probability of failure in alternative a
PS(a. ) = Probability of success in alternativea Fran the theory of decision analysis the EMY of eg branch is
EMV = POS(aij) x PS(a..) + POF(a..) x PF(a..) - C(
i
To make the decision the manager has to choose the higher EMVi, in other words:
selected alternative = max [EMVY] (1.4.2)
The main obstacle to following this procedure is the process of obtaining the probability data. Most architectures have no probability data available because they are not even implemented. To solve this problem, the designed architectures are detailed to a level of standard market components, and those devices do have probability data supplied by the vendors. To reach the probability of failure of the whole
system, the fault tree analysis theory is required.
The component costs come from direct questioning of suppliers. The cost of the software and its probability of failure are special issues which require careful study. These considerations are developed later in the work.
Once the EMV analysis is finished, the best architecture is that with the higher EMV; a consistency check with experience and common sense should, of course, also be performed. The next step is to
perform a sensitivity study to detect critical points in the design and correct them. Also the sensitivity analysis gives a good insight of the variables' impact; finally most of the conclusions and
recommendations come from this sensitivity study.
With all the mentioned steps completed, the preliminary design is achieved.
The next chapter is devoted to the goal of designing the feasible architectures competing as alternatives in the special case of the N.S. Savannah propulsion plant.
REFERENCES
1.1 Nuclear merchant ship rector, final safeguards report. Volume I, Description of the N.S. Savannah. BAW-1164 (Vol. I).
1.2 N.S. Savannah training manual, ship and systems description. Vols. I and II, N.S; Savannah technical staff, Babcock and Wilcox, Tood Shipyards,, Galveston, Texas.
1.3 Use of the cause-consequence charts in practical system analysis. Dan Nielsen. Reliability and fault tree analysis, SIAM, Philadelphia, 1975.
1.4 Decision analysis. Howard Raiffa, Addison-Wesley, July 1970. 1.5 On-line power plant alarm and disturbance analysis system.
EPRI NP-613, Project 891. February 1978.
1.6 The use of signal coherence for anomaly detection in nuclear rectors. R.W. Albrecht. Nuclear Technology, Vol. 14, June 1972.
1.7 An on-line reactor surveillance algorithm based on
multivariate analysis of noise. K.R. Peity, J.C. Robinson. Power plant dynamics control and testing applications
symposium, Knoxville, Tennessee, Sept. 3-5, 1975.
1.8 Experiments on reactivity balance as malfunction detectors for research reactor. Fukutoni, Monta. Journal of nuclear
science and technology. Jan. 1970, pp. 54-56.
-1.9 On the application of pattern recognition methods to reactor malfunction diagnosis. R.C. Gonzales. Power Plant Dynamics Control and Testing Applications Symposium. Knoxville, Tennessee, Sept. 3-5, 1975.
1.10 Study on diagnosis system of nuclear and reactor power plant. 1.11 J. Wakabayashi, K. Yamaguchi, S. Ina, 3. Incondo. The second
power plant dynamics control and testing applications symposium. Knoxville, Tennessee, Sept. 3-5, 1975.
1.12 Fault trees for diagnosis of system fault conditions. Howard E. Lambert and George Yadigaroglu. Nuclear Science and
CHAPTER 2 PRELIMINARY DESIGN 2.1 INTRODUCTION
This chapter develops the expected money value (EMV) technique already explained in Chapter 1. The specific case under design is the N.S. Savannah nuclear propulsion plant (Ref. 2.9); the information concerning that system is unclassified and is accessible in the open literature.
The aim of this thesis is not to seek an actual replacement of the N.S. Savannah nuclear plant control system. Rather, that plant is used as a basis for a general design procedure, permitting the development of comparisons between current designs and proposed alternatives.
Comparative figures are to be developed based on those parameters which are not common for every design alternative. With this constraint the given costs are not the final costs, but are the costs of every distinct parameter which is not common with the other alternatives.
Installation, operation, and maintenance costs are assumed to be similar for every alternative. These costs and those for other external factors such as power sources are not included.
The design analysis procedure starts in Section 2.2 with the
description of functions required for the surveillance, diagnostic, and control system (SDCS). The next step is given in Section 2.3 where the
specific tasks required of each block of the SDCS are explained in detail. The data given in this section form the basis for sizing the possible architectures.
Because the range of possible alternatives to be used in the design is wide, Section 2.4 develops a method to narrow down the spectrum of architectures, ending up with eight feasible alternatives. Section 2.5 explains in detail how these eight different architectures are designed,
and what their components are.
Once the hardware modules are specified, the next step is to develop the fault trees appropriate for each alternative; that procedure is
given in Section 2.6. In Section 2.7 event probabilities are applied to the fault trees already developed. Costs for each alternative are
determined in Section 2.8 and expected money value (EMY) analysis is performed in Section 2.9. Finally, this analysis identifies the architecture with the best figure of merit (ENV), thereby identifying the preferred SDCS preliminary design. This selection is analyzed further in Section 2.10 where sensitivity analyses are performed. The assumptions and uncertainties involved in the design process are tested to determine if they could seriously affect the final decision.
2.2 ORGANIZATION AND DEFINITION OF THE FUNCTIONS
The proposed list of the control system functions is independent of the chosen digital architecture, in other words, all candidate design alternatives must follow a common functional organization. In Reference 2.1 Trchka and Ash propose the following task division for a control system.
a. Control functions - basic control
- advanced control
b. Communications functions - tactical communications - strategic communications.
This task division implies a hierarchical order within it. The following subsections broaden the concept more.
2.2.1 CONTROL FUNCTION
Control functions are related to process variables and the actions needed to keep them at specific levels. These functions are divided into two groups:
- Basic functions or level one functions are those involved in regulating simple variables such as temperature, pressure, etc. - Advanced functions (also called supervisory or level two
functions) are related to variables which require the
calculation of special complex algorithms not used in a routine fashion in the control of basic variables.
2.2.1.1 BASIC CONTROL FUNCTIONS
The seven basic control functions required by the N.S. Savannah propulsion plant are (Ref. 2.9):
- water level control at both steam generators - pressure and volume control at the pressurizer
- temperature control at the primary system tied to a load following capability
- speed control at the propeller shaft (optional)
- temperature and pressure control in the buffer seals system - temperature and flow control in the primary purification system - pressure control in the secondary system.
The original system does not have data validation functions, but the new design will be required to have them. Thus the following subsystems may require validation: - nuclear parameters - control rods - primary circuit - pressurizer - steam generators
- feed water system
- secondary steam system main condenser
- turbines
- buffer seals system
- primary purification system
- electrical generation and distribution.
2.2.1.2 ADVANCED CONTROL FUNCTIONS
The following functions performed by the system are considered to be advanced:
- acquisition and display of safety parameter display (SPDS) (validated plus estimated measurements)
- forecasting the behavior of the variables and advising the operator
- communication control
- continuous checking of hardware failures
Most of these functions are identified as required for on-line plant disturbance analysis (Ref. 2.11) as well as for direct-digital control
2.2.2 COMMUNICATION FUNCTIONS
The communication functions are divided into two groups: tactical and strategic.
2.2.2.1 TACTICAL COMMUNICATIONS
This kind of communication is a short-term value communication, such as the representation at the display of current values of the process variables. Tactical communications occur on-line in the following links:
- sensor-processor communications
- processor-actuator communications
- processor-processor communications
- operator-processor communications.
2.2.2.2 STRATEGIC COMMUNICATIONS
The strategic information has a long-term value and is used in planning new goals for the plant or planning changes in operations. Strategic communications are typically employed offline since they imply background analysis of data previous recorded and observed on line.
They consist only of:
- processor-operator communications.
2.3 FUNCTIONS SPECIFICATIONS
The control functions listed in Section 2.2 are distinguished in such a way that their performance can be sustained with reasonable
independence. Accordingly each can be considered as a unit or block of processing power with its own inputs and outputs. The remainder of this
section is devoted to the specification of the inputs and outputs
a'ppropriate for each block based on information given in Ref. 2.9. Also the number of channels required for each type of signal is enclosed by parentheses. This information is used later when sizing the
architectures. Table B.3 (Appendix B) has- a summary of all the parameters shown in this section.
2.3.1 BASIC CONTROL FUNCTONS
2.3.1.1 WATER LEVEL CONTROL OF STEAM GENERATORS The inputs are
-reference level signal (1) -actual level signal (2) -feed water flow signal (2) -steam flow signal (2).
The outputs are:
-position signal to the feed water valve (2) -hardware failure signal (1).
2.3.1.2 PRESSURE AND VOLUME CONTROL IN THE PRESSURIZER When the system is in the automatic mode, the inputs are
-reference level signal (1) -reference pressure signal (1) -actual level signal (1
-actual pressure signal (1)
-overpressure reference signal (1). The outputs are:
-position signal to spray valves (1) -position signal to make-up valve (1) -position signal to let-down valve (1) -control signal to heaters (5)
-control signal to relief valve (1)
When the system is in the manual mode, the input signals are: -position signal from make-up valve (1)
-position signal from let-down valve (1) -position signal from spray valves (1). The output signals are:
-position signal to make-up valve (1) -position signal to let-down valve (1) -position signal to spray valve (1). In both modes, the inputs are:
-signal for changing spray valve (1)
-signal for transferring auto-manual spray valve (1) -signal transferring auto-manual spray valve (1)
-signal transferring auto-manual let-down valve -control signal to close overpressure valve. The outputs are:
-status mode signal for make-up valve (1) -status mode signal for sprays (1)
-status mode signal for let-down valve (1)
-cut the heaters down signal due to low water level (1) -hardware failure alarm signal (1)
2.3.1.3 LOAD FOLLOWING AND PRIMARY TEMPERATURE CONTROL
When the system is in the automatic mode the inputs are: -stemn flow signal from secondary system (1)
-temperature signal from cold leg (1) -temperature signal from hot leg (1) -neutron flux level signal (1)
-reference temperature signal (1). The outputs are:
-position signal to the control rod in service (1) -position signal from control rods (5)
-position signal from groups of control rods (21) The output signals are:
-position signals to control rods (21)
-position signal to groups of control rods (5) In both modes the inputs are:
-signal to start fast insertion (1) -signal to stop fast insertion (1) The outputs are:
-status mode signal (1)
-signal to start fast insertion (1) -signal to stop fast insertion (1) -hardware failure alarm signal (1)
2.3.1.4 STEAM PRESSURE CONTROL OF SECONDARY SYSTEM The input signals are:
-reference pressure signal (1) -actual pressure signal (1)
-main condenser back pressure signal (1) -command signal to fast closing valves (2). The outputs are:
-control signal to bypass val ve to the main condenser (1) -command signals to fast closing valves (2)
-hardware failure signal (1)
2.3.1.5 SPEED CONTROL OF THE PROPELLER SHAFT
When the system is in the automatic mode, the input is: -reference speed signal (1).
The outputs are:
-position signal to throttle valve (1)
-command signal to ahead throttle valve (1) -command signal to astern throttle valve (1) -command signal to guardian throttle valve (1) The outputs are:
-command signal to ahead throttle valve (1) -command signal to astern throttle valve (1) -command signal to guardian throttle valve (1) In both modes the inputs are:
-command signal to quick-closing valves (2) -command signal auto-manual (1)
-shaft speed signal (1). The outputs are:
-status mode signal (1)
-valve closing signal due to overspeed (2) -valve closing signals by operator command (2) -hardware failure signal (1).
2.3.1.6 TEMPERATURE AND FLOW CONTROL OF THE PRIMARY PURIFICATION SYSTEM When the system is in the automatic mode, the inputs are:
-total flow signal (1)
-reference total flow signal (1) -temperature signal (1)
-reference temperature signal (1). The outputs are:
-position signal to cooling flow control valve (1). If the system is in the manual mode the inputs are: -position signal to flow control valves (3)
-position signal to cooling flow control valve (1). In both modes the input signals are:
-command signal auto-manual for flow control (1)
-command signal auto-manual for temperature signal (1) -open-close signal to 18 circuit valves (18).
The output signals are:
-status mode flow control valves (1)
-status mode cooling flow control valve (1) -command signals to the 18 valves (18)
-hardware failure signal (1).
2.3.1.7 PRESSURE AND TEMPERATURE CONTROL IN THE BUFFER SEALS SYSTEM The inputs when the system is in the automatic mode are:
-pressure signal from the reactor (1) -buffer seal water pressure signal (1)
-reference signal for differential pressure (1)
-reference temperature signal for desurger's tanks (1) -temperature signals from desurger's tanks (3)
-buffer seal water temperature (1)
-discharge pressure signal from booster pumps (1)
-reference pressure signal for discharge pressure of booster pumps (1) The output signals are:
-position signal to bypass valve controlling differential pressure (1) -command signals to booster pumps (3)
-command signals to desurger heaters (3)
-position signal to valve controlling the cooling flow (1 -command signal to emergency booster (1).
If the system is operating under manual mode, the inputs are: -position signal to bypass valve (1)
-position signal to valve controlling the cooling flow (1). The output signals are:
-position signal to bypass valve (1)
-position signal to cooling flow control valve (1) -command signals to charging pumps (3).
In both modes the inputs are: -command signal auto-manual for
-command signal auto-manual for The outputs are:
-status signal manual-auto mode -status signal manual-auto mode -hardware failure -signal.
differential pressure control (1) temperature control (1).
in controlling differential pressure (1) in controlling water temperature (1)
2.3.1 .8 VALIDATION OF NUCLEAR PARAMETERS The inputs to this block are:
-log count rate from start-up channels (3)
-log count rate from intermediate range channels (3) -neutron flux level from power range channels (3).
The outputs of this block are: -period signal (1)
-count rate signal (1)
-neutron flux level signal (1) -hardware failure signal (1).
2.3.1.9 DATA VALIDATION OF PRIMARY SYSTEM
This block does not include the primary pumps. Its inputs are: -starboard reactor outlet temperature (3)
-port reactor outlet tenperature (3)
-discharge temperature port steam generator (3)
-discharge temperature starboard steam generator (3)
-reactor outlet pressure (port) (3) -primary flow port circuit (3)
-primary flow starboard circuit (3) -cooling flow to primary pumps (12)
-status signals cooling water valves (12)
-status signals fran main isolation valves (12). The outputs from the block are:
-primary pressure port circuit (1)
-primary temperatures reactors outlets (2)
-primary tenperature at the suction of primary pumps (2) -average temperature for each circuit (2)
-total average temperature (1)
-status signals for main isolation valves (4)
-low temperature alarm signals primary circuits (2) -high temperature alarm signal at the reactor outlet (1) -low primary flow alarm signals (2)
-high pressure alarm signal (1)
-low reactor pressure alarm signal (1) -hardware failure alarm signal (1).
2.3.1.10 DATA VALIDATION OF CONTROL RODS 1-10 AND GROUPS 1-3
The overwhelming amount of data related to this function make it advisable to divide the block into two parts. This block includes the data coming from control rods 1-10 and the group 1-3. The inputs to this block are
-position signals from the control rods (30) -position signal from the groups (9)
-status signal of the control carrier clutches (30) -status signal of the control rod motors (30)
-status signal of the control rod groups (9)
-temperature signals from the control rod motors (30) The output signals are:
-position signal of the control rods (10) -position signals of the groups (3)
-status signals of the carriers (10)
-status signals of the control rod motors (10)
-status signal of the control rod groups (3) -hardware failure signal (1).
2.3.1.11 DATA VALIDATION OF CONTROL RODS 11-21 AND GROUPS 4-5 The input signals are:
-position signals from control rods (33) -position signals from the groups (6)
-status signals of the control rod carrier clutches (33) -status signals from control rod motors (33)
-status signals fram control rod groups (6). The output signals are:
-position signals fran control rods (ll -position signals of control rod groups (2)
-status signals of the control rod carrier clutches (11) -status signals from control rod motors (1l)
-high temperature at control rod motor alarm signals (11) -status of control rod groups (2)
-hardware failure signal (1).
2.3.1.12 VALIDATION FOR PRESSURIZER DATA The input parameters are:
-water level (3)
-pressurizer pressure (3) -pressurizer temperature (3) -surge line temperature (3)
-status signal of each heater bank (15) -status signal of each spray valve (6) -status signal 'of each relief valve (6). The outputs are:
-water level signal (1) -pressure signal (1) -temperature signal (1)
-surge line temperature signal (1) -status signal for each heater bank (5)
-status signal for each spray valve (2) -status signal of each relief valve (2)
-high temperature alarm signal (1) -high water level alarm signal (1) -low water level alarm signal (1)
-high pressure alarm signal (1) -low pressure alarm signal (1)
-hardware failure signal (1).
2.3.1.13 DATA VALIDATION OF BUFFER SEALS SYSTEM
Because of the high number of signals involved, the validation task is split into two blocks. Buffer seal flows are discussed in Section 2.3.1.21.
The inputs are:
-surge tank level signal (3) -surge tank pressure signal (3) -surge tank temperature signal (3)
-discharge pressure from booster pumps (3)
-pressure signal from charging pumps discharge (3) -temperature signals from desurger tanks (18) -status signals of booster pumps (6)
-status signal of charge pumps (9)
-status signals of desurger tanks' heaters (18) -status signal of bypass valves (6)
-status signal of cooling flow control valve (3) -status signal of surge tank drain valve (3). The output signals are:
-surge tank level signal (1)
-surge tank temperature signal (1) -surge tank pressure signal (1)
-discharge pressure signal of charge pumps (1) -temperature signals from desurger tanks (6) -status signal of booster pumps (2)
-status signal of charge pumps (3)
-status signals of desurger tanks' heater (6) -status signals of bypass valves (2)
-status signal of cooling flow control valve (1) -status signal of cooling flow control valve (1) -high surge tank temperature alarm signal (1) -high surge tank level alarm signal (1)
-low surge tank level alarm signal (1) -high surge tank pressure alarm signal (1)
-low discharge pressure of booster pumps alarm signal (1) -low differential pressure alarm signal (1)
-high cooler's discharge temperature alarm signal (1) -hardware failure alarm signal (1).
2.3.1.14 DATA VALIDATION OF STEAM GENERATORS The input signals are:
-water level for each steam generator (6) -pressure signal for each steam generator (6)
-steam flow signal for each steam generator (6) -feed water flow for each steam generator (6). The outputs are:
-water level for each steam generator (2) -pressure of each steam generator (2) -steam flow of each steam generator (2)
-feed water flow for each steam generator (2)
-high water level alarm for each steam generator (2) -low water level alarm for each steam generator (2) -high pressure alarm for each steam generator (2) -high steam flow alarm for each steam generator (2) -hardware failure alarm (1).
2.3.1.15 DATA VALIDATION OF THE FEED WATER SYSTEM The inputs are:
-main condenser vacuum (3)
-main condenser temperature (3)
-discharge temperature of ejector condenser (3)
-discharge temperature from low-pressure heater drain pump (3) -steam pressure at deaerating tank (3)
-temperature at discharge of deaerating tank (3) -main feed pump discharge pressure (3)
-high pressure -status signal -status signal -status signal -status signal -status signal -status signal -status signal -status signal -status signal -status signal
heater discharge temperature (3) of main circulating pump (3) of sea water intake valve (3) of scoop valve (3)
of circulation water discharge valve (3) of condensate pumps (6)
of drain pumps (6)
of the main feed pumps (6)
of the emergency feed pumps (3) of the main feed valves (6) of the auxiliary feed valves (6) -position signal of main feed valves (6)
-position signal of the auxiliary feed valves (6) -status signal of isolation valves (6)
-oil pressure signal from main feed pump 1 (3) -oil pressure signal fran main feed pump 2 (3). The output signals are:
-main condenser vacuum ()
-main condenser temperature (1)
-main ejector condenser discharge temperature (1) -drain pump discharge pressure (1)
-deaerating tank level (1)
-deaerating tank discharge temperature (1) -main feed pump's discharge temperature (1) -high pressure heater discharge pressure (1) -high pressure -status signal -status signal -status signal -status signal -status signal -status signal -status signal -status signal -status signal
heater discharge temperature (1) for main circulating pump (1) for water intake valve (1)
of circulation water discharge valve (1) of condensate pumps (2)
of drain pumps (2) of main feed pumps (2) of main feed valves (2) of auxiliary feed valves (2) of isolation valves (2) -position signal for main feed valves (2) -position signal for auxiliary feed valves (2) -low deaerating tank level alarm signal (1)
-low oil pressure main feed pump 1 alarm signal (1) -low oil pressure main feed pump 2 alarm signal (1) -hardware failure signal (1).
2.3.1.16 DATA VALIDATION OF TURBINES
-steam pressure to the seals (3)
-steam pressure to ahead nozzle of high-pressure turbine (3) -steam pressure to low-pressure turbine (3)
-steam pressure to astern nozzle of low-pressure turbine (3) -position signal of ahead throttle valve (3)
-position signal of astern throttle valve (3) -status signal of guardian throttle valve (31 -status signal of a~lead throttle valve (3)
-status signal of astern throttle valve (3) -speed signal of propeller shaft (3)
-oil pressure signal from high-pressure turbine (3) -oil pressure signal from low-pressure turbine (3)
-lubricating oil pressure signal from lubricating system (3) -oil temperature signal at lubricating oil tank (3).
The outputs are:
-steam pressure to turbine seals (1)
-steam pressure to high-pressure turbine nozzles (1) -steam pressure to low pressure turbine (1)
-steam pressure to high-pressure turbine astern nozzles (1) -position signal of ahead throttle valve (1)
-position signal of astern throttle valve (1) -status signal to guardian throttle valve (1) -status signal of ahead throttle valve (1) -status signal of astern throttle valve (1) -propeller shaft speed signal (1)
-status signal for main lubricating pump MLP 1 (1) -status signal for MLP 2 (1)
-lubrication system oil pressure (1)
-oil pressure to high pressure turbine (HPT) (1) -oil pressure to low pressure turbine (LPT) (1) -oil temperature at lubrication system (1)
-oil level at lubrication tank alarm signal (1 -low oil pressure HPT alarm signal (1)
-low oil pressure LPT alarm signal (1
-high oil temperature oil system alarm signal (1) -hardware failure signal (1)
2.3.1.17 VALIDATION OF HIGH PRESSURE STEAM SYSTEM The inputs are:
-total steam flow signal (3) -total steam pressure signal (3)
-main condenser back pressure signal (3) -status signal of quick closing valves (6). The output signals are:
-total steam flow signal (1) -total steam pressure signal (1)
-main condenser back pressure signal (1) -status signal of quick closing valves (2) -high steam flow alarm signal (1)