HAL Id: hal-00295664
https://hal.archives-ouvertes.fr/hal-00295664
Submitted on 7 Jun 2005
HAL is a multi-disciplinary open access
archive for the deposit and dissemination of
sci-entific research documents, whether they are
pub-lished or not. The documents may come from
teaching and research institutions in France or
abroad, or from public or private research centers.
L’archive ouverte pluridisciplinaire HAL, est
destinée au dépôt et à la diffusion de documents
scientifiques de niveau recherche, publiés ou non,
émanant des établissements d’enseignement et de
recherche français ou étrangers, des laboratoires
publics ou privés.
with groundbased data
M. Weber, L. N. Lamsal, M. Coldewey-Egbers, K. Bramstedt, J. P. Burrows
To cite this version:
M. Weber, L. N. Lamsal, M. Coldewey-Egbers, K. Bramstedt, J. P. Burrows. Pole-to-pole validation of
GOME WFDOAS total ozone with groundbased data. Atmospheric Chemistry and Physics, European
Geosciences Union, 2005, 5 (5), pp.1341-1355. �hal-00295664�
www.atmos-chem-phys.org/acp/5/1341/ SRef-ID: 1680-7324/acp/2005-5-1341 European Geosciences Union
Chemistry
and Physics
Pole-to-pole validation of GOME WFDOAS total ozone with
groundbased data
M. Weber, L. N. Lamsal, M. Coldewey-Egbers, K. Bramstedt, and J. P. Burrows
Institute of Environmental Physics, University of Bremen, Bremen, Germany
Received: 10 June 2004 – Published in Atmos. Chem. Phys. Discuss.: 29 October 2004 Revised: 1 March 2005 – Accepted: 8 April 2005 – Published: 7 June 2005
Abstract. This paper summarises the validation of GOME
total ozone retrieved using the Weighting Function Differen-tial Optical Absorption Spectroscopy (WFDOAS) algorithm Version 1.0. This algorithm has been described in detail in a companion paper by Coldewey-Egbers et al. (2005). Com-pared to the operational GDP (GOME Data Processor) V3, several improvements to the total ozone retrieval have been introduced that account for the varying ozone dependent con-tribution to rotational Raman scattering, includes a new cloud scheme, and uses the GOME measured effective albedo in the retrieval. In this paper the WFDOAS results have been compared with selected ground-based measurements from the WOUDC (World Ozone and UV Radiation Data Cen-tre) that collects total ozone measurements from a global net-work of stations covering all seasons. From the global vali-dation excellent agreement between WFDOAS and ground data was observed. The agreement lies within ±1%, and very little seasonal variations in the differences are found. In the polar regions and at high solar zenith angles, how-ever, a positive bias varying between 5 and 8% is found near the polar night period. As a function of solar zenith angle as well as of the retrieved total ozone, the WFDOAS dif-ferences to ground polar data, however, show a much weaker dependence as compared to the operational GOME Data Pro-cessor Version 3 of GOME that represents a significant im-provement. Very few stations carry out simultaneous mea-surements by Brewer and Dobson spectrometers over an ex-tended period (three years or more). Simultaneous Brewer and Dobson measurements from Hradec Kralove, Czech Re-public (50.2◦N, 15.8◦E) and Hohenpeissenberg, Germany (47.8◦N, 11.0◦E) covering the period 1996–1999 have been compared with our GOME results. Agreement with Brew-ers are generally better than with the simultaneous Dobson measurements and this may be explained by the neglect of stratospheric (ozone) temperature correction in the standard ozone retrieval from the ground.
Correspondence to: M. Weber
1 Introduction
The GOME (Global Ozone Monitoring Experiment) on board the ERS-2 satellite is the first European experiment dedicated to global ozone measurements (Burrows et al., 1999a). It measures the back scattered radiances from 240– 790 nm in the nadir-viewing geometry. In the relevant region for total ozone retrieval (320–340 nm) the spectral resolution is about 0.17 nm. The maximum scan width in the nadir is 960 km across track on the ground and global coverage is achieved within three days.
For the major parts of the orbits one across track scan se-quence consists of four ground pixel types with 1.5 s integra-tion time each and ground coverage is 320 km by 40 km. The GOME instrument aboard ERS-2 provides regular solar irra-diance and backscatter spectra starting in July 1995. In June 2003 the tape recorder for intermediate data storage failed, so that only data are transmitted to the ground when ERS-2 is in direct contact with ground stations. This limits GOME coverage to the Euro-Atlantic sector stretching from Canada to Russia.
In a companion paper (Coldewey-Egbers et al., 2005) a new total ozone retrieval algorithm has been introduced that uses the Weighting Function Differential Optical Absorption Spectroscopy (WFDOAS) approach. It introduces several new features that have not been used in prior total ozone re-trievals from GOME. The variable ozone dependent contri-bution to the Raman scattering responsible for the filling-in of molecular absorption is properly accounted for. The use of a new cloud scheme in combination with an estimation of effective scene height lead to higher sensitivity to clouds in WFDOAS. In addition, the GOME retrieved scene albedo is included in the retrieval. It was already shown in the com-panion paper that these new features have improved the to-tal ozone retrieved from GOME compared to earlier retrieval versions. This paper describes the validation of WFDOAS with ground based data on a global scale. Comparison of op-erational GDP (GOME Data Processor) V3 to ground data
are also presented to document the significant improvement achieved by WFDOAS over prior data versions.
In Sect. 2 the WFDOAS algorithm is briefly summarised. In Sect. 3 comparisons with simultaneous Brewer and Dob-son measurements at Hohenpeissenberg (47.8◦N, 11.0◦E) and Hradec Kralove (50.2◦N, 15.8◦E) are presented and dis-cussed. This is a very important comparison since many sta-tions have changed or plan to change from regular Dobson to Brewer observations and a good characterisation of satel-lite data with respect to both spectrophotometer types is crit-ical for long-term trend assessment from both satellite and ground time series (Staehelin et al., 2003). The next sec-tion shows comparisons with individual WOUDC stasec-tions (Sect. 4) followed by Sect. 5 summarising the statistical anal-ysis involving all stations selected from low to mid latitudes. Most of the validation statistics at mid latitudes and in trop-ics rely on ground-based data between 1996 and 1999, but for selected stations the validation has been extended up to 2003 (Lauder and Hohenpeissenberg) for demonstrating the long-term stability of the GOME data. In a separate section (Sect. 6) the validation results from comparison with polar station measurements in both hemispheres from 1996 to 2003 are presented.
2 WFDOAS algorithm
In the WFDOAS algorithm the measured atmospheric optical depth (logarithm of the sun-normalised radiances) is approx-imated by a Taylor expansion around a reference intensity plus a low-order polynomial, here a cubic polynomial. The total column information is obtained only from differential trace gas structures as in case of standard DOAS and the polynomial accounts for all broadband contributions from surface albedo and aerosols.
Additional fit parameters are the Ring effect, the under-sampling correction, both treated as effective absorbers sim-ilar to the approach used in standard DOAS, and a (ozone) temperature shift. Slant column fitting is also applied to the minor absorbers NO2and BrO. All fitting parameters are de-rived using a linear least squares minimisation. A large set of reference spectra has been constructed that includes nearly all possible atmospheric conditions. The radiance spectra and weighting functions were calculated as a function of to-tal ozone including profile shape, solar zenith angle, line-of-sight, relative azimuth angle, and bottom-of-atmosphere altitude and albedo using the multiple scattering SCIATRAN radiative transfer model in the pseudo-spherical approxima-tion (Rozanov et al., 1998).
Ozone and temperature profiles are taken from TOMS (To-tal Ozone Mapping Spectrometer) V7 climatology (Welle-meyer et al., 1997) which contains different profile shapes for three latitude belts (low, middle and high) as a function of total ozone column varying from 125–575 DU in mid and high latitudes and from 225–475 DU in low latitudes. This
climatology accounts for seasonal variation and also contains typical ozone hole profiles. Solar zenith angle varies from 15◦–92◦, line-of-sight varies from −34.5◦to +34.5◦, and the
range for the relative azimuth angle is defined by a given combination of both parameters. Altitude of the boundary in the lower atmosphere varies from 0 to 12 km, and surface albedo from 0.02 to 0.98. Both parameters are considered ef-fective parameters that take into account partial cloud cover in the GOME scene.
For ozone retrieval with WFDOAS, calibrated GOME level 1 radiance and solar spectrum from the same day, a-priori values for total ozone (initial guess), effective al-titude, and effective albedo are used. Effective altitude is obtained from FRESCO (Fast Retrieval Scheme for Clouds from the oxygen A-Band, Koelemeijer et al., 2001). Cloud top pressure and cloud fraction are derived from the oxygen transmittance assuming a high reflecting boundary represent-ing the cloud top. Surface albedo is taken from minimum spectral reflectances derived from a five year GOME data record (Koelemeijer et al., 2003). The effective height is the sum of the ground altitude and the retrieved cloud top height weighted by the fractional cloud cover (Coldewey-Egbers et al., 2005).
The Lambertian Equivalent Reflectivity LER (Herman and Celarier, 1997) defines the effective albedo and is obtained from GOME sun-normalised radiances at 377.6 nm, where variations with respect to the Ring effect are small and can be easily corrected for. A look-up-table of radiances as a function of solar zenith angle, line-of-sight, relative az-imuth angle, ground altitude, and surface albedo has been pre-calculated using SCIATRAN and the LER are retrieved by finding the best match between calculated and measured TOA reflectance by inverse search in the multidimensional table.
As described in Coldewey-Egbers et al. (2005), the Raman correction to scattered intensity, the so-called Ring spectra (Solomon et al., 1987; Vountas et al., 1998), were calculated for the same atmospheric conditions including ozone vari-ability as provided by the profile shape climatology as for the weighting functions, they are stored in look-up tables (LUT). The spectral window 326.8–335.0 nm is used in the ozone fitting procedure. After the iteration stops, the ghost vertical column (GVC), that is hidden below the (partial) cloud, is determined from an ozone climatology and then added to the retrieved column to obtain the final total ozone amount. The tropospheric climatological ozone is taken from the monthly and zonal mean TOMS V8 profile climatology (G. Labow, NASA GSFC, personal communication, 2001).
The following settings apply to Version 1.0 WFDOAS:
– spectral fitting window: 326.8–335.0 nm – fitting terms:
• ozone vertical column (weighting function)
• under-sampling correction
• Ring (including ozone filling-in)
• NO2
• BrO
– a-priori ozone profile shape from total ozone dependent
TOMS V7 ozone and temperature climatology (Welle-meyer et al., 1997)
– Burrows et al. (1999b) ozone cross-section shifted by
+0.017 nm
– Fraunhofer fitting (wavelength calibration of daily solar
GOME reference to Kitt Peak Fourier transform solar atlas from Kurucz et al., 1984)
– shift and squeeze of wavelength axis only for nadir
ra-diance spectrum
– cubic polynomial subtracted in the fit
– Lambertian equivalent reflectivities (377.6 nm) taken as
effective albedo of the scene
– cloud-top-height and cloud cover fraction derived
us-ing FRESCO (Koelemeijer et al., 2001). Effective scene height is determined from the cloud-information
– ghost vertical column correction from TOMS V8 zonal
monthly mean climatology
The Fraunhofer fitting and the spectral shift of the ozone cross-section used in the radiative transfer calculation per-mits the limitation of wavelength adjustments (shift and squeeze) to the GOME nadir radiances. This leads to a faster retrieval on the order of five minutes per GOME orbit (about 1500 fits).
3 GOME, Brewer, and Dobson triple comparison
The majority of the total ozone data obtained from the ground are Dobson spectrophotometer measurements. The Dobson spectrophotometer is a double monochromator with the first prism acting as a dispersing element and the sec-ond recombining the wavelength pair on to a photomulti-plier. A chopper allows the alternating measurements of the wavelength pair with a single detector (Dobson, 1931, 1968). For the standard analysis (World Meteorological Organisation – Global Atmospheric Watch (WMO–GAW), the A (305.5/325.5 nm) and D (317.6/339.8 nm) wavelength pairs are used to derive total ozone (Staehelin et al., 2003). At low solar elevation the D-pair can be combined with the C-pair 311.5/332.4 nm. This instrument can be operated in direct-sun and zenith sky viewing geometry. Most reliable results are obtained in direct-sun (AD pairs) with a preci-sion of 1% using a diffuser plate. Accuracy may be lower
due to systematic errors, for instance coming from uncertain-ties in cross-sections (Bass-Paur are used in the standard re-trieval). Under cloudy conditions the error in the zenith-sky results can rise from 3% up to 7% (low clouds) in zenith sky measurements (R. D. Evans, NOAA, personal communica-tion). First measurements with the Dobson instruments have been reported in the twenties (Dobson, 1931) and some of the longest time series are provided by the Dobson instruments (Staehelin, 1998).
Since the early eighties Brewer grating spectrometers have been installed at several stations (Kerr et al., 1985) and at many stations Dobson instruments have been replaced by Brewer spectrophotometers or are planned to be replaced. The Brewer is a modified Ebert type grating spectrometer which can be operated in single (“single Brewer”) or dou-ble monochromator (“doudou-ble Brewer”) configuration. This instrument uses five wavelengths in the spectral range 306.3 and 320.1 nm to form several wavelength pairs for the stan-dard ozone retrieval. Besides ozone, NO2, SO2, and UV-B radiation can be measured. Particularly SO2interferes in the ozone retrieval and has to be corrected for in an urban en-vironment. Particular advantage of the Brewer is its fully automated operation. Both direct-sun and zenith-sky mea-surements are possible.
In the standard retrieval, for both Brewer and Dobson in-struments, the dependence of ozone cross-section on temper-ature is not accounted for unlike in the satellite retrieval. As discussed by Kerr (2002) atmospheric temperature correc-tions can be applied to Brewer retrievals, but most of the sta-tions participating in the ground based network still rely on the standard retrieval. Based upon Bass-Paur ozone cross-section spectra (Bass and Paur, 1985) convolved to match Brewer spectral resolution, he found a 0.7%/10 K tempera-ture dependence for Brewer standard retrieval (Kerr et al., 1988). This number was revised to 0.94%/10 K (Kerr, 2002). Using a different approach based upon Brewer measure-ments at Toronto that included ozone temperature retrieval, he found that the temperature dependence is rather negligible (-0.05% / 10 K) at standard Brewer wavelengths. For Dob-son instruments the temperature dependence is 1.3%/ 10 K (Komhyr et al., 1993). The temperature sensitivities cited here apply mainly to direct-sun measurements.
Only very few stations provide simultaneous measure-ments from Brewer and Dobson spectrometers covering an extended period. Two such stations are Hohenpeissenberg (MOHp), Germany, 47.8◦N, and Hradec Kralove, Czech
Re-public, 50.2◦N. Both stations in collaboration act as the
Re-gional Dobson Calibration Centre for Europe. They have been operating a single Brewer and Dobson throughout the GOME period 1995–2003 and this data set is very valuable in evaluating the new GOME algorithm. Because of different wavelengths used in all three instruments GOME, Brewer, and Dobson results may differ.
For both stations a maximum collocation radius of 160 km between the centre of the GOME pixel and station location
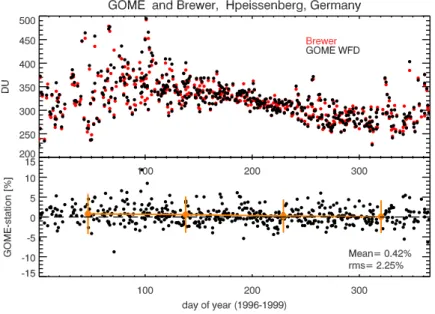
Fig. 1. Top panel: Collocated GOME WFDOAS V1.0 and Brewer total ozone from Hohenpeissenberg. Bottom panel: Differences in percent.
Orange points mark the three month average in the daily differences and bars the 2σ RMS from taking the mean.
Fig. 2. Same as Fig. 1 but shown for collocated WFDOAS and Dobson measurements at Hohenpeissenberg. Only direct-sun measurements
from the Dobson are shown here.
was allowed and measurements had to take place the same day. At a given day only the closest match within that radius was taken. Brewer and Dobson data were provided as daily averages. All Dobson measurements and the Hradec Kralove Brewer are limited to direct sun measurements that are con-sidered most reliable. Hohenpeissenberg Brewer data also contain zenith-sky measurements.
Figure 1 shows the comparison between WFDOAS V1.0 and Hohenpeissenberg Brewer as a function of the day in the year (1996–1999). The top panels shows the annual cycle
of total ozone with maximum ozone in spring and mini-mum in fall, the bottom panel the difference in percent. The WFDOAS results have a bias of 0.4% and a ±0.5% variabil-ity over the annual cycle with slightly higher values in winter (JFM) than in summer/fall.
The comparison of the GOME WFDOAS V1.0 with the Dobson measurements is shown in Fig. 2. The RMS scat-ter in the differences are similar for both Brewer and Dob-son data (2.3%). WFDOAS exhibits a somewhat stronger seasonal cycle of ±1% when compared to Dobson with a
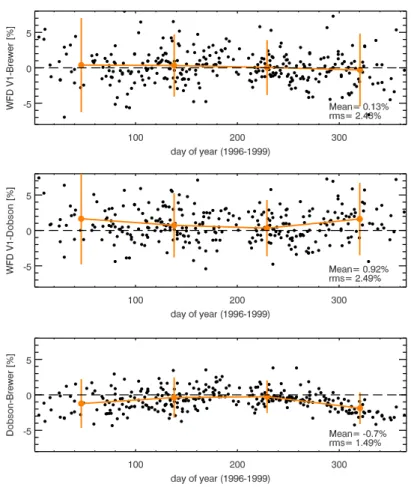
Fig. 3. Annual course of differences between GOME WFDOAS V1, single Brewer, and Dobson data at Hradec Kralove shown for all
possible pair combinations. Top: WFDOAS minus Brewer. Middle: WFDOAS minus Dobson, Bottom: Dobson minus Brewer.
maximum of +1.5% during winter and 0% difference in sum-mer. WFDOAS results appear to exhibit only a very small seasonal variation with respect to the Brewer.
Similar conclusions can be derived from the comparison with the ground-based data from Hradec Kralove. In Fig. 3 different combinations of differences between satellite and ground-based data are shown. The top two panels show dif-ferences of WFDOAS with respect to Brewer and Dobson, while the lowermost panel depicts the differences between average Dobson and Brewer results from the same day.
The WFDOAS bias with respect to Brewer is less than 0.2% and a very weak seasonal cycle of ±0.5% like in the Meteorological Observatory Hohenpeissenberg (MOHp) data is evident here. A somewhat larger seasonal variation is observed if compared to Dobson (±1%). This is in line with the earlier comparison to MOHp. Note that the per-centage scale is finer (smaller) in these plots as compared to the MOHp plots; the RMS scatter of the differences remains about the same.
When comparing data from both stations it is noticeable that the Hradec Kralove Dobson is 0.5% lower on average than the same instrument at MOHp. A new set of calibration settings were introduced in Hradec Kralove in 1997 that were
not adopted at MOHp (U. K¨ohler, DWD, personal communi-cation, see also Staehelin et al., 2003) and that may explain this bias. The change in the calibration settings is also notice-able from the longterm times series in the Dobson-Brewer differences at Hradec Kralove that showed less variability in 1996 and earlier (Staehelin et al., 2003, see their Fig. 5).
A distinct seasonal cycle in the Dobson-Brewer differ-ences is noticed with maxima in winter and minima (near zero) in summer. The major contribution to this seasonal cycle in Dobson-Brewer differences is due to the use of different wavelength pairs in both instruments to retrieve ozone. Particularly, the D pair ratio of the O3cross-sections (317.6/339.8 nm) as used by the Dobson shows the largest temperature dependence of all ratios used in the standard re-trieval by both instruments (Staehelin et al., 2003). How-ever, a fixed temperature (226.9 K) ozone cross-section is ap-plied in the standard retrieval so that stratospheric tempera-ture variation with season is not accounted for. During winter stratospheric temperatures are well below 226.9 K that may explain the larger differences between Dobson and Brewer. The observed differences between GOME and Dobson are therefore consistent with the expectation from the neglect of temperature corrections in the standard retrieval. Due to the
reduced temperature sensitivity of the Brewer wavelengths, it is also not unexpected that GOME WFDOAS agrees bet-ter with Brewer. It should be also noted that the temperature sensitivity is also larger with direct sun than with zenith sky ground-based observations (Vanicek, 1998).
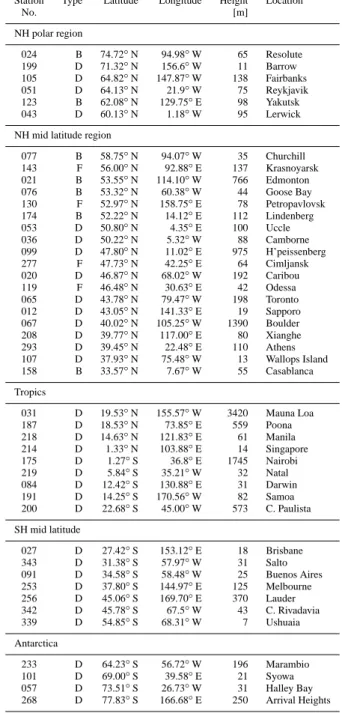
4 Comparison with individual WOUDC stations
Forty-two stations have been selected from the WOUDC data base (Hare and Fioletov, 1998; Fioletov et al., 1999) for global validation of WFDOAS V1.0. The stations are summarised in Table 1. Only those stations have been se-lected that show no larger gaps in time and should not suffer from unreasonable short time jumps and do not have an aver-age bias clearly exceeding 5%. Those excluded were mainly a few Indian stations and Hanoi, Vietnam. Particularly at northern hemispheric mid latitudes, many more stations were available but a fairly even distribution in longitudes were en-sured by selecting 19 stations out of this data set. The major-ity of data are from Dobson measurements. The maximum collocation radius was here set to 300 km (between centre of GOME footprint and station) and only the nearest GOME overpass was used at a given day. The same data set has been used in a recent paper validating the GOME V2.7 data ver-sion (Bramstedt et al., 2003). A change of collocation radius to 300 km rather than 160 km as in the case of the triple com-parison presented earlier does not alter the statistics signifi-cantly. For each climate zone (in 30◦steps) a representative station has been selected and the differences are shown as a function of time from 1996 to 1999 in Fig. 4. The stations are from north to south; Resolute (Canada, 75◦N), Boulder (USA, 40◦N), Singapore (1◦N), Comodoro Rivadavia (Ar-gentina, 46◦S), and Syowa, the Japanese station in Antarc-tica (69◦S). Also shown are the three month mean time series (in orange) in order to visualise possible seasonal variability and a longterm drift in the data. The orange bars indicate the 2σ scatter in the three month mean differences. As with earlier versions of GOME total ozone and as shown later for WFDOAS in Sect. 5, the time series of GOME-station dif-ferences show no significant long-term drift (GDP V3 VAL-REPORT, 2002; Bramstedt et al., 2003).
Both mid latitude stations in both hemispheres as well as the data from Singapore have an average bias over the four year period that is well below ±0.5%. Outside the polar regions no significant seasonal signature in the differences is detectable with the exception of Boulder. The Boulder difference series, however, has a distinct seasonal cycle of up to ±1.5% starting in 1997 that is not apparent in 1996. As discussed in the previous section it could be related to the change in calibration settings that many stations intro-duced to their Dobson spectrophotometers in 1997. The sea-sonal signature in Boulder is quite similar to that observed with Hradec Kralove and MOHp Dobsons with maximum in northern hemispheric winter (January, February, March) and minimum in summer (July, August, September).
Table 1. List of WOUDC station data used in the WFDOAS
vali-dation and division into climate zones. The type of instruments are given in the second column: D stands for Dobson, B for Brewer, and F for the M-124 filter instruments.
Station Type Latitude Longitude Height Location
No. [m] NH polar region 024 B 74.72◦N 94.98◦W 65 Resolute 199 D 71.32◦N 156.6◦W 11 Barrow 105 D 64.82◦N 147.87◦W 138 Fairbanks 051 D 64.13◦N 21.9◦W 75 Reykjavik 123 B 62.08◦N 129.75◦E 98 Yakutsk 043 D 60.13◦N 1.18◦W 95 Lerwick NH mid latitude region
077 B 58.75◦N 94.07◦W 35 Churchill 143 F 56.00◦N 92.88◦E 137 Krasnoyarsk 021 B 53.55◦N 114.10◦W 766 Edmonton 076 B 53.32◦N 60.38◦W 44 Goose Bay 130 F 52.97◦N 158.75◦E 78 Petropavlovsk 174 B 52.22◦N 14.12◦E 112 Lindenberg 053 D 50.80◦N 4.35◦E 100 Uccle 036 D 50.22◦N 5.32◦W 88 Camborne 099 D 47.80◦N 11.02◦E 975 H’peissenberg 277 F 47.73◦N 42.25◦E 64 Cimljansk 020 D 46.87◦N 68.02◦W 192 Caribou 119 F 46.48◦N 30.63◦E 42 Odessa 065 D 43.78◦N 79.47◦W 198 Toronto 012 D 43.05◦N 141.33◦E 19 Sapporo 067 D 40.02◦N 105.25◦W 1390 Boulder 208 D 39.77◦N 117.00◦E 80 Xianghe 293 D 39.45◦N 22.48◦E 110 Athens 107 D 37.93◦N 75.48◦W 13 Wallops Island 158 B 33.57◦N 7.67◦W 55 Casablanca Tropics 031 D 19.53◦N 155.57◦W 3420 Mauna Loa 187 D 18.53◦N 73.85◦E 559 Poona 218 D 14.63◦N 121.83◦E 61 Manila 214 D 1.33◦N 103.88◦E 14 Singapore 175 D 1.27◦S 36.8◦E 1745 Nairobi 219 D 5.84◦S 35.21◦W 32 Natal 084 D 12.42◦S 130.88◦E 31 Darwin 191 D 14.25◦S 170.56◦W 82 Samoa 200 D 22.68◦S 45.00◦W 573 C. Paulista SH mid latitude 027 D 27.42◦S 153.12◦E 18 Brisbane 343 D 31.38◦S 57.97◦W 31 Salto 091 D 34.58◦S 58.48◦W 25 Buenos Aires 253 D 37.80◦S 144.97◦E 125 Melbourne 256 D 45.06◦S 169.70◦E 370 Lauder 342 D 45.78◦S 67.5◦W 43 C. Rivadavia 339 D 54.85◦S 68.31◦W 7 Ushuaia Antarctica 233 D 64.23◦S 56.72◦W 196 Marambio 101 D 69.00◦S 39.58◦E 21 Syowa 057 D 73.51◦S 26.73◦W 31 Halley Bay 268 D 77.83◦S 166.68◦E 250 Arrival Heights
In Comodoro Rivadavia, Argentina, a seasonal signature is not clearly discernible, except for occasional larger devia-tions that are not repeated in other years. This is most likely related to interruptions in measurements in southern hemi-spheric summer (January, February, March), so that only few data contributed to the three month average as in 1997 and 1999.
Fig. 4. Daily differences between collocated GOME WFDOAS
V1.0 and various ground stations distributed from north to south between 1996 and 1999. Orange points mark three month averages and error bars the 2σ RMS in the observed differences. All station data are from Dobsons except for Resolute that are Brewer mea-surements.
The two stations in the south and north polar regions, Syowa and Resolute, show a distinct annual cycle in the GOME-ground station differences. Average differences in spring/summer are quite low (below 1%) but can increase to +5% close to the polar night terminator. It is noted that this
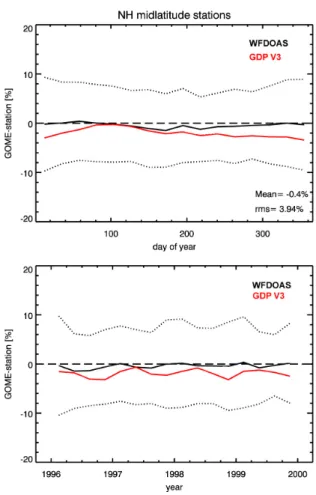
Fig. 5. Average of WFDOAS V1.0 and GDP V3.0 differences to
nineteen NH mid latitude WOUDC stations: 1996–1999. Top: an-nual course, bottom: all years. The dotted lines show the 2σ RMS in the WFDOAS differences to the ground data from averaging.
pattern is symmetric about the polar night period, although total ozone under ozone hole conditions in spring is much lower than in fall. The large gradients in ozone observed near the polar vortex edge is responsible for the larger scatter in the southern hemispheric (SH) spring, because both GOME and surface instrument do not look at the same airmass. In fall 1997 the scatter in the differences to the Resolute Brewer data is quite large as expressed by the huge vertical bar in Fig. 4. This is due to some outliers and due to the fact that close to the polar night period only few data are contributing to the three month mean. In Sect. 6 the validation in polar regions and under ozone hole condition is discussed in more detail.
5 Validation at low to middle latitudes
For a statistical analysis WFDOAS total ozone has been com-pared with ground based data from 42 stations as listed in Table 1. The comparisons have been separated according to climate zones: high latitudes (60◦–90◦) and mid latitudes
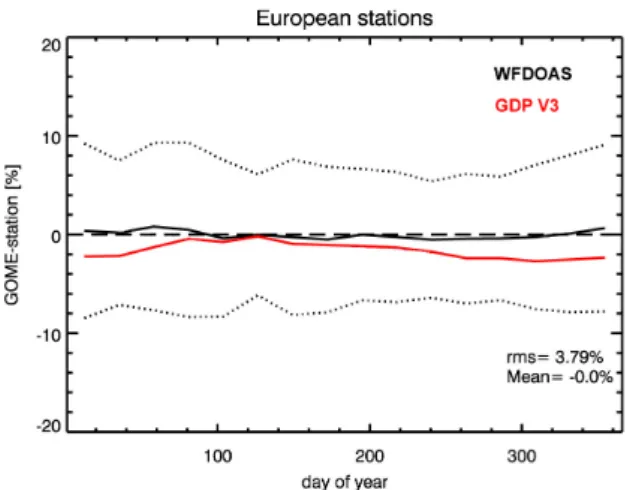
Fig. 6. Same as Fig. 5, but for eight European stations (Arosa,
Lindenberg, Potsdam, Hohenpeissenberg, Hradec Kralove, Uccle, Camborne, and Oslo), see text for further details.
Fig. 7. Annual course of differences between GOME and ground
stations for tropics (top) and SH mid latitudes (bottom). The dotted lines show the 2σ RMS in the WFDOAS differences to the ground data from averaging.
(30◦–60◦) in each hemisphere and tropics (25◦S–25◦N)
ac-cording to the grouping of stations as shown in Table 1 . Fig-ures 5 to 7 show the summary of the comparisons between WFDOAS and ground based data in each climate zone ex-cept for the high latitude results that are presented in the next section. The dotted lines in those figures show the 2σ spread from averaging over all differences between collo-cated satellite and ground data. For documenting the im-provement achieved with WFDOAS, the same comparison has been made with the operational GOME Data Processor Version 3.0 (short: GDP V3) that are shown in red in Figs. 5– 7. A detailed description of GDP V3 can be found in GDP V3 VALREPORT, 2002.
A plot summarising the comparison between different satellite analyses, WFDOAS and GDP V3 with nineteen mid latitude stations is shown in Fig. 5. The average annual bias is −0.4% for WFDOAS. A small seasonal variation of about ±0.5% can be seen, with maximum differences in win-ter and minimum difference in summer statistically confirm-ing the results from the individual station comparison. The GDP V3.0 shows an annual variability of ±1% with a bias of around −1% with respect to the station data. However, the maximum and minimum in GDP V3 differences are shifted towards spring and fall, respectively.
By looking at individual mid latitude stations, it can be noted that for some stations the seasonal variation in the differences is absent (e.g. Dobsons in Uccle, Belgium, and Lauder, New Zealand), while for other stations a weak sea-sonal cycle is observed with WFDOAS. In order to see the ef-fect on the statistics by selecting different stations, the com-parison has been limited to eight European stations (Arosa, Lindenberg, Potsdam, Hohenpeissenberg, Hradec Kralove, Uccle, Camborne, and Oslo) and Russian stations that mainly operate the so-called M-124 filter spectrometers to measure ozone (Gushchin et al., 1985) have been excluded. Almost no seasonal variation is observed in the WFDOAS mean dif-ferences to the European stations, while the seasonal cycle in the GDP V3 differences still remains as shown in Fig. 6.
The annual course of the GOME differences to the ground-based data for tropical and SH mid latitude stations (see Ta-ble 1) is shown in Fig. 7. The SH mid latitude differences show a similar pattern (now shifted by six months) as ob-served in the northern hemisphere (NH, see Fig. 5). The WFDOAS differences like in the NH mid latitudes show no significant annual cycle. The mean bias in low and mid lati-tudes is less than 0.5% for WFDOAS V1.0.
The insignificant seasonal variation observed in the WF-DOAS differences at mid latitudes is in contrast to the con-clusion from the triple intercomparison involving collocated Brewer and Dobson data, where a distinct seasonal cycle sig-nature is expected from the lack of ozone temperature correc-tion in the ground based data retrieval. One should keep in mind that other factors influence Dobson results such as stray light errors (reduces retrieved total ozone) and environmen-tal settings (affecting stray light levels) that may differ from
station to station. As pointed out earlier, the ozone tempera-ture correction is more important in direct sun measurements than for zenith sky measurements that are also included in the WOUDC data. An important result from this validation is, nevertheless, that the seasonal dependence in the GOME-ground based data differences is quite small and gets smeared out when averaged over many stations. This is a large im-provement compared to GDP V3 that shows a distinct sea-sonal signatures at mid latitudes that does not average out. Both retrievals, WFDOAS and GDP V3, use the TOMS V7 profile shape climatology (GDP V3 uses the climatology for airmass factor calculation). The big improvement in WF-DOAS retrieval is that the TOMS V7 ozone profile shape climatology is also used to determine the varying ozone de-pendent contribution to the rotational Raman correction that is neglected in GDP V3.
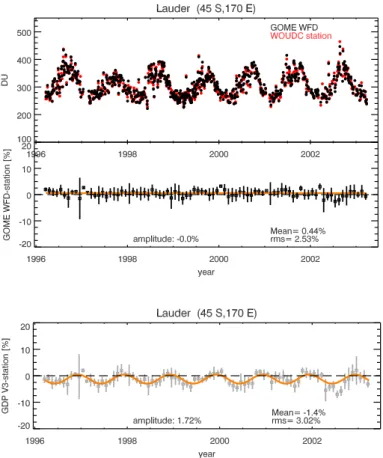
A long-term comparison has been carried out with Dob-son data from Lauder, 45◦S, and Brewer data from
Hohen-peissenberg, 48◦N. The WFDOAS time series along with
the Lauder Dobson data is shown in Fig. 8. The Hohenpeis-senberg time series has been shown in Fig. 7 of Coldewey-Egbers et al. (2005). All Lauder measurements from zenith-sky and direct-sun ground based data have been included. Apart from a bias of +0.4% for the entire time period (iden-tical to the bias observed in Hohenpeissenberg), no signifi-cant seasonal variation, like in the comparison with Hohen-peissenberg, is seen in the comparison with WFDOAS V1.0. Lower stratospheric temperature seasonal variation is quite small in this region (below 5 K over the course of the year), such that the lack of seasonal variation in the differences be-tween WFDOAS and Lauder Dobson is not surprising. The bottom panel in Fig. 8 shows the same comparison but with GDP V3.0, where a distinct seasonal cycle is evident for all years. The amplitude from fitting a cosine curve (solid or-ange line) is 1.7%. For Hohenpeissenberg the amplitude was found to be 1.4% for GDP V3 (not shown). From this limited comparison (two stations) up to 2003, it can be concluded that the DOAS retrieval in low to middle latitudes does not suffer from the optical degradation that have altered the ra-diometric accuracy of the GOME instrument particularly in later years (Tanzi et al., 2001).
6 Validation in polar regions
Six stations in the north polar region and four stations on Antarctica have been selected for validating polar ozone from GOME (see Table 1). Figure 9 shows the results from the southern hemispheric polar region. The southern polar data show on average a difference of four percent with respect to ground-based data near the polar night period, in some years it can reach on average 10% like in Antarctic spring 1998. This comparison is difficult since solar elevation angles are low and large ozone gradients near the polar vortex edge, that delineate a cold region where the ozone hole resides, lead to
Fig. 8. Longterm comparison between GOME and Lauder
Dob-son from 1996 to 2003. Top: daily collocated GOME WFDOAS (black) and Dobson data (red) time series. Middle panel: monthly mean differences between WFDOAS and Lauder Dobson in per-cent. Bottom: same as middle panel, but for GOME GDP V3. Ver-tical bars indicate the 1σ RMS of the daily differences. Orange lines in bottom two panels show the cosine fit to the data to deter-mine the amplitude of the seasonal variation. The amplitude of the cosine term is 0% and 1.7% for GOME WFDOAS and GDP V3.0, respectively.
huge scatter in the RMS which can reach a 2σ value of 40% depending on individual stations. Over the annual cycle the average bias is about 0.5%. Comparing these results with GDP V3, one notes that the behaviour near the polar night period is similar for both data versions and, on first sight an improvement by WFDOAS seems only marginal. It is evi-dent that the RMS scatter in the differences is smaller with WFDOAS during austral summer than with GDP V3 and the bias to the station data is lower. Overall, the GDP V3 data seem to be lower than WFDOAS by about 2% throughout the year. From this view point an improvement with WFDOAS is evident, but the larger discrepancy to ground data near the polar night region (and at high solar zenith angle) remains.
Similar arguments apply to NH polar stations but not as extreme as in the SH (see Fig. 10) due to the absence of the ozone hole regularly observed in the SH. The seasonal
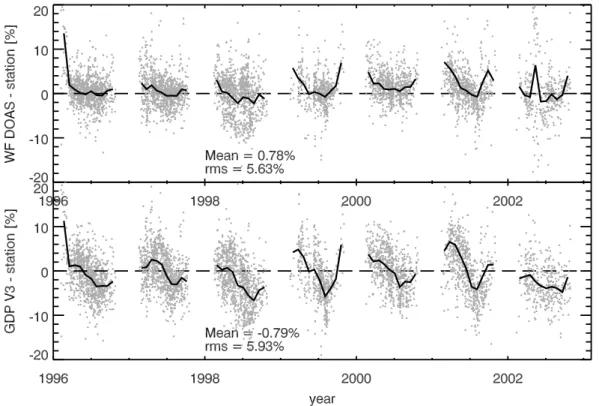
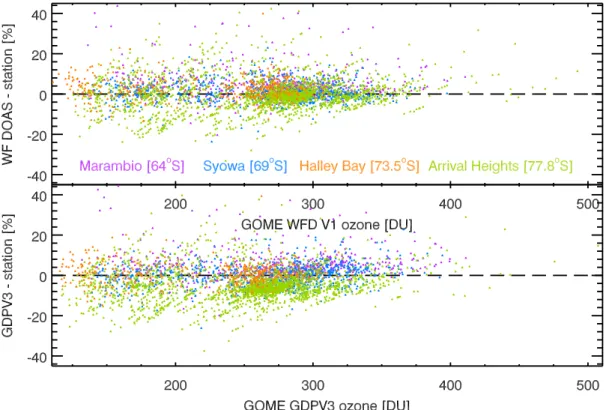
Fig. 9. WFDOAS minus Dobson (top) and GDP V3 minus Dobson (bottom) from 1996 to 2003 for four SH polar stations: Arrival Heights
(78◦S), Halley Bay (74◦S), Syowa (69◦S), and Marambio (64◦S). Individual collocations (grey dots) as well as monthly mean differences (solid line) are shown.
Fig. 10. WFDOAS minus Dobson (top) and GDP V3 minus Dobson (bottom) from 1996 to 2003 for NH polar stations as listed in Table 1.
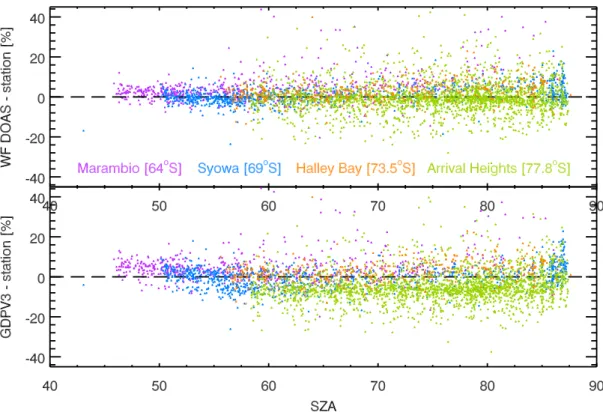
Fig. 11. WFDOAS V1 minus Dobson (top) and GDP V3 minus Dobson (bottom) as a function of solar zenith angle for four SH polar
stations: Arrival Heights (78◦S), Halley Bay (74◦S), Syowa (69◦S), and Marambio (64◦S).
variation in the differences for both WFDOAS and GDP V3 is very similar to the one observed at mid latitudes with minium differences in summer and maximum differences in winter, but enlarged. Like at mid latitudes the minimum dif-ferences are shifted from summer to fall for GDP V3. It is known that the NH polar ozone shows large interannual vari-ability inside and outside of the polar vortex (see for instance Weber et al., 2002, 2003). The Arctic winter 1997/1998, 1998/1999, 2000/2001 to 2002/03 have been rather warm stratospheric winters with high ozone well beyond 500 DU, while 1996/1997 and 1999/2000 were cold stratospheric Arc-tic winters with lower winter total ozone levels (Weber et al., 2002). The differences to the station data during Arctic win-ter/spring are highly variable, exceeding +10% on average in early 1996 and can be as low as +2% in 1997. A clear trend with time is not observed. It appears that at low solar ele-vation and higher total ozone the winter differences are on average closer to 5% (1998/1999 and 2000/2001) and other-wise in most cases closer to +2 to +3%.
At low solar elevation Dobson instruments suffer from for-ward scattered stray light and therefore may underestimate the total column. For UV observing satellites like GOME the intensity of the observed scattered light and the signal-to-noise decreases and, therefore, satellite retrieval errors also get larger. Since GOME generally uses larger wavelengths in its retrieval compared to Brewer/Dobsons, the intensity
reduction may be lower than for the ground instruments. It is, however, generally difficult for UV/vis instruments to op-erate in near twilight condition. To reach a better understand-ing of differences between satellite (TOMS) and ground-based instruments at high-latitudes a measurement campaign involving two Dobson and three Brewer instruments, includ-ing sinclud-ingle and double Brewers, were carried out in Fairbanks, Alaska, in March/April 2001. Against the travel world stan-dard (Instrument D83, AD pair, direct sun), all Brewer in-struments as well as integrated sonde profiles have shown a percent difference of +3 to +4% with respect to the world standard (Staehelin et al., 2003) after careful straylight cor-rections and ozone temperature corcor-rections applied. The Fairbanks direct-sun Dobson results showed a difference of
−1.3% using the AD pair and, when using proper ozone tem-perature and the CD Pair, a +3.5% difference with respect to D83 was found. From Fig. 10 it can be seen that in March 2001 the average difference between WFDOAS for all Arctic stations was on the order of +2 to +4%, that is comparable to the differences observed in the modified Brewer/Dobson retrievals during the TOMS3-F campaign. From a tempera-ture sensitivity of 1.3% /10 K in the Dobson retrieval and a seasonal variation of about 30 K in the lower stratosphere a 3–4% differences could be expected between WFDOAS and Dobsons and also, possibly, between Brewers and Dobsons at high latitudes. This suggests the missing ozone temperature
Fig. 12. Same as Fig. 11 but as a function of retrieved total ozone.
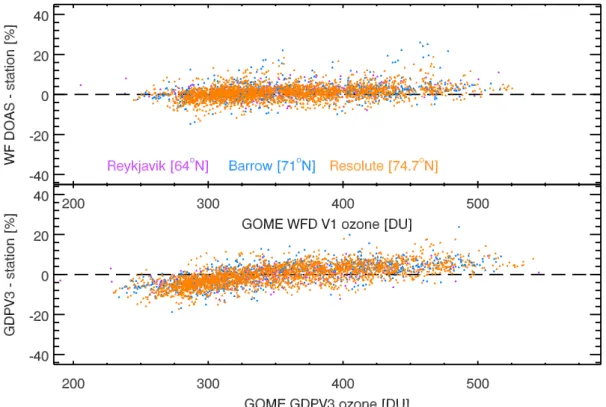
Fig. 13. WFDOAS V1 minus ground based data (top) and GDP V3 – ground based data (bottom) as a function of solar zenith angle for three
Fig. 14. Same as Fig. 13 but as a function of retrieved total ozone.
correction and stray light issues as a possible explanation for the observed positive bias in WFDOAS differences un-der low solar elevation condition.
Of particular interest in total ozone monitoring is the de-velopment of the Antarctic ozone hole from year-to-year. In the WOUDC statistics four stations from Antarctica have been included for the SH polar stations. It was found that close to the polar night period GOME WFDOAS V1 as well as GDP V3.0 can be up to 10% higher on average than ground based Dobson. However the variability of the differ-ences is also very large, so that the differdiffer-ences observed may be also to a large extent depend on the station. In Figs. 11 and 12 the results from GOME WFDOAS and Dobson com-parison for each of the four Antarctic stations, Syowa, Halley Bay, Marambio, and Arrival Heights, are shown as a function of solar zenith angle and GOME total ozone, respectively. Also depicted are the results for GDP V3 in the bottom pan-els of each figure. Compared to GDP V3 the WFDOAS differences show a fairly weak dependence to solar zenith angle and total ozone. Looking at the solar zenith angle and total ozone dependence in the NH polar regions as shown in Figs. 13 and 14, respectively, the improvement achieved by WFDOAS becomes even more striking. The reduced depen-dence on total ozone and solar zenith angle also confirms the observation of weaker seasonal variation in WFDOAS dif-ferences to ground data. Nevertheless, both WFDOAS and GDP V3 retrievals are higher than ground based data near the
polar night period that may only to some extent be explained by the problems associated with the standard retrieval ap-plied to ground data.
7 Conclusions
The new WFDOAS algorithm for GOME has been exten-sively compared with globally distributed ground-based data, predominantly Dobson spectrophotometer data. In mid lat-itudes it agrees on average to within half a percent with WOUDC data. A small negligible seasonal variation of less than ±0.5% is noted, with a maximum in the differences in fall/winter and a minimum in spring/summer. At sev-eral mid latitude stations, e.g. Lauder and Uccle, no sea-sonal variation is observed. GDP V3 clearly shows a larger and persistent annual variation (±1%) but the maximum in the differences is shifted towards spring (minimum in fall). No major changes are observed with the new WFDOAS in the tropics, a constant bias between WFDOAS (below +1%) and GDP (about −1%) with respect to the ground-based data throughout all years are observed.
In polar regions (both hemispheres) larger positive differ-ences are observed with WFDOAS close to the polar night period (on average about +4%). If comparisons are made near the polar vortex edge errors can get quite large (up to 40% above Antarctica). If both GOME and the station are well inside the ozone hole it appears that the differences are
below 5%. Compared to GDP V3, WFDOAS shows large improvements as evident in weaker solar zenith angle and total ozone dependence in the differences to the ground data at high latitudes.
The comparison with Brewer instruments at Hradec Kralove and Hohenpeissenberg has demonstrated excellent agreement with WFDOAS. The maximum in the differences between GOME and Dobson and to a lesser extent with Brewer is related to the fixed ozone temperature used in the standard retrieval of ground based instruments. Brewer-Dobson differences can be as high as ±2% (generally on the order of 0.5%). This variability gets maximum at high lat-itudes due to lower solar elevation and the enhanced stray-light problem associated with it. The Fairbanks campaign TOMS3-F, where differences of up to 3–4% between ozone temperature corrected Brewer and standard Dobson were measured in late winter, seems to support this conclusion (Staehelin et al., 2003). The closer agreement of WFDOAS with Brewer than simultaneous Dobson data confirms that the temperature shift weighting function appears appropriate to account for the ozone temperature variation.
Overall it can be concluded that the accuracy of the WF-DOAS V1.0 results are now within the uncertainty of the ground-based measurements that make GOME data very at-tractive for evaluating ground-based network data. The very good agreement with ground based instruments are proof that several issues that has been newly introduced in WF-DOAS V1.0 have significantly improved total ozone retrieval and they are listed here in order of importance: 1) vari-able ozone filling-in as part of the Ring effect, 2) the in-troduction of an effective scene height from cloud informa-tion and 3) derivainforma-tion of an effective scene albedo from the GOME spectral measurements. The strong dependence in the GOME-Dobson differences in prior versions (Bramstedt et al., 2003) on cloud cover has been significantly improved (not shown here). These changes are, however, not specific to the type of algorithm that has been used here but can be potentially applied to other retrieval schemes as well. The WFDOAS theoretical approach by expanding the differen-tial optical depth equation in a Taylor series is a straight for-ward formulation of the DOAS inversion and is applicable in a more general way than the standard DOAS approach that uses airmass factors to correct for the slant path geom-etry like in earlier GOME versions. This algorithm can be also applied to other UV/vis backscatter satellite instruments such as SCIAMACHY (Bovensmann et al., 1999) and OMI (Laan et al., 2000) that measure in continuous scan mode. WFDOAS V1 daily gridded total ozone data can be obtained from www.iup.physik.uni-bremen.de/gome/wfdoas.
Acknowledgements. We thank U. K¨ohler and H. Claude, MO
Hohenpeissenberg, for providing us with their station data (Brewer and Dobson) and for their insights into the ground-based measure-ments. We also thank B. Evans, NOAA, for providing us data from Lauder and he kindly informed us on the accuracy of the Dobson spectrophotometers. K. Vanicek, Czech Hydrometeorological
Institute, kindly provided Brewer and Dobson data from Hradec Kralove. We also thank him for giving us valuable information on the ground based data. This project was supported in parts by European Space Agency contract 16402/02/I-LG, BMBF grant 7ATF42 (GOMSTRAT) within the AFO2000 national research programme, and EU project EVK2-CT-2001-00133 (CANDIDOZ).
Edited by: T. Koop
References
Bass, A. M. and Paur, R. J.: The ultraviolet cross-sections of ozone, I, The measurements, in: Atmospheric Ozone, Proc. Quadr. Ozone Symp., Halkidiki, Greece, 1984, edited by: Zerefos, C. and Ghazi, A., Reidel, Dordrecht, 606–610, 1985.
Bovensmann, H., Burrows, J. P., Buchwitz, M., Frerick, J., Noel, S., Rozanov, V. V., Chance, K. V., and Goede, A. H. P.: SCIA-MACHY – Mission Objectives and Measurement Modes, J. At-mos. Sci., 56, 125–150, 1999.
Bramstedt, K., Gleason, J., Loyola, D., Thomas, W., Bracher, A., Weber, M., and Burrows, J. P.: Comparison of total ozone from the satellite instruments GOME and TOMS with measurements from the Dobson network 1996–2000, Atmos. Chem. Phys., 3, 1409–1419, 2003,
SRef-ID: 1680-7324/acp/2003-3-1409.
Burrows, J. P., Weber, M., Buchwitz, M., Rozanov, V. V., Ladst¨adter-Weissenmayer, A., Richter, A., de Beek, R., Hoogen, R., Bramstedt, K., Eichmann, K.-U., Eisinger, M., and Perner, D.: The Global Ozone Monitoring Experiment (GOME): Mis-sion Concept and First Scientific Results, J. Atmos. Sci., 56, 151–175, 1999a.
Burrows, J. P., Richter, A., Dehn, A., Deters, B., Himmelmann, S., Voigt, S., and Orphal, J.: Atmospheric Remote-Sensing Refer-ence Data from GOME: Part 2, Temperature-dependent absorp-tion Cross Secabsorp-tions of O3in the 231–794 nm range, J. Quant.
Spectrosc. Rad. Transfer, 61, 509–517, 1999b.
Coldewey-Egbers, M., Weber, M., Lamsal, L. N., de Beek, R., Buchwitz, M., and Burrows, J. P.: Total ozone retrieval from GOME UV spectral data using the weighting function DOAS approach, Atmos. Chem. Phys., 5, 5015–5025, 2005.
Dobson, G. M. B.: A photo-electric spectrometer for measuring the amount of atmospheric ozone, Proc. Phys. Soc., 324–339, 1931. Dobson, G. M. B.: Forty year’s research on atmospheric ozone at
Oxford: a history, Appl. Opt., 7, 387–405, 1968.
Fioletov, V., Kerr, J., Hare, E., Labow, G., and McPeters, R.: An assessment of the world ground-based total ozone network per-formance from the comparison with satellite data, J. Geophys. Res., 104, 1737–1748, doi:10.1029/1998JD100046, 1999. GDP V3 VALREPORT, 2002: ERS-2 GOME GDP 3.0
Imple-mentation and Delta Validation Report, Technical Note ERSE-DTEX-EOAD-TN-02-0006, Issue 1.0, edited by: Lambert, J.-C., November 2002, see also: http://earth.esrin.esa.it/pub/ESA DOC/GOME/gdp3/gdp3.htm, 2002.
Gushchin, G. P., Sokolenko, S. A., and Kovalyov, V. A.: Total-ozone measuring instruments used at the USSR station network, in Atmospheric Ozone, Proc. Quadr. Ozone Symp., Halkidiki, Greece, 1984, edited by: Zerefos, C. and Ghazi, A., Reidel, Dor-drecht, 543–546, 1985.
Hare, E. and Fioletov, V.: An examination of the total ozone data in the World Ozone and Ultraviolet Radiation Data Center, in: Atmospheric Ozone, Proc. Quadr. Ozone Symp. L’Aquila, Italy, 1996, edited by: Bojkov, R. and Visconti, G., Edigrafital S.p.A.-S.Atto (TE), 45–48, 1998.
Herman, J. R. and Celarier, E. A.: Earth surface reflectivity clima-tology at 340–380 nm from TOMS data, J. Geophys. Res., 102, 28 003–28 011, 1997.
Kerr, J. B., McElroy, C. T., Wardle, D. I., Olafson, R. A., and Evans, W. P. J.: The automated Brewer Spectrophotometer, in: Atmo-spheric Ozone, Proc. Quadr. Ozone Symp. Halkidiki, Greece, 1984, edited by: Zerefos, C. and Ghazi, A., Reidel, Dordrecht, 543–546, 1985.
Kerr, J. B., Asbridge, I. A., and Evans, W. F. J.: Intercomparison of total ozone measured by the Brewer and Dobson spectropho-tometers at Toronto, J. Geophys. Res., 93, 11 129–11 140, 1988. Kerr, J., New methodology for deriving total ozone and other atmospheric variables from Brewer spectrometer spec-trophotometer direct sun spectra, J. Geophys. Res., 107, doi:10.1029/2001JD001227, 2002.
Koelemeijer, R. B. A., Stammes, P., Hovenier, J. W., and de Haan, J. F.: A fast method for retrieval of cloud parameters using oxy-gen A-band measurements from the Global Ozone Monitoring Experiment, J. Geophys. Res., 106, 3475–3496, 2001.
Koelemeijer, R. B. A., de Haan, J. F., and Stammes, P.: A database of spectral surface reflectivity in the range 335–772 nm derived from 5.5 years of GOME observations, J. Geophys. Res., 108, doi:10.1029/2002JD002429, 2003.
Komhyr, W. D., Mateer, C. L., and Hudson, R. D.: Effective Bass-Paur 1985 ozone absorption coefficients for use with Dobson ozone spectrophotometers, J. Geophys. Res., 98, 20 451–20 465, 1993.
Kurucz, R. L., Furenlid, I., Brault, J., and Testerman, L.: Solar flux atlas from 296 nm to 1300 nm, National Solar Observatory, Sunspot, New Mexico, 1984.
Laan, E., de Vries, J., Kruizinga, B., Visser, H., Levelt, P., van den Oord, G. H. J., Maelkki, A., Leppelmeier, G., and Hilsenrath, E.: Ozone monitoring with the OMI instrument, in: Proc. of the SPIE’s 45th Annual Meeting – The International Symposium on Optical Science and Technology, Vol. 4132-41, 334–343, 2000.
Rozanov, V. V., Kurosu, T., and Burrows, J. P.: Retrieval of Atmo-spheric Constituents in the UV/visible: A new Analytical Ap-proach to Calculating Weighting Functions, J. Quant. Spectrosc. Rad. Transfer, 60, 277–299, 1998.
Solomon, S., Schmeltekopf, A. L., and Sanders, R. W.: On the in-terpretation of zenith-sky absorption measurements, J. Geophys. Res., 92, 8311–8319, 1987.
Staehelin, J.: Total ozone series of Arosa (Switzerland), Homoge-nization and data comparison, J. Geophys. Res., 103, 5827–5841, 1998.
Staehelin, J., Kerr, J., Evans, R., and Vanicek, K.: Comparison of to-tal ozone measurements of Dobson and Brewer spectrophotome-ters and recommended transfer functions, Tech. Rep., WMO, World Meteorological Organization Global Atmosphere Watch (WMO-GAW) Report 149, 2003.
Tanzi, C. P., Snel, R., Hasekamp, O., and Aben, I.: Degradation of UV earth albedo observations by GOME, in ERS-ENVISAT Symposium, Gothenburg, 16–20 October 2000, ESA Special Publication SP-461 (CD-ROM), 2001.
Vanicek, K.: Differences between Dobson and Brewer observations of total ozone at Hradec-Kralove, in Atmospheric Ozone, Proc. Quadr. Ozone Symp., L’Aquila, 1996, ed. by Bojkov, R., and Visconti, G., 81–84, Edigrafital S.p.A.-S.Atto (TE), 1998. Vountas, M., Rozanov, V. V., and Burrows, J. P.: Ring Effect:
Im-pact of Rotational Raman Scattering on Radiative Transfer in Earth’s Atmosphere, J. Quant. Spectrosc. Radiat. Transfer, 60, 943–961, 1998.
Weber, M., Eichmann, K.-U., Wittrock, F., Bramstedt, K., Hild, L., Richter, A., Burrows, J. P., and M¨uller, R.: The cold Arctic win-ter 1995/96 as observed by the Global Ozone Monitoring Ex-periment GOME and HALOE: Tropospheric wave activity and chemical ozone loss, Quart. J. Roy. Meteorol. Soc., 1293–1319, 2002.
Weber, M., Dhomse, S., Wittrock, F., Richter, A., Sinnhu-ber, B.-M., and Burrows, J. P.: Dynamical Control of NH and SH Winter/Spring Total Ozone from GOME Observa-tions in 1995–2002, Geophys. Res. Lett., 30, 1853–1854, doi:10.1029/2002GL016799, 2003.
Wellemeyer, C. G., Taylor, S. L., Seftor, C. J., McPeters, R. D., and Bhartia, P. K.: A correction for the Total Ozone Mapping Spectrometer profile shape errors at high latitude, J. Geophys. Res., 102, 9029–9038, 1997.