HAL Id: insu-01240107
https://hal-insu.archives-ouvertes.fr/insu-01240107
Submitted on 31 Aug 2020
HAL is a multi-disciplinary open access
archive for the deposit and dissemination of
sci-entific research documents, whether they are
pub-lished or not. The documents may come from
teaching and research institutions in France or
abroad, or from public or private research centers.
L’archive ouverte pluridisciplinaire HAL, est
destinée au dépôt et à la diffusion de documents
scientifiques de niveau recherche, publiés ou non,
émanant des établissements d’enseignement et de
recherche français ou étrangers, des laboratoires
publics ou privés.
record from GOME/ERS-2, SCIAMACHY/Envisat and
GOME-2/MetOp-A
M. E. Koukouli, Christophe Lerot, José Granville, Florence Goutail,
Jean-Christopher Lambert, Jean-Pierre Pommereau, D. Balis, I. Zyrichidou,
Michel van Roozendael, M. Coldewey-Egbers, et al.
To cite this version:
M. E. Koukouli, Christophe Lerot, José Granville, Florence Goutail, Jean-Christopher Lambert, et
al.. Evaluating a new homogeneous total ozone climate data record from GOME/ERS-2,
SCIA-MACHY/Envisat and GOME-2/MetOp-A. Journal of Geophysical Research: Atmospheres, American
Geophysical Union, 2015, 120 (23), pp.12296-12312. �10.1002/2015JD023699�. �insu-01240107�
Evaluating a new homogeneous total ozone climate data
record from GOME/ERS-2, SCIAMACHY/Envisat,
and GOME-2/MetOp-A
M. E. Koukouli1, C. Lerot2, J. Granville2, F. Goutail3, J.-C. Lambert2, J.-P. Pommereau3, D. Balis1, I. Zyrichidou1, M. Van Roozendael2, M. Coldewey-Egbers4, D. Loyola4, G. Labow5, S. Frith5, R. Spurr6, and C. Zehner7
1
Laboratory of Atmospheric Physics, Aristotle University of Thessaloniki, Thessaloniki, Greece,2Belgian Institute for Space Aeronomy, Brussels, Belgium,3LATMOS, CNRS, Versailles Saint-Quentin-en-Yvelines University, Guyancourt, France, 4
Remote Sensing Technology Institute, German Aerospace Center, Wessling, Germany,5Science Systems and Applications, Inc., NASA GSFC, Greenbelt, Maryland, USA,6RT Solutions Inc., Cambridge, Massachusetts, USA,7ESA/ESRIN, Frascati, Italy
Abstract
The European Space Agency’s Ozone Climate Change Initiative (O3-CCI) project aims at producing and validating a number of high-quality ozone data products generated from different satellite sensors. For total ozone, the O3-CCI approach consists of minimizing sources of bias and systematic uncertainties by applying a common retrieval algorithm to all level 1 data sets, in order to enhance the consistency between the level 2 data sets from individual sensors. Here we present the evaluation of the total ozone products from the European sensors Global Ozone Monitoring Experiment (GOME)/ERS-2, SCIAMACHY/Envisat, and GOME-2/ MetOp-A produced with the GOME-type Direct FITting (GODFIT) algorithm v3. Measurements from the three sensors span more than 16 years, from 1996 to 2012. In this work, we present the latest O3-CCI total ozone validation results using as reference ground-based measurements from Brewer and Dobson spectrophotometers archived at the World Ozone and UV Data Centre of the World Meteorological Organization as well as from UV-visible differential optical absorption spectroscopy (DOAS)/Système D′Analyse par Observations Zénithales (SAOZ) instruments from the Network for the Detection of Atmospheric Composition Change. In particular, we investigate possible dependencies in these new GODFIT v3 total ozone data sets with respect to latitude, season, solar zenith angle, and different cloud parameters, using the most adequate type of ground-based instrument. We show that these three O3-CCI total ozone data products behave very similarly and are less sensitive to instrumental degradation, mainly as a result of the new reflectance soft-calibration scheme. The mean bias to the ground-based observations is found to be within the 1 ± 1% level for all three sensors while the near-zero decadal stability of the total ozone columns (TOCs) provided by the three European instruments falls well within the 1–3% requirement of the European Space Agency’s Ozone Climate Change Initiative project.1. Introduction
Global satellite total ozone column (TOC) data sets have now been produced for more than four decades from different type of instrumentsflown on a regular basis. The abundance of spaceborne observations and the evolution of the total ozone column retrieval algorithms have led to a multitude of long-term TOC time series, e.g., Frith et al. [2014], McPeters et al. [2013], Chehade et al. [2014], and Chiou et al. [2014]. Total ozone being one of the Essential Climate Variables, it is crucial that these long-term series are of very high quality in all levels of the chain; from the actual data acquisition to the retrieval process in order to meet the requirements established by the climate research community [van der A, 2011; Hollmann et al., 2013]. Furthermore, a high level of instrumental stability is needed to perform reliable long-term ozone trend studies [e.g., Bourassa et al., 2014; Coldewey-Egbers et al., 2014] or investigate complex regions such as the tropics [e.g., Ebojie et al., 2014; Pastel et al., 2014]. The focus of the ozone retrieval community has hence turned to the optimization of the simultaneous usage of individual observational data sets, which consequently needs to be homogenized as much as possible at all levels [e.g., Loyola and Coldewey-Egbers, 2012], the treatment of possible instrumental effects on the level 0 data (i.e., unprocessed instrument and payload data at full resolution), the transformation of level 0 data to level 1 radiance spectra (i.e., data that have been processed to sensor units such as radar backscatter cross sections, radiances, and brightness temperatures), and the actual extraction of the TOCs. Within the European Space Agency’s Ozone Climate Change Initiative project (O3-CCI), significant effort has been
Journal of Geophysical Research: Atmospheres
RESEARCH ARTICLE
10.1002/2015JD023699
Key Points:
• Validation of Ozone-CCI total ozone products from GOME/ERS-2, SCIAMACHY/Envisat, and GOME-2/ MetOpA
• The Ozone-CCI total ozone data behave similarly and are less sensitive to instrumental degradation • The decadal stability of the TOCs falls
well within the 1–3% requirement
Correspondence to:
M. E. Koukouli, [email protected]
Citation:
Koukouli, M. E., et al. (2015), Evaluating a new homogeneous total ozone climate data record from GOME/ERS-2, SCIAMACHY/Envisat, and GOME-2/ MetOp-A, J. Geophys. Res. Atmos., 120, 12,296–12,312, doi:10.1002/ 2015JD023699.
Received 25 MAY 2015 Accepted 9 OCT 2015
Accepted article online 12 OCT 2015 Published online 4 DEC 2015
©2015. American Geophysical Union. All Rights Reserved.
put on the homogenization of the level 1 to level 2 processing chain for the three European instruments Global Ozone Monitoring Experiment (GOME)/ERS-2, Scanning Imaging Absorption Spectrometer for Atmospheric Chartography (SCIAMACHY)/Envisat, and GOME-2/MetOp-A. One single retrieval algorithm has been applied to the level 1 data from these different sensors in order to retrieve individual total ozone data sets. The direct-fitting algorithm GODFIT (GOME-type Direct FITting) was selected for this goal owing to its highly accurate results, even in extreme geophysical conditions such as low Sun elevation and high optical depth, where it comparatively per-forms better than the classical differential optical absorption spectroscopy (DOAS) approaches. This algorithm was implemented in 2011 into the operational environment of the GOME instrument GOME Data Processor (GDP) v5.0, described in Van Roozendael et al. [2012]. Since then, and within the O3-CCI framework, a series of algorithmic improvements have been made which led to GODFIT version 3. These latest developments have been extensively described in a prequel paper by Lerot et al. [2014] and will be briefly summarized in section 2. In the following, we will refer with the term operational to the official versions of the TOC data sets provided by each instrument and its associated maintaining entity, whether it be the European Meteorological Satellites organization, EUMETSAT, or the European Space Agency, ESA. These operational algorithms rely either on the classical DOAS approach (GDP 4.7 for GOME-2 or SCIAMACHY Ground Processor (SGP) 5.02 for SCIAMACHY) or on a direct-fitting approach (GDP 5.0 for GOME), GODFIT having been the prototype algorithm for the latter as already mentioned.
The main aim of this paper is to evaluate, using ground-based measurements as a documented and traceable reference for the total ozone content of the atmosphere, that the new Ozone CCI GODFIT v3 algorithm produces stable, consistent, and reliable long-term total ozone column data sets from the three European sensors. These evaluation results will be also compared to those corresponding to the current operational products. Furthermore, we assess the intersensor consistency and show that these homogenized data sets may be used to form a consistent multisensor long-term total ozone climate record.
2. Data and Methodology
2.1. The Satellite Instruments
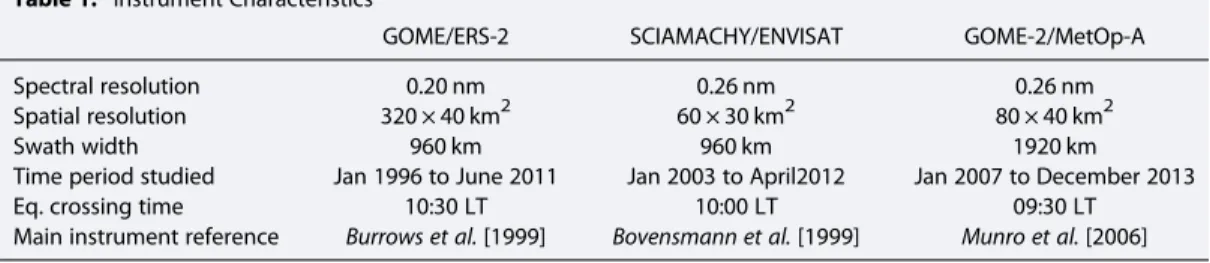
A very brief description of the three different instruments and the relevant algorithms is given in the next two sections. For quick reference, the main features of the three instruments, satellite platforms, and data versions used in this study are summarized in Tables 1 and 2.
2.1.1. GOME On Board ERS-2
The Global Ozone Monitoring Experiment (GOME) was an across-track nadir-viewing spectrometer on board ERS-2, a Sun-synchronous polar-orbiting satellite with a period of about 100 min and an equator crossing time of 10:30 local time launched in April 1995. In normal viewing mode, GOME performed three forward scans followed by a backward scan. Each forward scan had a footprint size of 320 km × 40 km for a 1.5 s detec-tor readout integration time. The maximum swath was 960 km, with a nominal scan angle of ±31° at the spacecraft; global coverage was achieved at the equator within 3 days. GOME had 3584 spectral channels distributed over four serial readout detectors; the wavelength range was 240 to 793 nm, with a moderate spectral resolution of 0.2 to 0.4 nm. More details on the GOME instrument are given by Burrows et al. [1999]. Global coverage was lost in June 2003, with the Southern Hemisphere being mostly affected, due to problems with the satellite tape recorder, whereas the instrument was switched off on 5 July 2011 when the ERS-2 satellite was decommissioned. The official GOME total ozone columns analyzed here are provided by the operational GDP 5.0 product [Van Roozendael et al., 2012] based on a previous version of the direct-fitting algorithm GODFIT. Validation results of this product are presented in Koukouli et al. [2012b] where it was shown
Table 1. Instrument Characteristics
GOME/ERS-2 SCIAMACHY/ENVISAT GOME-2/MetOp-A Spectral resolution 0.20 nm 0.26 nm 0.26 nm Spatial resolution 320 × 40 km2 60 × 30 km2 80 × 40 km2 Swath width 960 km 960 km 1920 km Time period studied Jan 1996 to June 2011 Jan 2003 to April2012 Jan 2007 to December 2013 Eq. crossing time 10:30 LT 10:00 LT 09:30 LT Main instrument reference Burrows et al. [1999] Bovensmann et al. [1999] Munro et al. [2006]
that the GOME GDP5.0 total column product does not suffer from any long-term quality drift between 1995 and 2003, despite the well-known and unavoidable instrumental degradation. A near zero trend for the Northern Hemisphere monthly mean comparisons between GOME and ground-based Dobson stations was calculated pointing to the ability of the GPD5.0 algorithm to tackle these degradation issues. A major known remaining concern with the GOME GDP5.0 total ozone column is a cloud top pressure dependency leading to satellite overestimation for very high clouds, especially at high solar zenith angle (SZA), where differences may reach 4–5% [Koukouli et al., 2012b].
2.1.2. SCIAMACHY On Board ENVISAT
The Scanning Imaging Absorption Spectrometer for Atmospheric Chartography (SCIAMACHY) was launched in March 2002 aboard the European platform ENVISAT and has been operational for more than 10 years pro-viding global coverage in approximately 6 days [Bovensmann et al., 1999] up until April 2012. ENVISAT was in a Sun-synchronous orbit with an inclination of 98.5°, a mean altitude of 796 km, and had a period of 100 min, performing 14 or 15 orbits per day with an Equator crossing time of 10:00 local time. SCIAMACHY was an eight-channel spectrometer covering the spectral range from 240 nm to 2380 nm and used different viewing geometries for retrieving total trace gas columns (nadir) and profiles (limb and solar/lunar occultation). The nominal swath was 960 km with a typical footprint size of 60 km × 30 km for ozone observations. The official SCIAMACHY total ozone column product is SGP v5.02, based on the SCIAMACHY differential optical absorp-tion spectroscopy algorithm [Lerot et al., 2009]. Overall, no appreciable systematic bias with respect to ground-based data has been identified, and more than 75% of the measurements agreed within 5% for the set of ground stations selected in that study.
2.1.3. GOME-2 On Board MetOp-A
The Global Ozone Monitoring Experiment-2 (GOME-2) instrument mounted on theflight-direction side of the MetOp-A satellite which was launched on October 2006. MetOp-A isflying on a Sun-synchronous orbit with an equator crossing time of 09:30 local time (descending node) and a repeat cycle of 29 days. A second GOME-2 instrument is also currentlyflying on board the MetOp-B satellite since September 2012, which is not included in this work. GOME-2 is a nadir-viewing scanning spectrometer, with an across-track scan time of 6 s and a swath width of 1920 km. Global coverage of the sunlit part of the atmosphere can be achieved almost within 1 day. GOME-2 ground pixels have a footprint size of 80 km × 40 km, 4 times smaller than those of GOME (320 km × 40 km), and also improved polarization monitoring and calibration capabilities [Munro et al., 2006]. In the framework of EUMETSAT’s Satellite Application Facility on Ozone and Atmospheric Chemistry Monitoring (O3M-SAF), GOME-2 total ozone data are processed at DLR operationally, both in near real time and offline, using the DOAS GDP 4.x algorithm [Valks et al., 2010]. GDP version 4.4 was released at the end of 2009 using the most recent level 1b data (version 4) and included several algorithmic improve-ments including intracloud correction, Sun-glint detection, and an empirical correction for the east-west scan dependencies as described in Loyola et al. [2011]. Refer to this paper for further details on the algorithm and the validation of the total ozone column against ground-based instruments. In short, for all latitudes and ground-based instruments, the offset between GOME2 GDP4.4 and ground-based reported TOCs is on aver-age 0 to 2% [Loyola et al., 2011]. Recently, the GOME-2 operational total ozone data product has been
Table 2. Algorithm Characteristics
GDP5.0 (GOME) SGP5.02 (SCIAMACHY) GDP4.7 (GOME-2) GODFIT v3 (GOME/SCIAMACHY/GOME-2) Level 0 to 1 algorithm GDP L01 4.0 IPF 7.04 GOME-2 PPF 5.12 GDP L01 4.0/ IPF 7.04/ GOME-2 PPF 5.12
Soft-calibration applied to reflectancesc Level 1 to 2 algorithm GDP 5.0 SGP 5.02 GDP 4.7 GODFIT v3
Retrieval methodology Directfit DOAS DOAS Directfit Cloud algorithm OCRA/ROCINN version 2 OCRA/SACURA OCRA/ROCINN version 2 FRESCO v6
Ozone climatology TOMS v8 TOMS v8 TOMS v8 TOMS v8 combined with OMI/MLS Ozone cross sections Brion, Daumont, and
Malicet (BDM)a
SCIAMACHY Flight modelb Brion, Daumont, and Malicet Brion, Daumont, and Malicet Main algorithm reference Van Roozendael et al. [2012] Lerot et al. [2009] Hao et al. [2014] Lerot et al. [2014] Main validation reference Lambert et al. [2011] Lerot et al. [2009] Hao et al. [2014] This article
aDaumont et al. [1992], Malicet et al. [1995], and Brion et al. [1998]. b
Bogumil et al. [2003].
updated with the application of the GDP v4.7 algorithm, which is discussed and validated in Hao et al. [2014], as well as the O3M-SAF Validation Report, June 2013, found here: http://o3msaf.fmi.fi/docs/vr/ Validation_Report_NTO_OTO_O3_Jun_2013.pdf (last accessed: 19 May 2015) and the O3M-SAF Algorithm Theoretical Basis Document, May 2013, found here: http://o3msaf.fmi.fi/docs/atbd/ Algorithm_Theoretical_Basis_Document_NTO_OTO_May_2013.pdf (last accessed: 19 May 2015). In this study, the GOME-2 GODFIT total ozone columns are compared with those generated by the most current operational algorithm GDP4.7.
2.2. The Satellite Retrieval Algorithms
One common way to retrieve total columns of UV-visible absorbing gases, including ozone, from satellite observations is to use the DOAS technique. This is the case, as briefly mentioned above, for the GOME-2 GDP4.7 operational algorithm and the SCIAMACHY SGP5.02 operational algorithm. The main premise of the DOAS technique is that the total column is retrieved in two steps: a Slant Column retrieval, representative of the ozone absorption along the effective atmospheric light path, followed by an Air Mass Factor calculation to convert it into a total column. This is a very fast and well-established algorithm whose main approximation, and hence shortcoming, is to neglect the wavelength dependency of the photon path length making the algorithm less accurate for very high SZAs (>80°).
The GODFIT v3 algorithm relies on the directfitting of the O3vertical column. This in practice means that radiances are simulated at each wavelength of thefitting window (325–335 nm) and fitted to the measured radiances, with the total ozone column being part of the state vector in addition to temperature profile shift, albedo, Doppler wavelength shift, and Ring amplitude scale factor parameters. This method, although more demanding in computational resources, is closer to the actual physics of the atmosphere. Compared to the previous version of GODFIT, which has been implemented in GDP5.0, new accelerated-performance LInearized Discrete Ordinate Radiative Transfer radiative transfer (RT) tools [Spurr et al., 2013] have been used in GODFIT v3: they exploit the redundancy in thefitting window of the optical properties using principal component analysis tools to reduce the number of fully accurate RT simulations, saving a factor 4 in processing time while maintaining the same level of accuracy. Correction factors are also applied to the simulated Sun-normalized radiances to account for the atmospheric polarization without requiring the use of much slower vector RT models. The semiempirical Ring correction applied to the simulated spectra to account for thefilling in of the Fraunhofer and molecular ozone lines caused by inelastic processes has also been improved in GODFIT v3, in particular at large solar and viewing angles.
The ozone optical depth in each layer of the atmosphere is defined using the ozone absorption cross sections measured by Brion, Daumont, and Malicet [Daumont et al., 1992; Malicet et al., 1995; Brion et al., 1998] and a priori partial ozone columns provided by a combination of the Total Ozone Mapping Spectrometer (TOMS) v8 strato-spheric profile climatology classified by total column amount [McPeters et al., 2007] and the Ozone Monitoring Instrument (OMI)/Microwave Limb Sounder (MLS) tropospheric column climatology [Ziemke et al., 2011]. While the operational algorithms treat clouds as Lambertian surfaces with cloud parameters provided by independent cloud algorithms (e.g., OCRA/ROCINN [Loyola et al., 2007]), the approach has been simplified in GODFIT v3. The observed scene is modeled as an effective scene [Coldewey-Egbers et al., 2005] located between the ground and the cloud, for which the effective albedo is retrieved simultaneously to the total ozone column. This approach minimizes the impact of cloud contamination and implicitly corrects for absorbing or scattering tropospheric aerosols [Lerot et al., 2014]. Thefit of the effective albedo requires a good absolute radiometric calibration of the level 1 spectra. Due to the instrumental degradation, the GOME spectra suffer from large radiometric errors, which makes them inappropriate for deriving information on the albedo. Consequently, in GDP 5.0, surface albedo values werefixed to values provided by an external climatology. For the GODFIT v3 reprocessing, the GOME instrumental degradation has been corrected for making possible thefit of the effective albedo.
Indeed, an important feature of the CCI total ozone data sets generated with GODFIT v3 is that the level 1 reflectances have been soft calibrated to correct for possible bias and artificial spectral features introduced by calibration limitations and instrumental degradation. This soft calibration procedure relies on the statistical comparison of the level 1 data with simulations of Sun-normalized radiances. These simulations are realized with the GODFIT forward model in which total ozone is prescribed by Brewer observations at a few northern
midlatitude stations. Correction factors depending on time, SZA, and viewing zenith angle are then deduced from this statistical comparison, significantly reducing the persisting bias, which may be as large as a few percent (for SCIAMACHY or GOME-2), and bringing the intersensor consistency to the 1% level as shown below. An extensive and comprehensive description of the GDP5.0/GODFIT algorithm is given in Van Roozendael et al. [2012], and references therein, whereas the latest developments specific to GODFIT version 3 of the algorithm are provided in Lerot et al. [2014]. The GODFIT v3 TOC data products are publicly available through the official ESA CCI web portal at http://www.esa-ozone-cci.org/?q=node/160.
2.3. The WOUDC Brewer and Dobson Ground-Based Network
Archived total ozone column measurements from the WMO/Global Atmosphere Watch, GAW, network, routinely deposited at the World Ozone and UV Data Centre (WOUDC) in Toronto, Canada (http://www.woudc.org), were used as ground reference in this work. The WOUDC archive contains total ozone column data mainly from Dobson and Brewer UV spectrophotometers. The total ozone columns measured by UV spectrophotometers is based on the DOAS technique, whereupon the sunlight intensities reaching the Earth’s surface are measured at different wavelengths and are then compared using known differences in laboratory-based ozone absorption cross sections [Bass and Paur, 1985]. The solar light entering the spectrophotometers is dispersed by a quartz prism in the Dobson and gratings in the Brewer instruments, and its intensity is measured in a set of narrow spectral bands.
The Dobson spectrophotometers are, in most cases, manually controlled instruments, composed of two symmetric parts with two prisms: thefirst prism selects the desired narrow wavelength bands, while the second prism rejects the stray light in these bands, improving the wavelength selection. From knowledge of the ozone absorption spectrum between 305 and 340 nm, the ultraviolet Huggins bands, and the calibration of the instrument, the total ozone column is derived [e.g., Basher, 1982; Komhyr et al., 1993, and references therein]. Since 1957, Dobson spectrophotometers have been deployed operationally in a worldwide network. For Sun elevations higher than 15°, a well-maintained and calibrated Dobson spectrophotometer measures the ozone column with an estimated total uncertainty better than 1% for cloud-free direct Sun observations and 2–3% for zenith-sky or cloudy observations [Van Roozendael et al., 1998].
The Brewer grating spectrophotometer is in principle similar to the Dobson; however, it has a more modern optical design and is fully automated. It measures sunlight intensities at either four or six selected wavelengths in the range of 306 to 320 nm to retrieve total columns of ozone and sulfur dioxide [Kerr et al., 1981], even though typically only four wavelengths are used to retrieve the total ozone column. The error of individual total ozone measurements for a well-maintained Brewer instrument is about 1% [e.g., Kerr et al., 1988]. The move-ment of holographic gratings (one in the single monochromator Brewer instrumove-ments and two in the double Brewer instruments) ensures a high-quality wavelength selection. The double monochromator Brewer instru-ment includes an improved rejection of the stray light over the Dobsons at large solar zenith angles, which does not hold for the single Brewers. And even though Brewers have a full automation advantage over the Dobsons, in terms of stability and precision the Dobsons demonstrate a very similar performance. Dobson measurements respond to the stratospheric temperature dependency of the ozone absorption; however, the retrieval does not properly account for the effects of the temperature variations in its use of the ozone absorption coefficients. This known fact may lead to seasonally varying errors of ±0.9% at middle latitudes and of ±1.7% in the Arctic and to systematic errors of up to 4% [Basher, 1982; Bernhard et al., 2005]. Despite the similar performance of the Brewer and Dobson instruments, small differences in the range of ±0.6% are introduced due to the use of different wavelengths and different temperature dependence for the ozone absorption coefficients [Staehelin et al., 2003]. Very recent studies have evaluated the effects of using different ozone absorption cross sections as well as correcting for the Brewer temperature dependence on the total ozone columns and their interconsistency with the Dobson total ozone columns [Fragkos et al., 2013; Redondas et al., 2014]. Correcting for the difference between the real stratospheric temperature and the temperature at 45 °C and 46.3 °C assumed by the operational Brewer and Dobson algorithms, respectively, for middle latitude stations results in a TOC difference ranging between around 0% for the summer months and 1.5–2% for the winter months.
Both Dobson and Brewer instruments may also suffer from long-term drift associated with calibration changes. However, as far as the Dobsons are concerned, regular calibrations are periodically performed at established regional calibration centers against standard Dobson instruments traceable to a primary Dobson instrument in
NOAA, Colorado, USA, [Komhyr et al., 1989]; the Brewers are routinely calibrated against the traveling standard and/or the regional calibration standard (i.e., the EUBrewNet network at Izana, Spain), which is in turn calibrated against the a triad of Brewer instruments operated at Toronto, Canada [Fioletov et al., 2005].
Additional problems arise at solar elevations lower than 15°, for which diffuse and direct radiation contributions can be of the same order of magnitude. Overall, the Brewer observations are typically found to be of better quality than Dobson measurements and are more suited to investigate possible temperature and seasonal/solar zenith angle dependences in particular [Scarnato et al., 2009]. For particular case studies, observations from selected double Brewer instruments down to 10° solar elevation may be used. Unfortunately, the spatial distribution of ground-based stations equipped with Brewer instruments is not very homogeneous, with only a few instruments in the Southern Hemisphere, all in the Antarctic. The Dobson network is therefore much more suitable to investigate spatial homogeneity of satellite products.
Despite these inherent uncertainties, measurements from the ground-based network of Dobson and Brewer instruments are commonly used as a reference for satellite comparisons. A continuously updated selection of these Brewer and Dobson measurements has already been used numerous times in the validation and ana-lysis of global total ozone records such as the intercomparison between the OMI/Aura TOMS and OMI/Aura DOAS algorithms [Balis et al., 2007a], 10 years of GOME/ERS-2 ozone record [Balis et al., 2007b], the updated version of the OMI/Aura TOMS algorithm [Antón et al., 2009], the GOME-2/MetOp-A validation [Loyola et al., 2011; Koukouli et al., 2012a], the new version of the solar backscatter ultraviolet (SBUV) zonal mean TOC record [Labow et al., 2013] as well as an OMI/Aura algorithms intercomparison study by Bak et al. [2015]. The widespread use of the measurements implicitly provides a degree of quality control. The station selection investigation and criteria used in this study have already been discussed in detail in Balis et al. [2007a] and Balis et al., 2007b] and, naturally, a continuous update of the in-house quality assurance of the chosen WOUDC stations is performed annually.
Great care has been taken to ensure the ground-based data used have undergone adequate quality assurance by utilizing reference works such as Fioletov et al. [1999], Vanicek [2006], and Fioletov et al. [2008].
All satellite pixels with their center coordinates lying within a radius of 150 km from each of the ground-based stations have been selected for this validation exercise. Since the WOUDC data are provided on a daily mean basis, all satellite pixels spatially collocated with a station are compared to the ground-based observations of the day. Using all individual pairs, different statistical analyses are carried out in order to investigate different possible dependences between ground and satellite TOC measurements such as dependence on season, latitude, and geometric features. Note that only direct Sun ground-based observations are considered, since they are the most reliable, and that the statistical analyses are realized separately for the different types of instruments. For the case of the Brewer comparisons, on a global scale, 58 stations were found to provide collocations with GOME, 35 stations with GOME2, and 54 stations with SCIAMACHY. These stations are almost all located in the Northern Hemisphere. For the Dobson comparisons, there are 66 stations that give collocations with GOME1, 82 stations with GOME2, and 61 stations with SCIAMACHY. The Dobsons are more evenly distributed around the Globe, with, however, a large part of the number of stations found in the Northern middle latitudes.
2.4. The NDACC SAOZ Ground-Based Network
Based on the DOAS technique, SAOZ is a zenith sky UV-visible spectrometer developed by Pommereau and Goutail [1988] for measuring O3and NO2total columns year-round in polar areas where low sun elevations prevent direct Sun measurements like Brewer and Dobson during wintertime. About 35 UV-visible instru-ments have been deployed at all latitudes and operated in the framework of the Network for Detection of Atmospheric Composition Change (NDACC). The measurements are performed twice a day at sunrise and sunset between 86°–91° SZA. The total ozone column is retrieved in the visible Chappuis band where the ozone absorption cross sections are temperature independent [Burkholder and Talukdar, 1994]. This makes SAOZ observations ideal to investigate possible temperature dependences in satellite total ozone data products. Because of the amplification of the optical path in the stratosphere above 10–14 km at large SZA at twilight, SAOZ measurements are little sensitive to the troposphere and also little impacted by the presence of clouds and are thus ideal to investigate the influence of clouds in the satellite data. In addition, because SAOZ measurements are always performed in the same 86–91° SZA range, they are also ideal for investigating the SZA dependence of the satellites.
The main limitation of SAOZ retrievals is the dependence of the total ozone column on the ozone profiles used in the Air Mass Factor calculations required for converting slant into vertical columns. As recommended by the NDACC UV-VIS working group [Hendrick et al., 2011], the profiles used for this conversion are those of the zonal mean TOMS v8 climatology available in 10° latitude bands [McPeters et al., 2007]. Overall, while the precision of TOC retrievals at midlatitudes is better than 2%, the average precision when including polar latitudes is estimated at 4.7% (mainly due to profile uncertainty) and the total accuracy including absorption cross-section errors at 5.9%. The collocation criteria for the SAOZ instruments are different from the ones used for the Dobson and Brewer instruments. Zenith-sky air masses extend over several hundred kilometers in the azimuth of the rising and setting Sun. The azimuthal range of a full twilight event also changes with latitude and season. As a conse-quence, the relatively straightforward collocation criterion of 150 km around the station geolocation cannot be applied to zenith-scattered twilight measurements without risking additional noise in the comparison results, depending on latitude and season. The level of this noise was assessed in Balis et al. [2007a] as ranging from a few percent at middle latitudes to values approaching 60% at Antarctic stations located alternatively inside and outside of the ozone hole. Therefore, only satellite pixels intersecting at least 25% of the zenith-sky air mass are selected for the comparisons.
3. Results
In the following sections we demonstrate the quality of the total ozone data sets generated with the new GODFIT v3 algorithm, and we illustrate their improvements with respect to the current operational products, especially from the point of view of the intersensor consistency. It should be noted that the operational pro-ducts were optimized independently for each mission without any specific requirements on producing homogeneous data sets across the missions. Nonetheless, the main aim of the current operational algorithms is to produce high-quality TOC series with an accuracy level within ±1%. As such, the long-term stability and intersensor consistency is examined using the Dobson network, the solar zenith angle, and stratospheric temperature behavior using the Brewer and SAOZ networks and possible remaining issues related to cloud contamination using both Dobson and SAOZ instruments as ground-based measurements.
3.1. Long-Term Stability and Intersensor Consistency
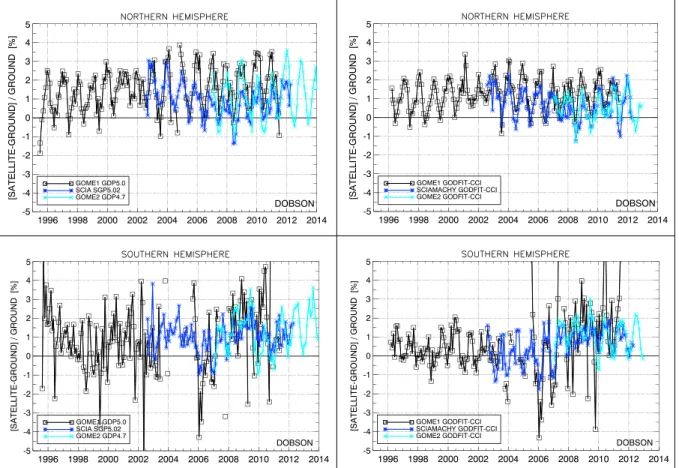
To assess the quality of the time stability and the intersensor consistency, comparisons to the Dobson network will be presented in this section owing to its optimal spatial coverage. In Figure 1, the percentage differences between the satellite and the Dobson measurements are shown as a time series for the operational (left) and the GODFIT v3 algorithms (right). The comparisons are shown for the Northern Hemisphere (NH) and for the Southern Hemisphere (SH) in the upper and lower rows, respectively. The entire available time series for each instrument and algorithm is shown in this comparative plot. These comparisons show a marked improve-ment in the GODFIT v3 data sets; the GOME data (black line) show less scatter throughout the full time series as well as an improved response to the loss of full coverage after year 2003. As mentioned above, the Southern Hemisphere was mostly affected by the instrumental failure and since most ground-based stations are located in the Northern middle latitudes this loss does not affect the continuity of the validation to a substantial effect. The SCIAMACHY data (dark blue line) also show far less scatter, especially in the beginning of the ENVISAT mission, relative to the zero bias line. The GOME-2 data (light blue line) behave similarly to GOME and SCIAMACHY, with 1 to 2% peak-to-peak amplitude, which is smaller than the corresponding amplitude of the operational product. It has to be noted that part of the seasonality shown in these satellite-Dobson differences originate from the known Dobson temperature dependence as discussed in section 2.3. In the SH, the scatter is larger, which may be explained by both the fewer number of stations (~20 compared to ~50 for the NH) and the Antarctica extreme geophysical conditions which include strong gradients in the total ozonefield. However, with GODFIT v3, the scatter in the GOME time series improves remarkably, especially from 1995 to 2005 (right). After that time, the scatter remains large, and a slightly larger systematic bias (~1%) appears (also seen in the GDP 5.0 time series). This can most likely be attributed to the poorer GOME coverage combined with the scarcity of the SH ground-based stations.
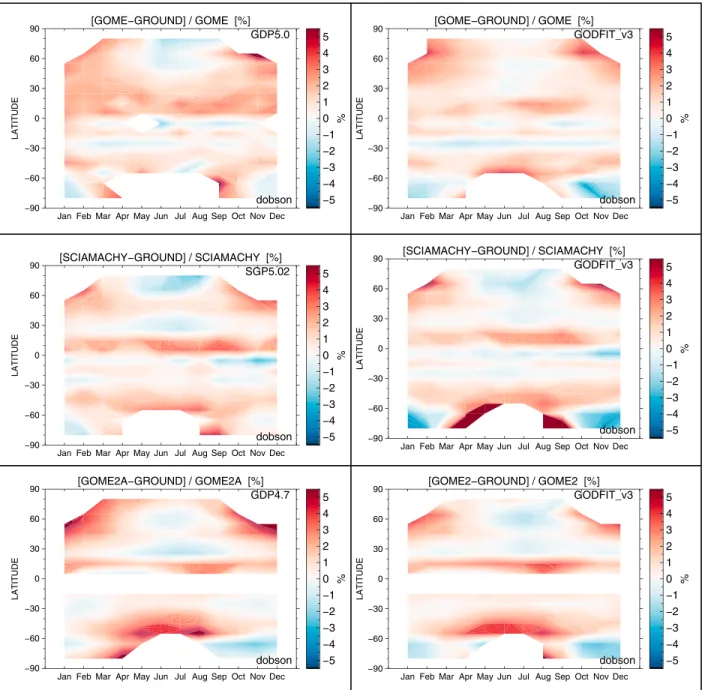
In Figure 2, the latitudinal and seasonal dependences in the satellite-Dobson comparisons are shown for both the operational algorithms (left) and the GODFIT v3 algorithm (right). From thesefigures, it is clear that the three GODFIT products are very consistent with each other. In Figure 2 (top row), the GOME TOC appears smoother in the new version of the data with the high (around 3%) overestimations for the 30–40°N belt decreased and a
general average around 1–2% with no apparent seasonal dependency. In Figure 2 (middle row), some substantial differences for the SCIAMACHY mission shown in Figure 2 (left) are not visible in Figure 2 (right); however, some new high negative values appear at high southern latitudes that will need to be further investigated in the future. In Figure 2 (bottom row), the improvement of the GOME-2 data set is highly noticeable for all latitudes with mean differences close to 0% offset over the entire time period for the new GODFIT v3 data set. The white belt denotes a station in the tropics around 20°N which has stopped providing quality assured data to WOUDC after the beginning of the GOME-2 mission hence leaving a gap in the seasonal contour plot.
An issue to keep in mind when viewing these results is that part of the seasonal behavior of the observed differences probably originates from the Dobson temperature dependence. This effect becomes particularly noticeable when effective temperatures are large during local summer and low during local winter. In particular, the negative differences in ozone hole conditions stem from this Dobson limitation. Indeed, the investigation of the total ozone dependence of the satellite ground-based differences does not indicate any larger bias in low ozone conditions (not shown here).
Figure 3 shows the latitudinal dependences of the percentage satellite-Dobson differences for the opera-tional algorithms (left) and for GODFIT v3 (right). The differences for the operaopera-tional algorithms range within ±2%, except for GOME-2 GDP 4.7, and the consistency between the three instruments is generally better for the NH stations than for the SH stations. As for GODFIT v3, this consistency is much improved at all latitudes. The satellite-Brewer differences at northern latitudes (not shown) lie within ±0.5% for GOME and SCIAMACHY and are slightly higher (~ +1%) for GOME-2 for the operational algorithms, whereas applying the GODFIT v3 algorithm results in differences within the 0–0.5% range for all instruments.
Figure 1. The monthly mean percentage differences between satellite and Dobson TOC measurements are shown as a function of time for the three instruments. (left column) The operational algorithms. (right column) The GODFIT v3 algorithm. Black line: GOME; dark blue line: SCIAMACHY; light blue line: GOME-2. The Northern Hemisphere stations are shown in the upper row and the Southern Hemisphere ones in the lower row.
From thesefigures, it can be concluded that the GODFIT v3 data sets have a greater degree of temporal stability and intersensor consistency relative t to the current operational products.
3.2. Solar Zenith Angle and Stratospheric Temperature Dependences
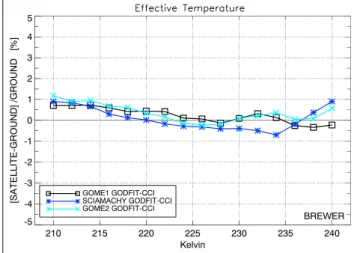
In this section, we focus on the investigation of possible SZA and effective temperature (i.e., the ozone-weighted mean atmospheric temperature) dependences of the GODFIT v3 data sets. The Brewer instruments are particularly well adapted for this since they provide accurate measurements even for large optical paths, especially the double-monochromator instruments, and their temperature dependence is very limited, contrary to the Dobson instruments. As discussed before, SAOZ observations are also an important additional source of information to study the effective temperature dependence of satellite data sets since they rely on the analysis of the temperature-independent ozone absorption in the Chappuis bands.
Figure 2. The percentage differences between satellite and Dobson TOC measurements is depicted in this composite of contour plots for the three instruments. (left column) The operational algorithms, (right column) The GODFIT v3 algorithm, (top row) GOME, (middle row) SCIAMACHY, and (bottom row) GOME-2.
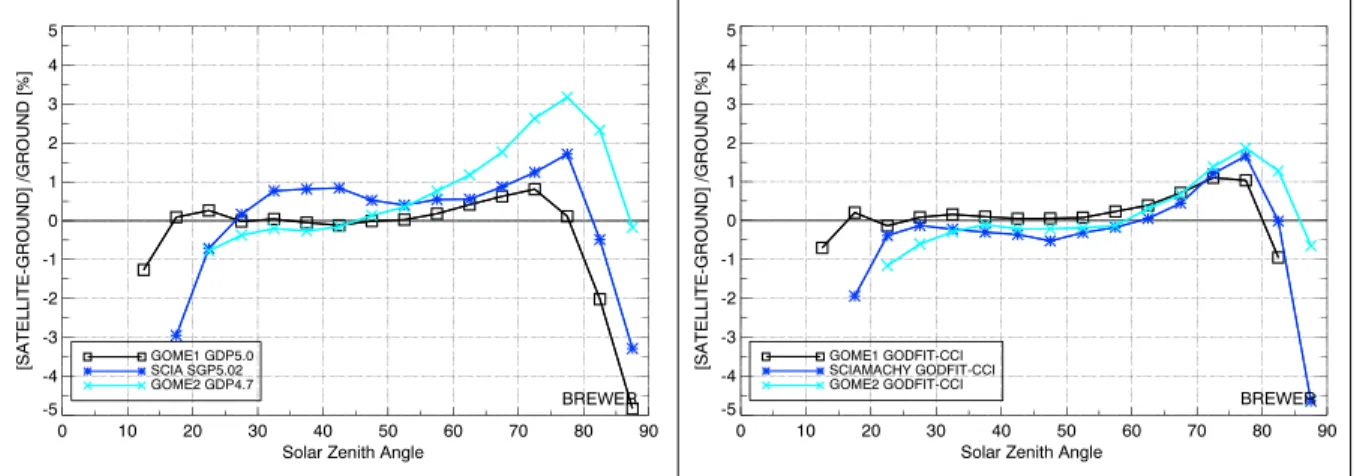
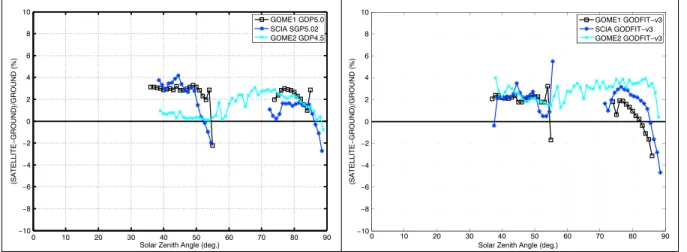
Figure 4 compares the satellite SZA dependence of the satellite-Brewer differences for the operational and the GODFIT v3 data sets. The GODFIT SZA dependences are slightly reduced compared to those of the operational products, especially for GOME-2 (light blue). Again, the three curves corresponding to the three instruments are very similar for GODFIT v3. Since the solar zenith angle and the effective temperature are geophysically correlated, it is interesting to examine the effective temperature dependence of the satellite data sets. This effective temperature is computed using the ozone and temperature profiles from the GODFIT forward model corresponding to thefinal state vector after the inversion. Figure 5 shows that the GODFIT-Brewer differences hardly depend on the effective temperature.
To further investigate the behavior of the GODFIT v3 algorithm above 80° SZA, the summertime collocations (solstice ± 1 month) for the Northern Hemisphere SAOZ stations listed in Table 3 were used to create compar-ison plots. During polar summer, satellites on Sun-synchronous orbits pass over high-latitude stations 2 times a day. Therefore, we have two series of satellite measurements to be compared with a single ground-based measurement per day. These two series of overpass data are characterized by moderate and large SZAs, respectively, which allows an investigation of the SZA dependency of the satellite product, independently of possible SZA dependence in the ground-based measurements. In addition, the advantage of using SAOZ instruments as the ground-based reference is that the measurements are always carried out with the same geometry and are consequently less dependent on the season than Dobson and Brewer instruments. In Figure 6, the differences between ground and satellite total ozone columns resulting from these specific conditions are plotted for the operational and GODFIT v3 algorithms in Figures 6 (left) and 6 (right),
Figure 3. The percentage differences between satellite and Dobson TOC measurements as a function of latitude for the Dobson network. (left) The operational algorithms. (right) The GODFIT v3 algorithm. Black line: GOME; dark blue line: SCIAMACHY; light blue line: GOME-2.
Figure 4. The percentage differences between satellite and ground-based TOC measurements as a function of solar zenith angle for the Brewer network. (left) The operational algorithms. (right) the GODFIT v3 algorithm. Black line: GOME; dark blue line: SCIAMACHY; light blue line: GOME-2.
respectively, as a function of 1° bins in solar zenith angle. In general, it appears that the SZA dependence of GOME-2 and also that of GOME and SCIAMACHY at moderate SZA values is reduced compared to the operational algorithms. At extreme SZAs greater than 85° a significant dependency can be seen for all instruments. Overall, the mean difference between the GODFIT v3 TOCs and the SAOZ instruments decreases compared to the operational algorithm, most notably for GOME1 where the mean value declines from 2.53% to 1.30%. However, the standard deviation of the means, remain constant with value ranging between 4.00% and 4.5% for the three instruments. Although this figure cannot be directly compared to Figure 4 as the focus is here on the northern polar summer only, such dependence at high SZAs was also visible in the comparisons with the Brewer instruments.
3.3. Cloud Dependence Investigation
Cloud contamination can significantly reduce the accuracy of satellite derived total ozone [Antón and Loyola, 2011]. In order to examine the possibility that GODFIT v3 ozone depends on cloud properties, a series of com-parisons were performed where the dependency on the cloud fraction (CLF) and the cloud top pressure (CTP) has been examined. To avoid introducing any bias due to the identified solar zenith angle dependency, an upper limit of 80° in SZA has been used to generate all the graphs of this Figure. A lower limit to the amount of data (one thousandth of the total count) falling into each bin was also implemented to avoid nonrepresen-tativefindings. As shown in Figure 3 (right) there appears to exist a differentiation between the two poles, with the comparisons in the northern high latitudes (northward of 60°) showing an overestimation, whereas the ones in the southern high latitudes (southward of 60°) show an underestimation for all three satellite instruments. This interhemispheric bias for high latitudes, of the order of 3–4%, is also reported by the SAOZ instruments and currently under investigation. For this reason, and to be able to differentiate possible cloud effects from this interhemispheric bias, contour representations of the CTP to CLF dependencies on the ozone differences were examined for the Northern Hemisphere only in Figure 7. In Figure 7 (top row), data from the tropical zone is shown, from 30°S to 30°N, and in Figure 7 (bottom row), data from the middle latitudes, from 60°S to 30°S and 30°N to 60°N. In Figure 7 (left column), the GOME GODFIT v3 comparisons are shown, in Figure 7 (middle column) the SCIAMACHY GODFIT v3, and in Figure 7 (right column) the GOME-2 GODFIT v3 comparisons. As far as the tropical belt is concerned, almost no dependence on either CLF or CTP is found for the Brewer and Dobson tropical stations, with differences ranging at the ±1% level, and no discernible pattern for any of the three instruments. A similar picture is revealed for the middle latitudes where a slight positive CTP dependence is observed for both Dobson (Figure 7, bottom row) and Brewer (not shown here) instruments.
Table 3. NDACC DOAS SAOZ Instruments Selected for High-Latitude Studies
Station Location Latitude Longitude Responsible Institute Scoresbysund Eastern Greenland 70.48°N 21.95°W CNRS/DMI Sodankylä Finland 67.37°N 26.63°E CNRS/FMI Zhigansk Eastern Siberia 66.79°N 123.35°E CNRS/CAO Salekhard Western Siberia 66.50°N 66.70°E CNRS/CAO Harestua Norway 60.20°N 10.80°E IASB Figure 5. The percentage differences between satellite and Brewer TOC
measurements as a function of the effective temperature. Black line: GOME; dark blue line: SCIAMACHY; light blue line: GOME-2.
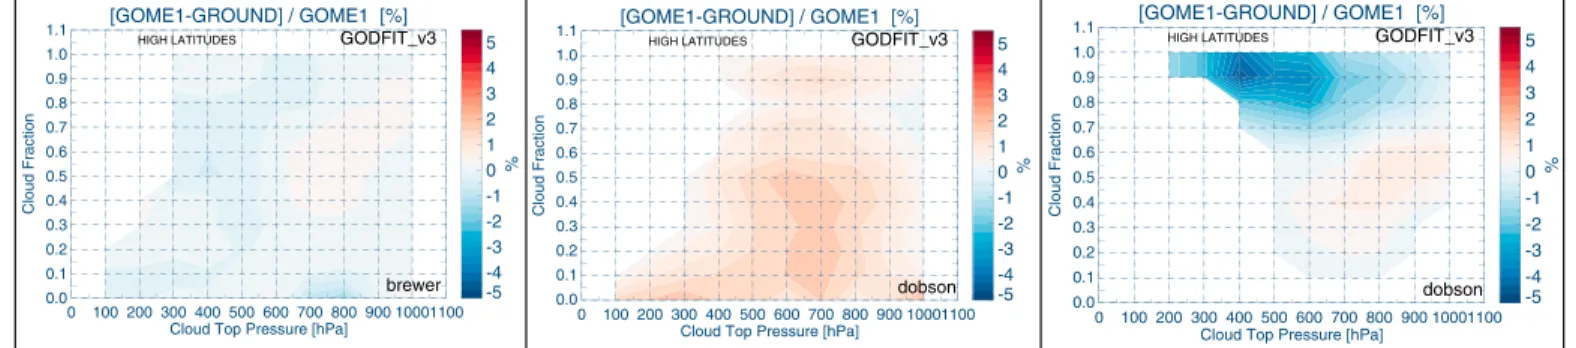
At high latitudes, the temperature dependence of the Dobson instruments leads to significant seasonality effect in the ground-based total ozone column measurements. If the cloud contamination at those high lati-tudes depends significantly on the season, it would be quite difficult to differentiate between the known effects of this Dobson limitation and an actual cloud parameter dependence. Hence, for the high-latitude stations, the CLF and CTP dependencies are examined separately for the northern and southern high-latitude stations as shown in Figure 8 for the GOME collocations. Very different patterns are obtained for the two hemispheres for the Dobson stations shown in Figure 8 (middle) for the Northern Hemisphere and in Figure 8 (right) for the Southern Hemisphere. In each hemisphere, no significant cloud dependence is visible and the differences are of opposite signs, ranging from around 2% to +2% depending on the hemisphere. Similarly, cloud dependencies in GOME-Brewer differences are shown in Figure 8 (left), for the northern high-latitude stations. Again, no significant dependence is detected and the mean difference is very slightly negative, around 1%. In the northern Dobson stations comparison, the mean difference was instead
Figure 6. The percentage differences between satellite and SAOZ TOC measurements as a function of the solar zenith angle. (left) The operational algorithms. (right) The GODFIT v3 algorithm. Black line: GOME; dark blue line: SCIAMACHY; light blue line: GOME-2.
Figure 7. Cloud top pressure and cloud fraction dependencies of the differences for different zones: the tropical zone (top) from 30°S to 30°N and the middle latitudes and (bottom) from 60°S to 30°S and 30°N to 60°N. (left column) The GOME GODFIT v3 comparisons. (middle column) The SCIAMACHY GODFIT v3 comparisons. (right column) The GOME-2 GODFIT v3 comparisons.
positive, this inconsistency being explained by the known systematic bias existing between the Dobson and Brewer observations.
From this analysis, we can conclude that there is no significant cloud dependence in the satellite GODFIT v3 products. It is likely that there is a small interhemispheric difference at high latitudes in the GODFIT v3 data sets (also visible in Figure 3), which needs to be further investigated. Inhomogeneities in the ground-based networks might also explain part of this interhemispheric bias. Also, this analysis clearly highlights the crucial importance of separating as much as possible the different dimensions when analyzing satellite-ground differences in order to draw meaningful conclusions.
3.4. Comparisons to the SBUV TOC Data Sets
In order to examine the suitability of the new GODFIT v3 data sets as a continuation of the long-term TOC records starting in the early seventies, comparisons were performed against the solar backscatter ultraviolet (SBUV) data products, recently updated under the auspices of the NASA Making Earth Science Data Records for Use in Research Environments (MEaSUREs) Program [McPeters et al., 2013]. This new data record, in its level 2 format, has already been validated against around thirty Brewer and Dobson ground-based measure-ments that span the entire 40 years of SBUV heritage by Labow et al. [2013]. Their time series comparisons showed an agreement within ± 1% over the entire time period with the bias approaching zero over the last decade.
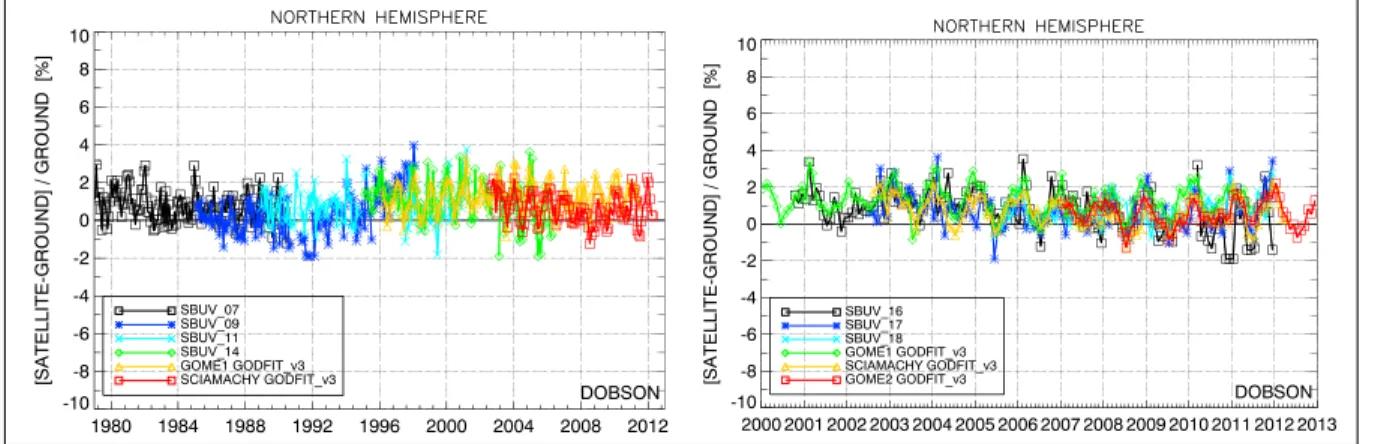
For this work, daily level 2 Hierarchical Data Format (HDF)files encompassing retrievals of the total ozone col-umn using the latest SBUV algorithm (v8.6) from a series of eight instruments were downloaded locally: (http:// disc.sci.gsfc.nasa.gov/daac-bin/DataHoldingsMEASURES.pl?PROGRAM_List=RichardMcPeters). The instruments include: Nimbus 4 BUV (April 1970 to April 1977), Nimbus 7 SBUV (November 1978 to June 1990), NOAA 9 SBUV/2 (February 1985 to July 1997), NOAA 11 SBUV/2 (December 1988 to March 2001), NOAA 14 SBUV/2 (February 1995 to April 2006), NOAA 16 SBUV/2 (October 2000 to December 2010), NOAA 17 SBUV/2 (July 2002 to December 2010), and NOAA 18 SBUV/2 (June 2005 to December 2010). The SBUV data were treated with exactly the same analysis and statistical routines as the three GODFIT v3 data sets described above to ensure continuity and to avoid possible sampling issues that may affect the subsequent comparisons. In Figure 9, the time series of each of the TOC data sets is shown; on the left the NH Dobson from 1979 to 2012 and on the right, the NH Dobson comparisons from 2000 to 2013. Extreme caution is required when interpret-ing these types offigures; the amount and hence latitudinal coverage of the ground-based stations used in the validation changes between 1979 and 2013, a fact which precludes a one-to-one comparison and discussion. The focus, however, of this intercomparison is not comparing the absolute TOC values but rather to illustrate improvements in the monthly/seasonal/yearly variability of the GODFIT v3 TOCs as well as common features with the SBUV data. Hence, a few important observations can indeed be made. In Figure 9 (left), the Dobson comparison time series shows how the GODFIT v3 data from 1995 onward continues nicely the already estab-lished SBUV TOC time series from 1979 onward, with all component instruments showing a very similar seasonal variability as well as a peak-to-peak amplitude between 1% and +2% in most cases. This picture is even smoother in the case of the Brewer instruments with the peak-to-peak variability within ±1% (not shown here).
Figure 8. Cloud top pressure and cloud fraction dependencies of the differences for high-latitude zones are shown: (left) the Brewer network comparisons between 60° and 90°N, (middle) the Dobson network comparisons between 60° and 90°N, and (right) the Dobson network comparisons between 60° and 90°S. The com-parisons shown here are against the GOME1 collocations.
Chiou et al. [2014] have also demonstrated that, investigating on a zonal mean basis, the differences between col-located ground-based WOUDC stations and the SBUV estimates remain positive for the tropics and the NH middle latitudes with mean values between 0.10% and 0.70% and associated STandard Deviation (STDs) between 1.35 to 1.70%. The SH middle latitudes only show a negative bias of 0.60 ± 2.00% (see their Table 3). The agreement between overlapping time segments between the SBUV suite and the GODFIT v3 TOCs is indeed exceptional, considering the differences in terms of calibration, instrumentation, algorithm, etc. For example, in the begin-ning of the GOME mission in Figure 9 (right) (green line) the variability depicted for years 1995 to 2000 is also similarly represented in the NOAA 11 SBUV/2 (cyan line) and the NOAA 14 SBUV/2 (green line).
4. Discussion and Conclusions
The main aim of this paper was to demonstrate, using ground-based measurements as a documented and traceable reference for the total ozone content of the atmosphere, that the new Ozone CCI GODFIT v3 algorithm produces stable, consistent, and reliable long-term total ozone column data sets from three European sensors, GOME/ERS-2, SCIAMACHY/Envisat, and GOME-2/MetOp-A. Ground-based Brewer, Dobson, and NDACC DOAS UV-vis/SAOZ global TOC measurements were used as the common denominator to perform a comparison of the new GODFIT v3 products to the current operational products. Various new features in the GODFIT v3 algorithm are responsible for the demonstrated improvements; in particular, the introduction of the soft calibration of reflectances led to a remarkable intersatellite consistency and homogenization of the three GODFIT v3 data sets.
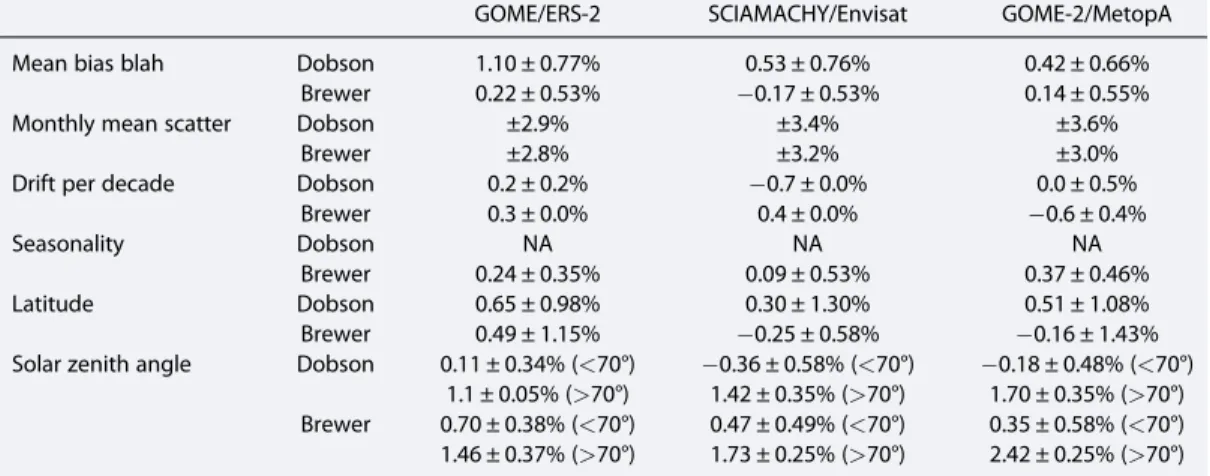
In Table 4 the statistics extracted from the Dobson and Brewer comparisons are presented for the GOME (second column), the SCIAMACHY (third column), and GOME-2 GODFIT v3 validation (fourth column) where applicable. Under the header“mean bias” we refer to the mean bias and standard deviation (1 sigma) of the NH time series; the header“monthly mean scatter” refers to the variability on the standard deviation of the monthly mean standard deviation values in the NH time series; the header“drift per decade” refers to the decadal drift and associated standard deviation calculated from the NH time series; the header“seasonality” depicts the mean difference from the seasonal plots and the amplitude of the seasonal variability on a global scale; the header“latitude” gives the mean bias and standard deviation as calculated by the latitudinal variability plots on a global scale; the“solar zenith angle” gives the mean bias and standard deviation as calculated from the solar zenith angle ranges shown on a global scale.
As seen in Table 5 of the Ozone-CCI User Requirement Document [van der A, 2011], it was defined within the premises of the European Space Agency’s Ozone Climate Change Initiative project that the decadal stability of the total ozone column provided by the three European instruments must fall within 1–3%, the long-term accuracy of each product be less than 2%, and the short-term accuracy of the product less than 3%. The sea-sonal cycle and interannual variability must also be less than 3%. The statistics provided in Table 4 testify to this fact unambiguously since no long-term drift or long-term bias was found in this new data set.
Figure 9. The long-term total ozone record monthly mean differences between the SBUV and GODFIT v3 data sets relative to Dobson ground-based measurements at Northern Hemisphere station locations. (left) Nimbus 7 SBUV (black line), NOAA 9 SBUV/2 (blue line), NOAA 11 SBUV/2 (cyan line), NOAA 14 SBUV/2 (green line), GOME1 GODFIT v3 (orange line), and SCIAMACHY GODFIT v3 (red line). (right) NOAA 16 SBUV/2 (black line), NOAA 17 SBUV/2 (blue line), NOAA 18 SBUV/2 (cyan line), GOME1 GODFIT v3 (green line), SCIAMACHY GODFIT v3 (orange line), and GOME-2 GODFIT v3 (red line).
It can be concluded that the GODFIT v3 GOME/ERS-2, SCIAMACHY/Envisat, and GOME-2/MetOp-A data sets have been clearly consolidated with respect to the current operational products, mainly from the point of view of the temporal stability and of the intersensor consistency, and all three sensors are behaving quite similarly. As a continuation of the long-term total ozone column time series, the GODFIT v3 TOCs show remarkable agreement with the solar backscatter ultraviolet (SBUV) suite of instruments as well. The solar zenith angle dependency has also been slightly reduced in GODFIT v3, with some underestimation remaining for the extreme SZAs. An interhemispheric bias for the high latitudes has been identified and will be the focus of further study and algorithm improvements.
The new GODFIT v3 TOC data sets have also been used to create a comprehensive level 3 1 × 1° gridded pro-duct being presented in Coldewey-Egbers et al. [2015], a sister level 3 algorithm description, and validation paper. The validation results of the GOME/SCIAMACHY/GOME-2 GODFIT v3-merged level 3 product are very similar to those presented in this study for the corresponding level 2 product; negligible or within 1% differ-ences for all latitudes were found, with very few outliers appearing for a few months in the very high latitudes (poleward of 70°) possibly due to gridding disparities. As such, it is further confirmed that the GODFIT v3 TOC data sets can be quite dependably used in climate and modeling studies and other such applications.
References
Antón, M., and D. Loyola (2011), Influence of cloud properties on satellite total ozone observations, J. Geophys. Res., 116, D03208, doi:10.1029/ 2010JD014780.
Antón, M., D. Loyola, M. López, J. M. Vilaplana, M. Bañón, W. Zimmer, and A. Serrano (2009), Comparison of GOME-2/MetOp total ozone data with Brewer spectroradiometer data over the Iberian Peninsula, Ann. Geophys., 27, 1377–1386, doi:10.5194/angeo-27-1377-2009. Bak, J., X. Liu, J. H. Kim, K. Chance, and D. P. Haffner (2015), Validation of OMI total ozone retrievals from the SAO ozone profile algorithm and
three operational algorithms with Brewer measurements, Atmos. Chem. Phys., 15, 667–683, doi:10.5194/acp-15-667-2015. Balis, D., M. Kroon, M. E. Koukouli, E. J. Brinksma, G. Labow, J. P. Veefkind, and R. D. McPeters (2007a), Validation of Ozone Monitoring
Instrument total ozone column measurements using Brewer and Dobson spectrophotometer ground-based observations, J. Geophys. Res., 112, D24S46, doi:10.1029/2007JD008796.
Balis, D., et al. (2007b), Ten years of GOME/ERS2 total ozone data—The new GOME data processor (GDP) version 4: 2. Ground-based validation and comparisons with TOMS V7/V8, J. Geophys. Res., 112, D07307, doi:10.1029/2005JD006376.
Basher, R. E. (1982), Review of the Dobson spectrophotometer and its accuracy, Rep. 13, WMO Global Ozone Res. and Monit. Proj., Geneva, Dec. [Available at http://www.esrl.noaa.gov/gmd/ozwv/dobson/papers/report13/report13.html.]
Bass, A. M., and R. J. Paur (1985), The ultraviolet cross–sections of ozone: I. The measurements II. Results and temperature dependence, in Atmospheric Ozone. Proceedings of the Quadrennial Ozone Symposium, Halkidiki, Greece, edited by C. Zerefos and A. Ghazi, pp. 606–616, Reidel, Dordrecht, Netherlands.
Bernhard, G., R. D. Evans, G. J. Labow, and S. J. Oltmans (2005), Bias in Dobson total ozone measurements at high latitudes due to approx-imations in calculations of ozone absorption coefficients and air mass, J. Geophys. Res., 110, D10305, doi:10.1029/2004JD005559. Bogumil, K., et al. (2003), Measurements of molecular absorption spectra with the SCIAMACHY pre-flight model: Instrument characterization
and reference data for atmospheric remote sensing in the 230–2380 nm region, J. Photochem. Photobiol., A, 157, 157–167.
Bourassa, A. E., D. A. Degenstein, W. J. Randel, J. M. Zawodny, E. Kyrölä, C. A. McLinden, C. E. Sioris, and C. Z. Roth (2014), Trends in stratospheric ozone derived from merged SAGE II and Odin-OSIRIS satellite observations, Atmos. Chem. Phys., 14, 6983–6994, doi:10.5194/acp-14-6983-2014. Bovensmann, H., J. P. Burrows, M. Buchwitz, J. Frerick, S. Noël, V. V. Rozanov, K. V. Chance, and A. P. H. Goede (1999), SCIAMACHY: Mission
objectives and measurement modes, J. Atmos. Sci., 56(2), 127–150.
Brion, J., A. Chakir, J. Charbonnier, D. Daumont, C. Parisse, and J. Malicet (1998), Absorption spectra measurements for the ozone molecule in the 350–830 nm region, J. Atmos. Chem., 30, 291–299.
Table 4. Statistics Extracted From the Dobson Network Comparisons for the GODFIT V3 Validation
GOME/ERS-2 SCIAMACHY/Envisat GOME-2/MetopA Mean bias blah Dobson 1.10 ± 0.77% 0.53 ± 0.76% 0.42 ± 0.66%
Brewer 0.22 ± 0.53% 0.17 ± 0.53% 0.14 ± 0.55% Monthly mean scatter Dobson ±2.9% ±3.4% ±3.6%
Brewer ±2.8% ±3.2% ±3.0% Drift per decade Dobson 0.2 ± 0.2% 0.7 ± 0.0% 0.0 ± 0.5%
Brewer 0.3 ± 0.0% 0.4 ± 0.0% 0.6 ± 0.4% Seasonality Dobson NA NA NA
Brewer 0.24 ± 0.35% 0.09 ± 0.53% 0.37 ± 0.46% Latitude Dobson 0.65 ± 0.98% 0.30 ± 1.30% 0.51 ± 1.08% Brewer 0.49 ± 1.15% 0.25 ± 0.58% 0.16 ± 1.43% Solar zenith angle Dobson 0.11 ± 0.34% (<70°) 0.36 ± 0.58% (<70°) 0.18 ± 0.48% (<70°)
1.1 ± 0.05% (>70°) 1.42 ± 0.35% (>70°) 1.70 ± 0.35% (>70°) Brewer 0.70 ± 0.38% (<70°) 0.47 ± 0.49% (<70°) 0.35 ± 0.58% (<70°) 1.46 ± 0.37% (>70°) 1.73 ± 0.25% (>70°) 2.42 ± 0.25% (>70°)
Acknowledgments
The authors are grateful to ESA’s Climate Change Initiative– Ozone project for providing the funding necessary of this work. Part of this work has also been funded by the Belgian Federal Science Policy Office (BelSPO) and ProDEx via the A3C project. The ground-based data used in this publication were obtained as part of WMO’s Global Atmosphere Watch (GAW) and the Network for the Detection of Atmospheric Composition Change (NDACC). They are publicly available via the World Ozone and UV Data Centre (WOUDC) and the NDACC Data Host Facility (see http://woudc.org and http:// ndacc.org, respectively). We would like to acknowledge and warmly thank all the investigators that provide data to these repositories on a timely basis, as well as the handlers of these databases for their upkeep and quality guaranteed efforts.
Burkholder, J. B., and R. K. Talukdar (1994), Temperature dependence of the ozone absorption spectrum over the wavelength range 410 to 760 nm, Geophys. Res. Lett., 21, 581–584, doi:10.1029/93GL02311.
Burrows, J. P., et al. (1999), The global ozone monitoring experiment (GOME): Mission concept andfirst scientific results, J. Atmos. Sci., 56, 151–157.
Chehade, W., M. Weber, and J. P. Burrows (2014), Total ozone trends and variability during 1979–2012 from merged data sets of various satellites, Atmos. Chem. Phys., 14, 7059–7074, doi:10.5194/acp-14-7059-2014.
Chiou, E. W., P. K. Bhartia, R. D. McPeters, D. G. Loyola, M. Coldewey-Egbers, V. E. Fioletov, M. Van Roozendael, R. Spurr, C. Lerot, and S. M. Frith (2014), Comparison of profile total ozone from SBUV (v8.6) with GOME-type and ground-based total ozone for a 16-year period (1996 to 2011), Atmos. Meas. Tech., 7, 1681–1692, doi:10.5194/amt-7-1681-2014.
Coldewey-Egbers, M., M. Weber, L. N. Lamsal, R. de Beek, M. Buchwitz, and J. P. Burrows (2005), Total ozone retrieval from GOME UV spectral data using the weighting function DOAS approach, Atmos. Chem. Phys., 5, 1015–1025, doi:10.5194/acp-5-1015-2005.
Coldewey-Egbers, M., D. G. Loyola R., P. Braesicke, M. Dameris, M. van Roozendael, C. Lerot, and W. Zimmer (2014), A new health check of the ozone layer at global and regional scales, Geophys. Res. Lett., 41, 4363–4372, doi:10.1002/2014GL060212.
Coldewey-Egbers, M., et al. (2015), The GOME-type Total Ozone Essential Climate Variable (GTO-ECV) data record from the ESA Climate Change Initiative, Atmos. Meas. Tech. Discuss., 8, 4607–4652, doi:10.5194/amtd-8-4607-2015.
Daumont, D., J. Brion, J. Charbonnier, and J. Malicet (1992), Ozone UV spectroscopy: I. Absorption cross-sections at room temperature, J. Atmos. Chem., 15, 145–155, doi:10.1007/BF00053756.
Ebojie, F., C. von Savigny, A. Ladstätter-Weißenmayer, A. Rozanov, M. Weber, K.-U. Eichmann, S. Bötel, N. Rahpoe, H. Bovensmann, and J. P. Burrows (2014), Tropospheric column amount of ozone retrieved from SCIAMACHY limb–nadir-matching observations, Atmos. Meas. Tech., 7, 2073–2096, doi:10.5194/amt-7-2073-2014.
Fioletov, V. E., J. B. Kerr, E. W. Hare, G. J. Labow, and R. D. McPeters (1999), An assessment of the world ground-based total ozone network performance from the comparison with satellite data, J. Geophys. Res., 104, 1737–1747, doi:10.1029/1998JD100046.
Fioletov, V. E., J. B. Kerr, C. T. McElroy, D. I. Wardle, V. Savastiouk, and T. S. Grajnar (2005), The Brewer reference triad, Geophys. Res. Lett., 32, L20805, doi:10.1029/2005GL024244.
Fioletov, V. E., et al. (2008), Performance of the ground-based total ozone network assessed using satellite data, J. Geophys. Res., 113, D14313, doi:10.1029/2008JD009809.
Fragkos, K., A. F. Balis, D. Balis, C. Meleti, and M. E. Koukouli (2013), The effect of three different absorption cross-sections and their temperature dependence on Total Ozone measured by a Mid-Latitude Brewer Spectrometer, Atmos. Ocean, doi:10.1080/07055900.2013.847816. Frith, S. M., N. A. Kramarova, R. S. Stolarski, R. D. McPeters, P. K. Bhartia, and G. J. Labow (2014), Recent changes in total column ozone based
on the SBUV Version 8.6 Merged Ozone Data Set, J. Geophys. Res. Atmos., 119, 9735–9751, doi:10.1002/2014JD021889.
Hao, N., et al. (2014), GOME-2 total ozone columns from MetOp-A/MetOp-B and assimilation in the MACC system, Atmos. Meas. Tech., 7, 2937–2951, doi:10.5194/amt-7-2937-2014.
Hendrick, F., et al. (2011), NDACC UV-visible total ozone measurements: Retrieval homogenization and comparison with collocated satellite and ground-based observations, Atmos. Chem. Phys., 11(12), 5975–5995, doi:10.5194/acp-11-5975-2011.
Hollmann, R., et al. (2013), The ESA climate change initiative: Satellite data records for essential climate variables, Bull. Am. Meteorol. Soc., 94, 1541–1552, doi:10.1175/BAMS-D-11-00254.1.
Kerr, J. B., C. T. McElroy, and R. A. Olafson (1981), Measurements of ozone with the Brewer ozone spectrophotometer, in Proceedings of the Quadrennial Ozone Symposium, Boulder, Colorado, edited by J. London, pp. 74–79, Natl. Cent. for Atmos. Res., Boulder, Colo.
Kerr, J. B., I. A. Asbridge, and W. F. J. Evans (1988), Intercomparison of total ozone measured by the Brewer and Dobson spectrophotometers at Toronto, J. Geophys. Res., 93, 11,129–11,140, doi:10.1029/JD093iD09p11129.
Komhyr, W. D., R. D. Grass, and R. K. Leonard (1989), Dobson spectrophotometer 83: A standard for total ozone measurements 1963–1987, J. Geophys. Res., 94, 9847–9861, doi:10.1029/JD094iD07p09847.
Komhyr, W. D., C. L. Mateer, and R. D. Hudson (1993), Effective Bass-Paur 1985 ozone absorption coefficients for use with Dobson ozone spectrophotometers, J. Geophys. Res., 98, 20,451–20,465, doi:10.1029/93JD00602.
Koukouli, M. E., D. S. Balis, D. Loyola, P. Valks, W. Zimmer, N. Hao, J.-C. Lambert, M. Van Roozendael, C. Lerot, and R. J. D. Spurr (2012a), Geophysical validation and long-term consistency between GOME-2/MetOp-A total ozone column and measurements from the sensors GOME/ERS-2, SCIAMACHY/ENVISAT and OMI/Aura, Atmos. Meas. Tech., 5, 2169–2181, doi:10.5194/amt-5-2169-2012.
Koukouli, M. E., D. Balis, D. Loyola, W. Zimmer, J.-C. Lambert, M. Van Roozendael, C. Lerot, S. Kazadzis, C. Zerefos, and C. Zenner (2012b), Validating the new operational GOME GDP 5.0 total ozone product based on the GODFIT algorithm, Advances in Atmospheric Science and Applications, Eur. Space Agency, Bruges, Belgium, 18–22 June.
Labow, G. J., R. D. McPeters, P. K. Bhartia, and N. Kramarova (2013), A comparison of 40 years of SBUV measurements of column ozone with data from the Dobson/Brewer network, J. Geophys. Res. Atmos., 118, 7370–7378, doi:10.1002/jgrd.50503.
Lambert, J. C., M. E. Koukouli, D. S. Balis, J. Granville, C. Lerot, and M. Van Roozendael (2011), Validation report for ERS-2 GOME GDP 5.0 total ozone column, TN-IASB-GOME-GDP5-VR/DLR-GOME-GDP5-VR, issue 1/A.
Lerot, C., M. Van Roozendael, J. van Geffen, C. Fayt, R. Spurr, G. Lichtenberg, and A. von Bargen (2009), Six years of total ozone column measurements from SCIAMACHY nadir observations, Atmos. Meas. Tech., doi:10.5194/amt-2-87-2009.
Lerot, C., et al. (2014), Homogenized total ozone data records from the European sensors GOME/ERS-2, SCIAMACHY/Envisat, and GOME-2/ MetOp-A, J. Geophys. Res. Atmos., 119, 1639–1662, doi:10.1002/2013JD020831.
Loyola, D., W. Thomas, Y. Livschitz, T. Ruppert, P. Albert, and R. Hollmann (2007), Cloud properties derived from GOME/ERS-2 backscatter data for trace gas retrieval, IEEE Trans. Geosci. Remote Sens., 45(9), 2747–2758.
Loyola, D. G., and M. Coldewey-Egbers (2012), Multi-sensor data merging with stacked neural networks for the creation of satellite long-term climate data records, EURASIP J. Adv. Signal Process., 2012, 91, doi:10.1186/1687-6180-2012-91.
Loyola, D. G., et al. (2011), The GOME-2 total column ozone product: Retrieval algorithm and ground-based validation, J. Geophys. Res., 116, D07302, doi:10.1029/2010JD014675.
Malicet, J., D. Daumont, J. Charbonnier, C. Parisse, A. Chakir, and J. Brion (1995), Ozone UV spectroscopy: II. Absorption cross-sections and temperature dependence, J. Atmos. Chem., 21, 263–273.
McPeters, R. D., G. J. Labow, and J. A. Logan (2007), Ozone climatological profiles for satellite retrieval algorithms, J. Geophys. Res., 112, D05308, doi:10.1029/2005JD006823.
McPeters, R. D., P. K. Bhartia, D. Haffner, G. J. Labow, and L. Flynn (2013), The version 8.6 SBUV ozone data record: An overview, J. Geophys. Res. Atmos., 118, 8032–8039, doi:10.1002/jgrd.50597.
Munro, R., M. Eisinger, C. Anderson, J. Callies, E. Corpaccioli, R. Lang, A. Lefebvre, Y. Livschitz, and Perez Albinana (2006), GOME-2 on METOP: From in-orbit verification to routine operations, EUMETSAT Meteorological Satellite Conference, Helsinki, Finland, 12–16 June.
Pastel, M., J.-P. Pommereau, F. Goutail, A. Richter, A. Pazmiño, D. Ionov, and T. Portafaix (2014), Construction of merged satellite total O3and NO2time series in the tropics for trend studies and evaluation by comparison to NDACC SAOZ measurements, Atmos. Meas. Tech., 7, 3337–3354, doi:10.5194/amt-7-3337-2014.
Pommereau, J.-P., and F. Goutail (1988), Ground-based measurements by visible spectrometry during Arctic Winter and Spring, Geophys. Res. Lett., 15, 891–894, doi:10.1029/GL015i008p00891.
Redondas, A., R. Evans, R. Stuebi, U. Köhler, and M. Weber (2014), Evaluation of the use offive laboratory-determined ozone absorption cross sections in Brewer and Dobson retrieval algorithms, Atmos. Chem. Phys., 14, 1635–1648, doi:10.5194/acp-14-1635-2014.
Scarnato, B., J. Staehelin, T. Peter, J. Gröbner, and R. Stübi (2009), Temperature and slant path effects in Dobson and Brewer total ozone measurements, J. Geophys. Res., 114, D24303, doi:10.1029/2009JD012349.
Spurr, R., V. Natraj, C. Lerot, M. Van Roozendael, and D. Loyola (2013), Linearization of the principal component analysis method for radiative transfer acceleration: Application to retrieval algorithms and sensitivity studies, J. Quant. Spectrosc. Radiat. Transfer, 125, 1–17, doi:10.1016/j.jqsrt.2013.04.002.
Staehelin, J., J. Kerr, R. Evans, and K. Vanicek (2003), Comparison of total ozone measurements of Dobson and Brewer spectrophotometers and recommended transfer functions, WMO TD No. 1147, No. 149, World Meteorol. Org., Global Atmosphere Watch. [Available at http:// www.wmo.ch/web/arep/reports/gaw149.pdf.]
Valks, P., D. Loyola, N. Hao, M. Rix, and S. Slijkhuis (2010), Algorithm theoretical basis document for GOME total column products of ozone, NO2, SO2, BrO, H2O, tropospheric NO2and cloud properties, DLR/GOME/ATBD/01, Iss./Rev. 2/C.
van der A, R. (2011), User requirement document, Issue 2.1, 21/11/2011, Reference: Ozone_cci_URD_2.1, Ozone-CCI. [Available at http:// www.esa-ozone-cci.org/?q=webfm_send/37, last accessed: 17.02.2015.]
Vanicek, K. (2006), Differences between ground Dobson, Brewer and satellite TOMS-8, GOME-WFDOAS total ozone observations at Hradec Kralove, Czech, Atmos. Chem. Phys., 6, 5163–5171, doi:10.5194/acp-6-5163-2006.
Van Roozendael, M., et al. (1998), Validation of ground-based visible measurements of total ozone by comparison with Dobson and Brewer spectrophotometers, J. Atmos. Chem., 29(1), 55–83.
Van Roozendael, M., et al. (2012), Sixteen years of GOME/ERS-2 total ozone data: The new direct-fitting GOME Data Processor (GDP) version 5 —algorithm description, J. Geophys. Res., 117, D03305, doi:10.1029/2011JD016471.
Ziemke, J. R., S. Chandra, G. J. Labow, P. K. Bhartia, L. Froidevaux, and J. C. Witte (2011), A global climatology of tropospheric and stratospheric ozone derived from Aura OMI and MLS measurements, Atmos. Chem. Phys., 11, 9237–9251.