HAL Id: hal-00304275
https://hal.archives-ouvertes.fr/hal-00304275
Submitted on 16 Jun 2008HAL is a multi-disciplinary open access
archive for the deposit and dissemination of sci-entific research documents, whether they are pub-lished or not. The documents may come from teaching and research institutions in France or abroad, or from public or private research centers.
L’archive ouverte pluridisciplinaire HAL, est destinée au dépôt et à la diffusion de documents scientifiques de niveau recherche, publiés ou non, émanant des établissements d’enseignement et de recherche français ou étrangers, des laboratoires publics ou privés.
Surface and boundary layer exchanges of volatile organic
compounds, nitrogen oxides and ozone during the
GABRIEL Campaign
L. Ganzeveld, G. Eerdekens, G. Feig, H. Fischer, H. Harder, R. Königstedt, D.
Kubistin, M. Martinez, F. X. Meixner, B. Scheeren, et al.
To cite this version:
L. Ganzeveld, G. Eerdekens, G. Feig, H. Fischer, H. Harder, et al.. Surface and boundary layer exchanges of volatile organic compounds, nitrogen oxides and ozone during the GABRIEL Campaign. Atmospheric Chemistry and Physics Discussions, European Geosciences Union, 2008, 8 (3), pp.11909-11965. �hal-00304275�
ACPD
8, 11909–11965, 2008
Reactive Trace Gas exchanges over Guyanas tropical forest L. Ganzeveld et al. Title Page Abstract Introduction Conclusions References Tables Figures ◭ ◮ ◭ ◮ Back Close
Full Screen / Esc
Printer-friendly Version
Interactive Discussion
Atmos. Chem. Phys. Discuss., 8, 11909–11965, 2008 www.atmos-chem-phys-discuss.net/8/11909/2008/ © Author(s) 2008. This work is distributed under the Creative Commons Attribution 3.0 License.
Atmospheric Chemistry and Physics Discussions
Surface and boundary layer exchanges of
volatile organic compounds, nitrogen
oxides and ozone during the GABRIEL
Campaign
L. Ganzeveld1,2, G. Eerdekens2,3, G. Feig2, H. Fischer2, H. Harder2, R.
K ¨onigstedt2, D. Kubistin2, M. Martinez2, F. X. Meixner2, B. Scheeren4, V. Sinha2, D. Taraborrelli2, J. Williams2, J. Vil `a-Guerau de Arellano1, and J. Lelieveld2 1
Department of Environmental Sciences, Wageningen University and Research Centre, Droevendaalsesteeg 4, 6708 PB, Wageningen, Netherlands
2
Department of Atmospheric Chemistry, Max-Plank Institute for Chemistry, Mainz, Germany
3
Research Group Plant and Vegetation Ecology, Department of Biology, University of Antwerp, Antwerp, Belgium
4
Joint Research Centre, Ispra, Italy
Received: 6 May 2008 – Accepted: 21 May 2008 – Published: 16 June 2008 Correspondence to: L. Ganzeveld (laurens.ganzeveld@wur.nl)
ACPD
8, 11909–11965, 2008
Reactive Trace Gas exchanges over Guyanas tropical forest L. Ganzeveld et al. Title Page Abstract Introduction Conclusions References Tables Figures ◭ ◮ ◭ ◮ Back Close
Full Screen / Esc
Printer-friendly Version
Interactive Discussion Abstract
We present an evaluation of sources, sinks and turbulent transport of nitrogen ox-ides, ozone and volatile organic compounds (VOC) in the boundary layer over French Guyana and Suriname during the October 2005 GABRIEL campaign by simulating observations with a single-column chemistry and climate model (SCM) along a zonal
5
transect. Simulated concentrations of O3 and NO as well as NO2 photolysis rates over the forest agree well with observations when a small soil-biogenic NO emission flux was applied. This suggests that the photochemical conditions observed during GABRIEL reflect a pristine tropical low-NOx regime. The SCM uses a compensation point approach to simulate nocturnal deposition and daytime emissions of acetone and
10
methanol and produces daytime boundary layer mixing ratios in reasonable agreement with observations. The area average isoprene emission flux, inferred from the observed isoprene mixing ratios and boundary layer height, is about half the flux simulated with commonly applied emission algorithms. The SCM nevertheless simulates too high isoprene mixing ratios, whereas hydroxyl concentrations are strongly underestimated
15
compared to observations, which can at least partly explain the discrepancy. Further-more, the model substantially overestimates the isoprene oxidation products methlyl vinyl ketone (MVK) and methacrolein (MACR) partly due to a simulated nocturnal in-crease due to isoprene oxidation. This inin-crease is most prominent in the residual layer whereas in the nocturnal inversion layer we simulate a decrease in MVK and MACR
20
mixing ratios, assuming efficient removal of MVK and MACR. Entrainment of residual layer air masses, which are enhanced in MVK and MACR and other isoprene oxida-tion products, into the growing boundary layer poses an addioxida-tional sink for OH which is thus not available for isoprene oxidation. Based on these findings, we suggest pursu-ing measurements of the tropical residual layer chemistry with a focus on the nocturnal
25
ACPD
8, 11909–11965, 2008
Reactive Trace Gas exchanges over Guyanas tropical forest L. Ganzeveld et al. Title Page Abstract Introduction Conclusions References Tables Figures ◭ ◮ ◭ ◮ Back Close
Full Screen / Esc
Printer-friendly Version
Interactive Discussion 1 Introduction
In October 2005 an intensive field campaign including ground-based and airborne mea-surements has been conducted over the Atlantic Ocean and French Guyana and Suri-name to study the atmospheric oxidizing capacity and role of atmosphere-biosphere exchanges in this region (Lelieveld et al., 2008). To interpret these observations it is
5
essential to assess the role of key precursors and controlling oxidation processes. This includes primary OH production, photolysis rates, water vapor and ozone, as well as the processes involved in the regeneration of OH and the influence of volatile organic compounds (VOCs), including methanol (CH3OH) and acetone (CH3COCH3). In ad-dition, a main sink of OH over the tropical forest is associated with the large biogenic
10
emissions of VOCs, mostly in the form of isoprene (C5H8), and this must be properly quantified. The lack of OH and HO2concentration measurements over tropical forests has until now posed a limitation in the interpretation of the various atmospheric chem-istry measurements. For example, evaluation of the exchanges of VOCs over the trop-ical forest close to Manaus, Brazil, measured during the LBA-CLAIRE2001 (Kuhn et
15
al., 2007) and TROFFEE campaigns (Karl et al., 2007), relied on indirect estimates of OH concentrations, whereas during GABRIEL the OH and HO2radical concentrations were measured directly (Lelieveld et al., 2008).
In the LBA (Large Scale Biosphere-Atmosphere Experiment in Amazonia) cam-paigns an important focus has been the measurement of atmosphere-biosphere
ex-20
changes of reactive trace gases and aerosols, deploying when possible flux measure-ment systems. Examples include the two LBA-EUSTACH intensive field campaigns (Andreae et al., 2002) at a primary rainforest and a pasture site in the state of Rondonia in southwestern Brazil conducting eddy correlation, gradient and enclosure measure-ments to study the exchanges of VOCs, nitrogen oxides (NOx=NO+NO2) and ozone.
25
Such direct flux measurements are not available for the GABRIEL campaign; however, through the combined use of observations and models of surface and boundary layer exchanges, empirical estimates can be made and key processes studied. In this study
ACPD
8, 11909–11965, 2008
Reactive Trace Gas exchanges over Guyanas tropical forest L. Ganzeveld et al. Title Page Abstract Introduction Conclusions References Tables Figures ◭ ◮ ◭ ◮ Back Close
Full Screen / Esc
Printer-friendly Version
Interactive Discussion
we apply the Single Column chemistry and climate Model ECHAM4 (SCM) (Ganzeveld et al., 2002a, 2004 and 2006b). The representation of the tropical forest exchanges of reactive trace gases in this model has been extensively evaluated by comparison with observations (Ganzeveld et al., 2002a; Kuhn et al., 2007). Here we apply the SCM to conduct an analysis of boundary layer VOCs, NOx and ozone exchanges over the
5
Guyana tropical forests with a particular emphasis on the role of daytime and noctur-nal turbulent transport. This focus is based on the hypothesis that interpretation of the late morning and afternoon observations of compounds with lifetimes of hours and longer, e.g., the oxygenated VOCs methanol and acetone, the isoprene oxidation prod-ucts methyl vinyl ketone (MVK), methacrolein (MACR), formaldehyde (HCHO), NOx
10
and O3, requires a critical assessment of the nocturnal and early morning turbulent transport regime in the stable boundary layer and overlaying residual layer.
This study with a focus on VOC, NOxand O3complements an analysis by Stickler et al. (2007) who compared results of chemical box simulations with the GABRIEL obser-vations focusing on carbon monoxide (CO), HCHO and hydrogen peroxide (H2O2). In
15
their analysis, which does not explicitly treat the role of turbulent mixing in the bound-ary layer (but includes the contribution by entrainment of free troposphere air masses), the role of HCHO, H2O2 and organic peroxides dry deposition has been addressed using dry deposition calculations of the SCM. Here we discuss in greater detail the dry deposition process as well as other relevant surface and boundary layer processes
in-20
cluding the role of soil moisture. This parameter is not only a key controlling factor in the boundary layer development and, consequently, tracer transport but it is also relevant, through its role in dry deposition and biogenic emissions, for atmospheric chemistry as encountered during GABRIEL.
One particular aim of the presented analysis is to use the observations to improve
25
particular features of the representation of surface and boundary layer reactive trace gas exchanges in atmospheric chemistry models. On the other hand, the model analy-sis provides complementary information required for the interpretation of the observa-tions through state-of-the-art simulaobserva-tions of processes and parameters which have not
ACPD
8, 11909–11965, 2008
Reactive Trace Gas exchanges over Guyanas tropical forest L. Ganzeveld et al. Title Page Abstract Introduction Conclusions References Tables Figures ◭ ◮ ◭ ◮ Back Close
Full Screen / Esc
Printer-friendly Version
Interactive Discussion
be measured.
Details about the SCM simulations relevant to the analysis are presented in Sect. 2, followed by an evaluation of the meteorological drivers of surface and boundary layer reactive trace gas exchanges in Sect. 3. The exchanges of methanol and acetone, NOx, ozone, isoprene and the oxidation products as well as an evaluation of the radical
5
chemistry simulations, including the potential role of reactive terpenes, are discussed in Sect. 4. This is followed by a discussion in Sect. 5 that in particular addresses the role of the nocturnal-, early morning transition- and daytime exchanges regimes, and Sect. 6 presents the conclusions.
2 Single-column chemistry and climate model 10
Our evaluation of the sources and sinks of reactive trace gases in the Guyana boundary layer is based on simulations conducted with the single-column version of the chemistry and climate model ECHAM4 (Ganzeveld et al., 2002a, 2006b). In the default set-up the SCM has 19 vertical layers (referred to as L19 version) set-up to 10 hPa with a Surface Layer (SL) depth of about 65 m and increasing depth of the layers aloft with
15
generally 5 layers representing the daytime convective boundary layer (BL) up to about 1500 m altitude. Prognostic variables are temperature, surface pressure, humidity and cloud water and the SCM contains parameterizations of radiation, cloud formation and precipitation, convection and vertical diffusion. Land surface processes are described by a 5-layer heat conductivity soil model and by a hydrological model. Over land, each
20
grid square is subdivided into 4 fractions to distinguish between snow coverage, bare soil, water in the skin reservoir and dry vegetation. The evapotranspiration for the latter fraction is calculated from the stomatal resistance (Sellers et al., 1986) as a function of surface radiation, soil moisture and Leaf Area Index (LAI).
One feature of the SCM is that it allows for an analysis of the response of the
me-25
teorology and atmospheric chemistry to changes in surface cover by advecting the column along a prescribed transect (Ganzeveld and Lelieveld, 2004). This approach
ACPD
8, 11909–11965, 2008
Reactive Trace Gas exchanges over Guyanas tropical forest L. Ganzeveld et al. Title Page Abstract Introduction Conclusions References Tables Figures ◭ ◮ ◭ ◮ Back Close
Full Screen / Esc
Printer-friendly Version
Interactive Discussion
is only valid if wind shear is minor, as indicated by small changes in wind speed and direction with altitude. The observations indeed indicate little wind shear within the planetary boundary layer (PBL) and lower free troposphere up to about 2 km altitude, which is the main domain of interest in this study. We study the atmospheric column processes during the ocean-land transition moving westward from the Atlantic Ocean,
5
northeast of South America, over the tropical forests of French Guyana and Suriname following the easterly October trade winds. We show the results of a simulation, mov-ing the column at 4.5◦N from its initial location at 45◦W to 60.0◦W, from 1 October, 21:00 LT (00:00 UT) and the subsequent 3 days using a time step of 60 s.
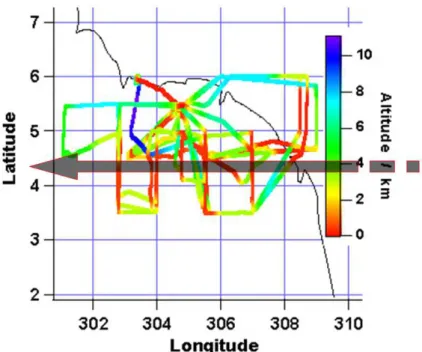
Figure 1 shows the selected transect and the GABRIEL campaign flight tracks. In
10
the simulation the air column moves with a mean speed of about 6.5 m s−1reflecting a marine atmospheric chemistry regime over the Atlantic Ocean for the first day (2 Oc-tober), reaching the coast of French Guyana around 05:00 LT during the second day (3 October) with the air mass composition then changing in response to the transport over the coastal region and the tropical forest inland. The simulation continues for one
15
more day (4 October) to also include a continental day-night-day transition to study the significance of the nocturnal tropical forest exchange regime for daytime atmospheric chemistry and exchanges. Note that the results for 4 October reflect simulations of the continental boundary layer development west of ∼57◦W whereas the observations are mostly confined to the domain east of this longitude (Fig. 1). Therefore, the comparison
20
of model simulations with observations focuses on the results for 3 October. The col-umn has been initialized with temperature, moisture and wind speed profiles simulated with the global ECHAM4 version, and tracer mixing ratios are initialized with vertical profiles from the chemistry and tracer transport model TM3 (Houweling et al., 1998) with some modifications to simulate vertical profiles over the ocean in close agreement
25
with the observations.
To ensure that the representation of meteorology is comparable to the actual con-ditions during GABRIEL, we have applied the ECMWF analyzed meteorology for 1 October, 2005, of the ECMWF model grid cell 4.5◦N and 45◦W, and nudge the
sim-ACPD
8, 11909–11965, 2008
Reactive Trace Gas exchanges over Guyanas tropical forest L. Ganzeveld et al. Title Page Abstract Introduction Conclusions References Tables Figures ◭ ◮ ◭ ◮ Back Close
Full Screen / Esc
Printer-friendly Version
Interactive Discussion
ulated meteorology over the ocean for the first 24 h of the simulation (Ganzeveld et al., 2006a). Surface properties such as the vegetation fraction and soil moisture are prescribed to the column along the transect based on a global ECHAM4 model simu-lation. These surface properties are complemented with vegetation cover parameters including LAI and surface roughness, being inferred from the Olson (1992) ecosystem
5
database and normalized differential vegetation index (NDVI) observations (Ganzeveld et al., 2002b). In contrast to a previous analysis of the impact of tropical deforesta-tion on the atmospheric chemistry applying the “big-leaf” approach (Ganzeveld and Lelieveld, 2004), we apply for this evaluation the detailed multi-layer model for reac-tive trace gas exchanges. This warrants the explicit simulation of the diurnal cycle in
10
atmosphere-biosphere exchange fluxes, leading to a peak in the biogenic NOx flux in the early morning associated with the nocturnal accumulation of NOxinside the canopy due to the continuous soil NO emissions.
The within-canopy and atmospheric gas-phase chemistry is based on an implemen-tation of the carbon bond mechanism version 4 (CBM4) according to Roelofs and
15
Lelieveld (2000). The scheme considers the standard background methane oxidation reactions, as well as non-methane hydrocarbons including isoprene (C5H8), a selection of hydrocarbon oxidation products such as aldehydes and ketones. It has been modi-fied to include the first-order contribution of the oxidation of terpenes, including ozonol-ysis, and oxidation products relevant to peroxide chemistry and exchanges (Ganzeveld
20
et al., 2006b). The results reflect, unless indicated differently, simulations with the SCM using the L19 model resolution also motivated by the fact that this resolution resem-bles that of the troposphere in the global chemistry-climate model ECHAM5/MESSy used to study in detail the contribution of long-range transport and isoprene oxidation chemistry (Butler et al., 2008). To additionally address the sensitivity of the simulated
25
trace gas mixing ratios to the model representation of turbulent transport we also in-clude model simulations using the ECMWF 60-layer model resolution (L60), with an SL depth of 10m and a lower 1500m domain representation by 13 instead of 5 layers.
ACPD
8, 11909–11965, 2008
Reactive Trace Gas exchanges over Guyanas tropical forest L. Ganzeveld et al. Title Page Abstract Introduction Conclusions References Tables Figures ◭ ◮ ◭ ◮ Back Close
Full Screen / Esc
Printer-friendly Version
Interactive Discussion 3 Evaluation of simulated Boundary Layer meteorology
Evaluation of various chemically reactive species with different sources and sinks and chemical lifetimes facilitates the testing of our understanding of processes involved in tropical boundary layer reactive trace gas exchanges. A prerequisite for a fair evalua-tion of the sources and sinks of reactive trace gases in the PBL is the representaevalua-tion
5
of micrometeorology, boundary layer evolution and turbulent transport. The SCM and the global climate model ECHAM4 (and ECHAM5/MESSy) often simulate a too shal-low boundary layer over tropical forests, especially during the wet season. One of the main reasons for the underestimation of the BL height is a misrepresentation of the surface energy balance for tropical forests (Ganzeveld et al., 2002a) with too much
10
energy being used for evapotranspiration resulting in a significant underestimation of the surface sensible heat flux. Possible explanations for a too large simulated tropical forest evapotranspiration include the model representation of stomatal exchange and convective rainfall interception (Dolman and Gregory, 1992) although it is beyond the scope of this study to address these aspects in detail.
15
For the analysis presented here, focusing on atmospheric chemistry, we have en-sured a realistic representation of the surface energy balance and BL depth by pre-scribing soil moisture such that the soil moisture stress function (Fws) has a value of
0.5. In the SCM (and also ECHAM4/5) this parameter describes the dependence of stomatal exchange (Sellers, 1986, 1989) on soil moisture and this imposed constraint
20
results in a simulated stomatal resistance twice as large the resistance for soil moisture at the field capacity. Unfortunately the actual soil moisture status and its impact on the surface energy and water vapor exchanges encountered during GABRIEL can not be evaluated by comparison with observations. However, for Fws=0.5 the simulated
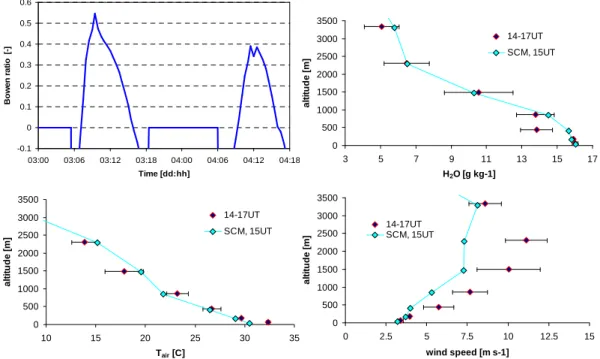
day-time median of the ratio of the sensible to latent heat flux, the so-called Bowen ratio,
25
which is shown in Fig. 2a for 3–4 October, of ∼0.15 is comparable to that observed in other tropical forest sites by da Rocha et al. (2004) (note that the daytime average is negative due to the large negative values in the early morning and late afternoon). In
ACPD
8, 11909–11965, 2008
Reactive Trace Gas exchanges over Guyanas tropical forest L. Ganzeveld et al. Title Page Abstract Introduction Conclusions References Tables Figures ◭ ◮ ◭ ◮ Back Close
Full Screen / Esc
Printer-friendly Version
Interactive Discussion
addition, the simulated maximum BL depth, which depends among other variables also on surface energy partitioning, of about 1400 m agrees well with the observed BL depth (∼1440 m). The latter has been inferred from observed virtual temperature profiles de-termining the first temperature inversion in those profiles going upward (Eerdekens et al., 2008) and is about ∼300 m deeper compared to the simulated BL height taking
5
Fws=1 (no soil moisture stress).
Despite the fact that GABRIEL was conducted during the dry season, meteorological observations indicate that the region was still relatively moist with daily rain showers subsequent to the development of shallow cumulus convection in the afternoon. The shallow cumulus clouds, with a cover ranging between 2/8–3/8, were generally present
10
between 1–3 km altitude and complicate inferring emission fluxes from observed mix-ing ratios in the BL as presented by Eerdekens et al. (2008). Actually the “observed” emissions include an uncertainty range that reflects the difference between the BL and a deeper mixed layer (ML). The virtual temperature profiles do not always show such an explicit inversion (indicated by a large jump in temperature, moisture and tracer
mix-15
ing ratios at the inversion zone) as is generally found at the top of clear sky boundary layers. The available moisture results in the occurrence of a conditionally unstable layer where shallow cumulus clouds form above the first virtual temperature inversion (BL height) in which tracer transport occurs thereby further decreasing the BL mixing ratios of emitted compounds. In order to assess the possible consequences of this
20
enhanced mixing mechanism for the inferred surface emissions we have estimated the ML depth based on BL height, cloud top height, cloud cover and lifetime of the chemical compound. With a cloud cover of 2/8–3/8 and an assumed maximum cloud top height of 3 km, the area- average ML depth is ∼1900 m, which actually agrees quite well with the area-average altitude of the observed second virtual temperature inversion. This
25
difference of ∼400 m between the ML and BL depth has been applied to estimate the uncertainty in the emission fluxes. Numerical analysis by Vil `a-Guerau de Arellano and van den Dries (2008) suggests that the significance of this enhanced upward trans-port in the conditionally unstable layer above the BL, and the uncertainty in inferred
ACPD
8, 11909–11965, 2008
Reactive Trace Gas exchanges over Guyanas tropical forest L. Ganzeveld et al. Title Page Abstract Introduction Conclusions References Tables Figures ◭ ◮ ◭ ◮ Back Close
Full Screen / Esc
Printer-friendly Version
Interactive Discussion
emissions, decreases with a decrease in lifetime of emitted species. Consequently, this enhanced mixing process is expected to be less relevant for isoprene compared to longer lived compounds such as methanol and acetone.
The SCM actually simulates the development of cumulus clouds, with a maximum cloud cover up to ∼4/8 but the cloud base is simulated to be around 3km altitude. The
5
consequences of this simulated representation of clouds for photolysis and convective transport are discussed in more detail in Sect. 4. Figure 2b shows a comparison of the observed average water vapor profile over land for 14:00–17:00 UT (11:00–14:00 LT), and the simulated profile for 3 October, 15:00 UT. The comparison shows that the model, with the imposed significant decrease in evapotranspiration, reproduces the
10
water vapor content in and above the BL generally well. The model also simulates the observed air temperature well, shown in Fig. 2c, with respect to the profile and the absolute values, although there is a difference between the maximum simulated and observed SL temperature of about 2 K. This might reflect a low-altitude measurement bias of conditions at and near the airport as well as a model discrepancy. A
compari-15
son of wind speed profiles, shown in Fig. 2d, indicated that the simulated surface wind speed was in good agreement with the observations suggesting that the role of turbu-lence in atmosphere-biosphere exchanges is represented well in the model. However, it can be clearly seen that the model simulates a too small increase in wind speed with altitude in the BL which points at a misrepresentation of momentum fluxes. This
un-20
derestimation of wind speed at the top of the BL has consequences for the simulated exchanges of trace gases between the BL and free troposphere. An indication about the accuracy of model simulated radiative fluxes, another driver of reactive trace gas exchanges and atmospheric chemistry, will be presented later in Sect. 4.2 since the radiation measurements were limited to the photolysis frequency of NO2(jNO2).
ACPD
8, 11909–11965, 2008
Reactive Trace Gas exchanges over Guyanas tropical forest L. Ganzeveld et al. Title Page Abstract Introduction Conclusions References Tables Figures ◭ ◮ ◭ ◮ Back Close
Full Screen / Esc
Printer-friendly Version
Interactive Discussion 4 Reactive trace gas exchanges
The observations indicate that the conditions for the photochemistry encountered dur-ing GABRIEL reflect the role of natural emissions with only occasional, local contribu-tions by anthropogenic and biomass burning emissions. Consequently, an interpreta-tion of the observed reactive trace gas concentrainterpreta-tions requires a thorough evaluainterpreta-tion
5
of natural sources, sinks and transport of precursors involved in the photochemistry over the forest in the Guyanas, which involves soil-biogenic NOxexchanges, biogenic emissions of VOCs and oxygenated species as well as dry deposition of species such as ozone and oxidation products.
As indicated above, the soil moisture has been modified in the SCM simulations for a
10
realistic representation of the boundary layer evolution. To evaluate the simulations of turbulent tracer transport in the BL and between the BL and the free troposphere (FT) we first present an evaluation of the methanol and acetone exchanges and concen-trations. An advantage of interpreting these compounds is that, due to their relatively long chemical lifetimes, chemical transformations do not play a significant role at the
15
timescale of BL turbulent transport. A major limiting aspect is the lack of knowledge about their biogenic sources and sinks. Probably the latter have been better quanti-fied for reactive nitrogen oxides and ozone. However, the exchange of NOx and O3 is also affected by chemical interactions including the reactive VOC species such as isoprene and terpenes, thus complicating the evaluation of BL turbulent transport of
20
these components.
4.1 Oxygenated compounds: methanol and acetone
Observations suggest that atmosphere-biosphere exchanges of the oxygenated com-pounds methanol and acetone are influenced by a canopy-scale compensation point (Ccomp) with upward or emission fluxes for surface layer concentrations smaller than
25
Ccomp and downward or dry deposition fluxes for surface layer concentrations larger than Ccomp. For example, observations above and within a Costa Rica tropical
for-ACPD
8, 11909–11965, 2008
Reactive Trace Gas exchanges over Guyanas tropical forest L. Ganzeveld et al. Title Page Abstract Introduction Conclusions References Tables Figures ◭ ◮ ◭ ◮ Back Close
Full Screen / Esc
Printer-friendly Version
Interactive Discussion
est by Karl et al. (2004) showed daytime emission fluxes for methanol and acetone of ∼2.6×10¹⁵molecules m−2s−1 and 1×10¹⁵
molecules m−2s−1, respectively, whereas the nocturnal gradient measurements indicated the presence of a canopy sink. As a possible explanation for this sink Karl et al. (2004) proposed deposition to leaves enhanced by the formation of dew. In contrast, Harley et al. (2007) conducted leaf
5
enclosure measurements that showed generally small or near zero nocturnal methanol emissions. During GABRIEL, no direct flux measurements were conducted although observed surface concentration changes at Brownsberg suggest a similar bi-directional exchange regime. The inferred daytime CH3OH and acetone emission fluxes for an observed BL height of ∼1400 m are ∼4.2×10¹⁵molecules m−2s−1 (0.80 mg CH3OH
10
m−2h−1) and ∼1×10¹⁵molecules m−2s−1 (0.35 mg Acetone m−2h−1), respectively (Eerdekens et al., 2008). Inferring the magnitude of the removal fluxes at night is unfortunately not possible because observations of the nocturnal turbulent mixing con-ditions at the Brownsberg site were not performed. The observed concentration de-creases suggest, similar to the observations by Karl et al. (2004), an efficient sink of
15
methanol and acetone possibly through surface deposition. However, a role of advec-tion in explaining the observed decreases in the concentraadvec-tions can not be excluded but if the sink would indeed be dominated by surface deposition, the inferred removal rate (assuming a nocturnal inversion layer of 200 m) is rather close to the turbulent limit suggesting a very efficient uptake at the surface.
20
A parameterization of biogenic methanol and acetone emissions, implemented in the dynamic global vegetation model (DGVM) ORCHIDEE, according to Lathi `ere et al. (2006), does not consider this compensation point and excludes the stomatal con-trol of emissions (see below). In this DGVM, emissions of methanol and acetone are simulated according to Guenther et al. (1995) from the foliar density (dm), an
25
ecosystem specific emission factor and surface temperature. However, using the ORCHIDEE methanol and acetone emission factor for tropical forests of 0.6 and 0.29 µgC gdm−1h−1, respectively, the SCM’s foliar density of about 1200–1300 g for the transect and the temperature attenuation function (based on Guenther et al., 1995), we
ACPD
8, 11909–11965, 2008
Reactive Trace Gas exchanges over Guyanas tropical forest L. Ganzeveld et al. Title Page Abstract Introduction Conclusions References Tables Figures ◭ ◮ ◭ ◮ Back Close
Full Screen / Esc
Printer-friendly Version
Interactive Discussion
simulate unrealistically high methanol and acetone surface layer mixing ratios. Includ-ing a correction factor for mature and old leaf methanol emissions (decrease by factor of 2), as assumed by Lathi `ere et al. (2006), still results in the simulation of maximum methanol mixing ratios in the middle of the BL up to 8 ppbv for 3 October and 15 ppbv for 4 October. These results are consistent with simulated CH3OH surface mixing
ra-5
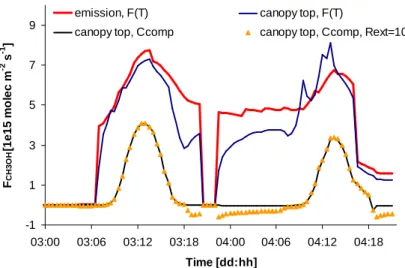
tios between 10 and 25 ppbv in the global chemistry-climate model LMDz-INCA which uses ORCHIDEE to simulate biogenic emissions (Folberth et al., 2006). In contrast, the maximum observed CH3OH mixing ratio during GABRIEL, at about 300 m altitude and higher, is ∼3 ppbv (Eerdekens et al., 2008). The simulated overestimation of CH3OH mixing ratios and increasing mixing ratios further inland also reflect a large nocturnal
10
accumulation due to continuous temperature dependent emissions in a shallow sta-ble boundary layer. This is illustrated in Fig. 3 which shows the simulated CH3OH emission over land and canopy top fluxes for 3–4 October. The simulated maximum CH3OH emission flux of about 8×10¹⁵molecules m−2s−1as well as the maximum ace-tone emission flux of 2.7×10¹⁵molecules m−2s−1 (not shown here), is a factor of ∼3
15
larger compared to the Karl et al. (2004) and GABRIEL observations. The maximum canopy top fluxes are even larger in the early morning of the second day reflecting the canopy release of methanol and acetone after accumulation within the canopy during the night. It is apparent that this parameterization, implemented in one of the more commonly applied DGVMs in global-scale analyses, does not simulate realistic mixing
20
ratios both in terms of magnitude and the diurnal cycle.
The multi-layer canopy model for reactive trace gas exchanges implemented in the SCM has previously been applied to study bi-directional atmosphere-biosphere NOx exchanges including the potentially important role of an NO2compensation point (Ganzeveld et al., 2002b). For the analysis presented here we apply the compensation
25
point approach to also simulate the bi-directional exchanges of acetone and methanol, including stomatal control. This is based on studies that focused on methanol emis-sions by H ¨uve et al. (2007) and Harley et al. (2007, and references therein) making the assumption that the controlling mechanism of biogenic acetone emissions is
sim-ACPD
8, 11909–11965, 2008
Reactive Trace Gas exchanges over Guyanas tropical forest L. Ganzeveld et al. Title Page Abstract Introduction Conclusions References Tables Figures ◭ ◮ ◭ ◮ Back Close
Full Screen / Esc
Printer-friendly Version
Interactive Discussion
ilar to that of methanol. The mechanism is actually considered in a leaf exchanges model, developed by Niinemets and Reichstein (2003), being constrained with enclo-sure observations to study the model performance in simulating methanol emissions for a selection of vegetation types (Harley et al., 2007). However, also due to a large uncertainty in key parameters, e.g., production rate as well as the lack of observations
5
of parameters to constrain the leaf exchanges model, we have applied a simplified ap-proach to study the role of the diurnal cycle in acetone and methanol exchanges over tropical forests. We prescribe a non-zero stomatal concentration (Cstomatal) in the SCM multi-layer exchange calculations such that we simulate a maximum daytime emission flux comparable to the observed fluxes. Including this stomatal control on CH3OH and
10
acetone exchange fluxes, the simulated nocturnal stomatal closure results in the sim-ulation of nocturnal removal determined by the turbulent and quasi-laminar transport to the surface and subsequent surface uptake. In the SCM (and ECHAM5/MESSy) dry deposition of gases, for which flux observations are hardly available, the surface uptake efficiency is estimated according to an approach by Wesely (1989) based on
15
solubility and reactivity, and scaled with the ozone and sulfur dioxide surface uptake resistances. Using a Henry coefficient of 2.2×10² and 30 M atm−1 for methanol and acetone, respectively, a medium reactivity for both components and Rl u=10
4
(Wesely, 1989; Walmsey and Wesely, 1996), nocturnal removal is estimated to be small also due to inferred large uptake resistances for the dry cuticle and wet skin fraction (wet
20
vegetation and soil due to rainfall interception or dewfall).
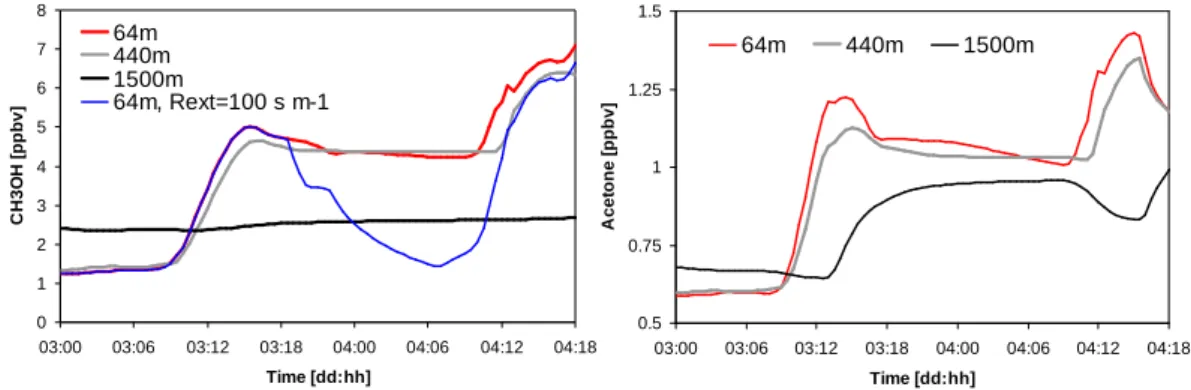
Figure 4 shows the simulated mixing ratios of methanol and acetone, respectively, for 3–4 October along the transect for the five layers that represent the Surface Layer (SL) up to the top of the BL around 1500 m. The difference in CH3OH mixing ratios be-tween the surface layer and those at 1500 m before sunrise at 3 October partly reflect
25
the used initial profiles, which are based on observed CH3OH mixing ratios over the Atlantic ocean, and simulated exchanges between the MBL and free troposphere for 1–2 October. The model simulates an increase after sunrise on 3 October from about 1.5 up to 4 ppbv CH3OH and from 0.6 to 1.25 ppbv acetone throughout the BL. These
ACPD
8, 11909–11965, 2008
Reactive Trace Gas exchanges over Guyanas tropical forest L. Ganzeveld et al. Title Page Abstract Introduction Conclusions References Tables Figures ◭ ◮ ◭ ◮ Back Close
Full Screen / Esc
Printer-friendly Version
Interactive Discussion
mixing ratios are slightly higher compared to observed mixing ratios which increase from ∼0.75 to ∼3 ppbv CH3OH and ∼0.4 to ∼1 ppbv acetone (Eerdekens et al., 2008) while the gradients compare well. The model simulates a further increase in mixing ra-tio as the column moves further inland also because the nocturnal mixing rara-tios show, in contrast to observations, only a relatively small decrease due to surface deposition.
5
Therefore, we have conducted an alternative simulation in which we have applied a significantly smaller nocturnal uptake resistance (Rext, mostly reflecting the uptake by the dry and wet cuticula) of 100 s m−1. The blue line in Fig. 4a shows a strong decrease in the nocturnal CH3OH mixing ratios, consistent with the observations at Brownsberg and those by Karl et al. (2004), though confined to the SL (and canopy, not shown here)
10
reflecting the suppressed turbulent transport between the canopy, SL and layers aloft. Although the model simulates a smaller emission flux for the second day over land (4 October), the increase in CH3OH mixing ratio is larger compared to the previous day also due to the entrainment of air masses from the residual layer with, according to the model, relative high CH3OH mixing ratios. This may point at a possible
misrepre-15
sentation of the nocturnal depletion in the residual layer. This feature will be further discussed after the evaluation of other components. For a more detailed comparison including a comparison of simulated and observed vertical mixing ratio profiles we refer to Eerdekens et al. (2008).
Finally, to indicate the possible decrease in the tropical forest source strength of
20
methanol and acetone according to the ORCHIDEE implementation, the integrated CH3OH and acetone canopy-top fluxes for the compensation point approach are about 80% smaller compared to the ORCHIDEE exchange fluxes due to the substantially smaller maximum daytime fluxes and small nocturnal deposition fluxes instead of emis-sions. This implies that, if these findings are representative for tropical forest, the global
25
biogenic emission budget for methanol and acetone of 106 and 42 TgC yr−1, as esti-mated by Lathi `ere et al. (2006), would be lower by about 25 (∼25%) and 16 (∼40%) TgC yr−1, respectively.
ACPD
8, 11909–11965, 2008
Reactive Trace Gas exchanges over Guyanas tropical forest L. Ganzeveld et al. Title Page Abstract Introduction Conclusions References Tables Figures ◭ ◮ ◭ ◮ Back Close
Full Screen / Esc
Printer-friendly Version
Interactive Discussion
4.2 Nitrogen oxides and ozone
The GABRIEL airborne observations include NO and O3concentrations and NO2 pho-tolysis rates. Surface observations are unfortunately not available which implies that evaluation of the boundary layer NOx-O3 relies on the comparison of the observed and simulated NO-O3 concentrations that reflect the modeled atmosphere-biosphere
5
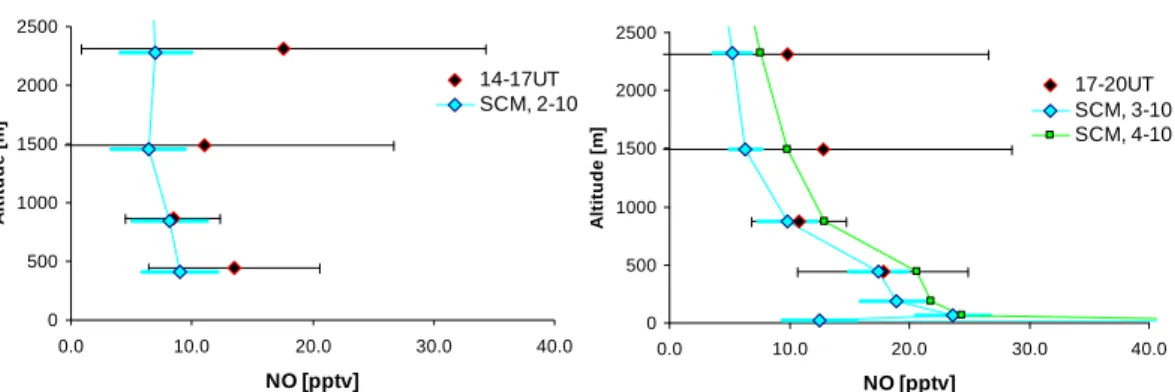
exchanges. The latter have been extensively evaluated earlier using the SCM in a di-rect comparison with observations of tropical forest exchanges (e.g., Ganzeveld et al., 2002a). Comparison of simulated and observed BL and free troposphere NO and O3 mixing ratios as well as the NO2photolysis rates should pose important constraints on the NOx-O3 photochemistry and transport processes. Figures 5a and b shows a
com-10
parison of the simulated and observed average NO mixing ratio profiles over the ocean (14:00–17:00 UT) and over land (17:00–20:00 UT) up, respectively, up to an altitude of 2.5 km. Occasional outliers in the observed NO mixing ratios up to more than 1 ppbv have been excluded since these likely reflect the role of anthropogenic emissions, most likely some localized pollution sources as indicated by simultaneously enhanced O3
15
mixing ratios. Figure 5b also shows the simulated profiles for 3–4 October to indicate the mixing ratio changes land inward. The comparison indicates that the model sim-ulates NO mixing ratio in the BL over land in good agreement with the observations whereas over the ocean the model simulates NO mixing ratios that are generally lower than observed. This discrepancy may be explained by a significant underestimation
20
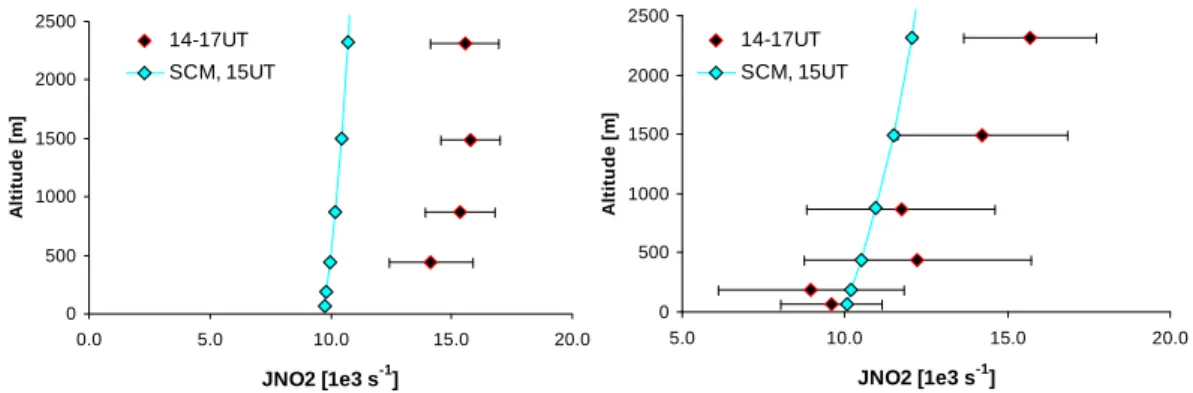
of the simulated jNO2(15:00 UT, 12:00 LT) over the ocean. Figure 6a shows that the observed average jNO2 in the lower 1 km for 14:00–17:00 UT as high as 15×10−3s−1 is about 30% larger compared to the simulated jNO2. The SCM’s jNO2actually resem-bles the jNO2 simulated with the chemistry-climate model ECHAM5/MESSy over the ocean near the equator for a clear-sky global radiation flux of ∼1000 W m−2, a flux also
25
simulated by the SCM for 2 October. This suggests that simulations of the photoly-sis with state-of-the-art models (ECHAM5-MESSy and the SCM use implementations based on the Landgraf and Crutzten 1998, scheme) over the tropical ocean
substan-ACPD
8, 11909–11965, 2008
Reactive Trace Gas exchanges over Guyanas tropical forest L. Ganzeveld et al. Title Page Abstract Introduction Conclusions References Tables Figures ◭ ◮ ◭ ◮ Back Close
Full Screen / Esc
Printer-friendly Version
Interactive Discussion
tially underestimate the photolysis of NO2, and possibly also the photolysis of other components, for yet unknown reasons. This may point to a role of aerosols in enhanc-ing photolysis rates which is considered in the SCM photolysis calculations, though in a rather rudimentary way using prescribed aerosol densities (4000 particles cm−3 in the MBL) and properties (MBL scattering optical thickness of ∼0.02). Figure 6b
indi-5
cates that there is actually good agreement between the observed and simulated jNO2 in the continental BL where the SCM captures the observed NO mixing ratio profiles well whereas the underestimation in the NO mixing ratios in the lower free troposphere is partly explained by an underestimation in the simulated jNO2. There are even more pronounced discrepancies higher up in the free troposphere between 2.5–6 km with a
10
simulated jNO2 being about 30% lower compared to the observations, which show an enhancement of jNO2 associated with shallow cumulus cloud cover and aerosols. The SCM does not simulate clouds in the lower free troposphere for 3 October whereas during 4 October significant cloud cover at about 3 km altitude results in a simulated maximum jNO2(∼17×10−3s−1), comparable to the observations above clouds.
15
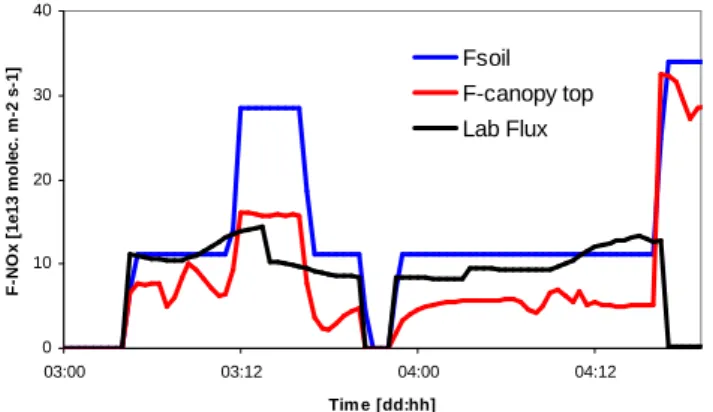
The simulated increase in NO mixing ratios from the coast to further inland reflects simulations of soil NO emissions from wet soils based on the Yienger and Levy (1995) algorithm with a constant (no temperature dependence for emission category rainfor-est) wet soil emission flux for most of the domain of about 2.6 ng m−2s−1 (in terms of mass nitrogen, 11.2×10¹³molecules m−2s−1). Along the transect a few areas with
agri-20
cultural activity and an area west of 59◦W with a savannah/grass cover have slightly larger soil NO emission fluxes compared to that of rainforest, as shown in Fig. 7.
During GABRIEL direct NO soil emission flux measurements were not made. How-ever, the simulated soil NO emission fluxes have been compared with laboratory mea-surements. These inferred soil NO fluxes were calculated using soil samples collected
25
in the rainforest near Brownsberg according to the method of van Dijk et al. (2002). Since soil diffusivity was not measured it was estimated according to Moldrup et al. (2000). The laboratory emission estimates were fitted as a function of soil mois-ture, in terms of Water filled Pore space (WFPS) and temperature according to the
ACPD
8, 11909–11965, 2008
Reactive Trace Gas exchanges over Guyanas tropical forest L. Ganzeveld et al. Title Page Abstract Introduction Conclusions References Tables Figures ◭ ◮ ◭ ◮ Back Close
Full Screen / Esc
Printer-friendly Version
Interactive Discussion
method of Meixner and Yang (2006). The soil water filled pore space (WFPS) was de-termined from the modeled gravimetric soil moisture according to the method of Parton et al. (2001). A Q10 temperature dependence of 1.95 was determined using the differ-ence in NO release between soils measured at 25◦C and at 35◦C during the peak of NO release (data not shown), which is within the range of the modeled soil temperatures.
5
The optimum soil moisture for NO emission was found to be 33.3% WFPS and at 25◦C the optimum NO flux was found to be 2.65 ng m−2s−1. To assess how this optimum emission flux compares to the simulated NO emission flux we have calculated the soil NO emission flux from the SCM’s WFPS and soil temperature using this laboratory measured dependency. It can be inferred from Fig. 7 that this laboratory based soil
10
NO emission flux, constrained with the SCM soil moisture and temperature, compares well to the simulated NO emission flux for the unperturbed tropical rainforest along the transect.
Figure 7 furthermore indicates the fraction of the soil NO emissions expected to be released into the atmosphere by also showing the canopy top NOx fluxes. Note that
15
zero emission fluxes during the night of 3–4 October reflect the simulated passage of the atmospheric column over lake Brokopondo. It can be inferred that, according to the multi-layer canopy model implementation in the SCM, generally about 50% or less of the soil emissions is released into the atmosphere, except for conditions dominated by savannah/grass cover (end of 4th October) with a much smaller Leaf Area Index (LAI)
20
compared to tropical forest, so that most of the emitted NOx can escape the canopy because the removal of NO2by dry deposition is much less than in forest conditions.
The previously discussed decrease in evapotranspiration does not only affect the simulated surface energy balance and BL depth but also the dry deposition of species being controlled by stomatal uptake, for example of ozone and NO2. The simulated
25
maximum ozone dry deposition canopy-top flux of about 3.5×10¹⁵molecules m−2s−1 is in good agreement with available observations over tropical forests in Brazil (Fan et al., 1990; Rummel et al, 2007). However, these observed fluxes reflect wet season con-ditions with observed daytime ozone mixing ratios of ∼10 ppbv compared to simulated
ACPD
8, 11909–11965, 2008
Reactive Trace Gas exchanges over Guyanas tropical forest L. Ganzeveld et al. Title Page Abstract Introduction Conclusions References Tables Figures ◭ ◮ ◭ ◮ Back Close
Full Screen / Esc
Printer-friendly Version
Interactive Discussion
and observed surface layer ozone mixing ratios of about 18 ppbv during GABRIEL. The maximum simulated ozone dry deposition velocity (VdO3) of 0.8 cm s−1, calculated from the canopy-top O3flux and surface layer mixing ratio, is substantially smaller compared to the maximum observed VdO3over tropical forest being as high as 2 cm s−1. However, the latter represents conditions without soil moisture stress and a large roughness
in-5
ducing a very efficient turbulent exchange. The maximum diagnostic VdO3for Fws=1 is
1.2 cm s−1. Evaluation of the role of O
3dry deposition relative to transport, mixing and chemical production or destruction relies on the comparison of simulated and observed O3mixing ratios during the transport of the air masses from the coast further inland.
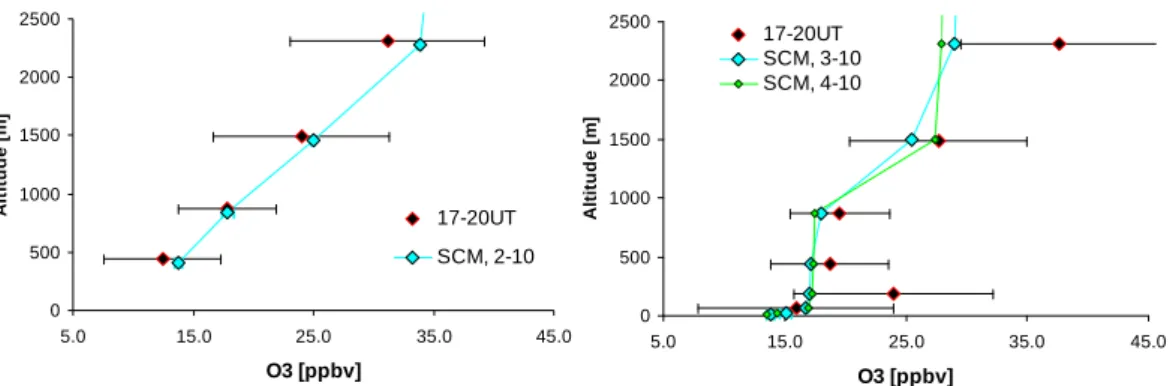
Figure 8 shows the vertical O3profile up to an altitude of 2.5 km over the ocean for
10
14:00–17:00 UT and over land for 17:00–20:00 UT, respectively. The good agreement between the simulated and observed profile over the ocean to a large extent reflects the selected initial vertical profiles with a relatively long lifetime due to small surface deposition and low NOx conditions. The model simulates a small increase in O3 of about 5 ppbv between the marine and continental BL. Interpretation of the profile over
15
land is difficult due to the limited number of observations below ∼300 m, also indicated by the large observed variability. Nevertheless, the simulated vertical profiles seem to be in good agreement with the observations from the surface to the BL top, clearly showing a profile that reflects the efficient surface removal by dry deposition. It is also interesting that changes in O3 between 3 and 4 October are small suggesting
20
equilibrium between BL sources and sinks.
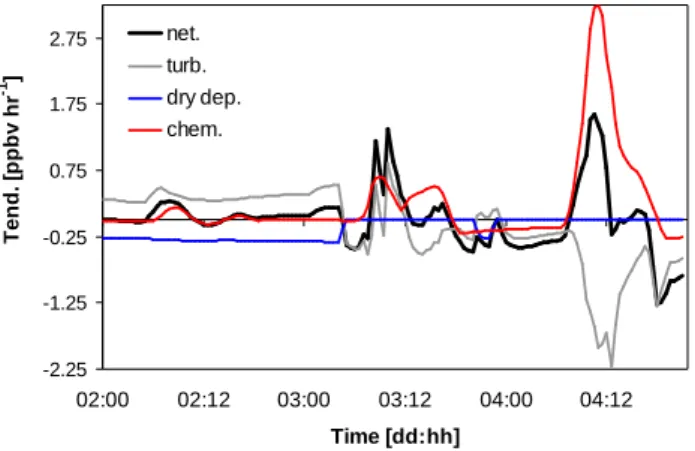
Interpretation of the process tendencies provides indications about the role of the various processes as shown in Fig. 9 for the surface layer for 2–4 October. For 2nd October during which air masses are transported over the Atlantic Ocean the main processes that control surface layer O3mixing ratios are oceanic dry deposition, with a
25
rather constant removal rate of ∼0.3 ppbv r−1, largely compensated by downward tur-bulent transport and a relative small chemical production in the morning. Over land the (surface layer) dry deposition tendency is negligible since the role of dry deposition is considered in the canopy layers. Over the canopy the net tendency is controlled
ACPD
8, 11909–11965, 2008
Reactive Trace Gas exchanges over Guyanas tropical forest L. Ganzeveld et al. Title Page Abstract Introduction Conclusions References Tables Figures ◭ ◮ ◭ ◮ Back Close
Full Screen / Esc
Printer-friendly Version
Interactive Discussion
by relatively large chemical production terms in the morning, with a maximum O3 pro-duction of 3 ppbv r−1 in the early hours of 4th October. This production is, however, partly compensated by turbulent transport resulting in a net increase of ∼2 ppbv h−1 in the early morning following the nocturnal depletion through transport into the canopy and the subsequent small dry deposition and chemical destruction. To put the net and
5
chemical tendencies into perspective, the daytime turbulent tendencies reflect the net change in surface layer O3 due to a large flux from aloft and a flux into the canopy where dry deposition provides an efficient sink with simulated maximum destruction rates of ∼20 ppbv h−1.
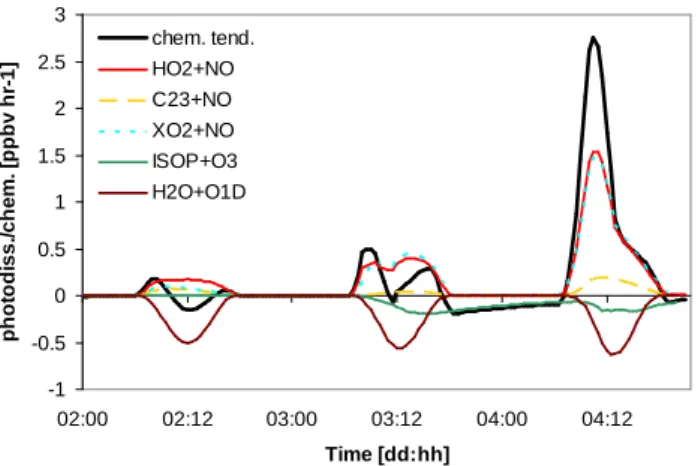
To interpret the nocturnal and morning chemical destruction and production
tenden-10
cies we show in Fig. 10 the net chemical tendency as well as the main reactions that contribute to the net tendency in the surface layer. It appears that the simulated noctur-nal O3 depletion can be attributed to isoprene oxidation whereas the relatively strong production of O3in the morning is mostly due to the NO-HO2and NO-XO2(NO to NO2 operator in chemistry scheme of SCM) reactions. This reflects especially the release of
15
NOx, which has accumulated within the canopy during the night, into the surface layer and the rapidly growing boundary layer. These features of O3chemistry and exchanges emphasize the importance of nocturnal and early morning atmosphere-biosphere ex-change processes to interpret and quantify daytime tropical atmospheric chemistry, in line with the previous discussion about methanol and acetone exchanges. The
reason-20
able agreement between observed and simulated NO and O3mixing ratios, continental photolysis rates in the BL and soil-biogenic NOxexchanges shows that the model sim-ulates key features of NOx and O3atmosphere-biosphere exchanges and evolution of and transport within the BL over the Guyana forests during GABRIEL.
4.3 Volatile organic compounds: Isoprene and oxidation products
25
Isoprene emitted by tropical forests provides a large source of reactive hydrocarbon precursor for tropical forest boundary layer chemistry. The subsequent oxidation of C H by OH, O and NO yields relatively short-lived carbonyls such as MVK, MACR,
ACPD
8, 11909–11965, 2008
Reactive Trace Gas exchanges over Guyanas tropical forest L. Ganzeveld et al. Title Page Abstract Introduction Conclusions References Tables Figures ◭ ◮ ◭ ◮ Back Close
Full Screen / Esc
Printer-friendly Version
Interactive Discussion
and further breakdown subsequently leads to formaldehyde (HCHO) and CO. Isoprene is also known to act as a potentially significant source of secondary organic aerosols (SOA) (e.g., Claeys et al., 2004; Kroll et al., 2006). A common problem of large-scale atmospheric chemistry models, as well as the SCM, is that simulations based on the commonly applied Guenther et al. (1995) emission algorithm generally result in a large
5
overestimation of the C5H8mixing ratios in the boundary layer over tropical forest (e.g., Houweling et al., 1998). Simulated maximum mixing ratios can exceed 10–15 ppbv compared to observations usually below ∼5 ppbv. Consequently, a commonly applied approach in global atmospheric chemistry studies is to use a substantially smaller flux, ranging from 220 to 350 TgC yr−1 (Brasseur et al., 1998; von Kuhlmann et al., 2004),
10
compared to 500 TgC yr−1according to Guenther et al. (1995). It appears that explain-ing the overestimation of tropical C5H8concentrations in models requires an approach integrating chemistry, micrometeorology and vertical transport all being partly responsi-ble. For example, von Kuhlmann et al. (2004) concluded that their model simulates too steep vertical C5H8gradients compared to observations collected during the
CLAIRE-15
1998 campaign (Warneke et al., 2001) over the Suriname tropical forest suggesting an underestimation of vertical transport.
We use the observations collected during GABRIEL to help constrain the represen-tation of various processes in our SCM. Figure 11 shows a comparison of the simulated C5H8emission fluxes using an implementation of the Guenther et al. (1995) emission
20
algorithm (hereafter G95) and the more recent MEGAN (Model of Emissions of Gases and Aerosols from Nature) (Guenther et al., 2006) algorithm for 3–4 October. The max-imum MEGAN emission fluxes of about 14 mg C5H8m−2h−1 are smaller compared to the G95 fluxes for 3 October whereas for 4th October, with lower net radiation com-pared to the previous day, emission fluxes by both algorithms are comparable. Note
25
that the algorithms differ in that the MEGAN basic emission factor (emission fluxes for a reference optimum temperature and radiation conditions) is a canopy-scale emission factor compared to the leaf-level emission factor of G95. However, since we explicitly calculate the role of canopy processes in our multi-layer exchanges model we have
ACPD
8, 11909–11965, 2008
Reactive Trace Gas exchanges over Guyanas tropical forest L. Ganzeveld et al. Title Page Abstract Introduction Conclusions References Tables Figures ◭ ◮ ◭ ◮ Back Close
Full Screen / Esc
Printer-friendly Version
Interactive Discussion
recalculated (using the foliar density in g m−2) the MEGAN emission factor to a leaf-level emission factor. The latter is used to calculate the emission flux in each canopy layer and from that the effective release of C5H8from the canopy to the atmosphere. The simulated canopy-top C5H8flux is generally 90% of the emission flux suggesting a relatively small decrease in the release of C5H8 due to within-canopy chemical
trans-5
formations and removal through soil uptake (Cleveland and Yavitt, 1997).
It can been inferred from Fig. 11 that the MEGAN simulated isoprene fluxes show a significant delay in the onset of the emissions after sunrise and they decrease more rapidly in the late afternoon compared to G95. The simulated MEGAN maximum and 09:00–17:00 UT average flux, of ∼14 and 10 mg isoprene m−2h−1, respectively, is a
10
factor ∼2 larger compared to the surface emission flux derived from observations of ∼7.3 mg C5H8m−2h−1. This flux has been inferred from the observed changes in the concentration of C5H8and main oxidation products including MVK, MACR and the BL height (Eerdekens et al., 2008). This factor 2 difference between the MEGAN and inferred emission fluxes is within the stated uncertainty in MEGAN isoprene emission
15
estimates of 50%.
For the evaluation of the BL mixing ratios of C5H8we applied an isoprene emission flux reduced by a factor 2 (hereafter referred to as Femisop=0.5). Figure 12 shows a com-parison of the simulated and observed C5H8mixing ratios up to an altitude of 2500 m for the Femisop=0.5 simulation for 3–4 October, 17:00–20:00 UT. The comparison indicates
20
reasonable agreement between the simulated and observed maximum mixing ratios in the middle of the BL (∼400–500 m) with observed mixing ratios ∼3 ppbv. The simulated relative decrease in mixing ratio for 4 October compared to 3 October resembles the decrease in simulated emission fluxes between the two days, shown in Fig. 11. The comparison also indicates, consistent with the findings by von Kuhlmann et al. (2004),
25
that the model simulates a larger decrease in the mixing ratios with altitude compared to the observed profiles (above the minimum flight altitude of ∼300 m) suggesting that the model underestimates the (turbulent) upward transport. Moreover, the observation of about 0.5 ppbv isoprene above the BL compared to a simulated mixing ratio close to
ACPD
8, 11909–11965, 2008
Reactive Trace Gas exchanges over Guyanas tropical forest L. Ganzeveld et al. Title Page Abstract Introduction Conclusions References Tables Figures ◭ ◮ ◭ ◮ Back Close
Full Screen / Esc
Printer-friendly Version
Interactive Discussion
zero suggests that convective transport to higher altitudes is underestimated.
Interpretation of the simulated mixing ratios for the two emission algorithms indicates that, in addition to the decrease in the emission flux by a factor 2, also the distinctly different diurnal cycle in C5H8 emission fluxes is relevant to the BL mixing ratios. To isolate the impact of different diurnal cycles between the G95 and MEGAN emission
5
fluxes on BL mixing ratios of C5H8 we have selected the emission factor such that the 3–4 October integrated emission flux using the G95 algorithm resembles the inte-grated flux of the Femisop=0.5 MEGAN emission flux simulation. Figure 13 shows the difference between the C5H8mixing ratios in the surface layer (SL) and the middle of the BL (∼440 m) simulated with the G95 and MEGAN emission algorithms (calculated
10
as G95-MEGAN), showing maximum differences of about 2 ppbv and 1 ppbv (relative to ∼5 ppbv and ∼3 ppbv) in the surface layer and middle of the BL, respectively. These differences, with a pronounced impact on long-term average mixing ratios (often used for the evaluation of large-scale chemistry models) occur in the early morning when suppressed turbulent mixing conditions result in a high sensitivity to the timing of the
15
onset of emissions. These findings demonstrate that evaluation of large-scale chem-istry models by comparison of surface or BL mixing ratios requires a careful analysis and consistent representation of temporal variability in surface sources and sinks as well as turbulent transport.
4.4 Oxidation products
20
4.4.1 Methyl vinyl ketone, methacrolein and formaldehyde
Evaluation of the isoprene chemistry over the Guyana forest involves compari-son of the simulated and observed oxidation products, methyl vinyl ketone (MVK), methacroleine (MACR) and formaldehyde (HCHO). Figure 14 shows a comparison of the vertical profile of the observed summed MVK and MACR mixing ratios over land for
25
17:00–20:00 UT and the simulated vertical profile for 3 and 4 October. The simulations reflect the Femisop=0.5 simulations with MEGAN. We obtain good agreement between
ACPD
8, 11909–11965, 2008
Reactive Trace Gas exchanges over Guyanas tropical forest L. Ganzeveld et al. Title Page Abstract Introduction Conclusions References Tables Figures ◭ ◮ ◭ ◮ Back Close
Full Screen / Esc
Printer-friendly Version
Interactive Discussion
the observed and simulated mixing ratios for 3 October although the model simulates a further increase in MVK+MACR mixing ratios with the air column being transported further inland. This increase reflects the combined effect of chemical production and loss, dilution through mixing and surface deposition, as indicated by the simulated mix-ing ratio gradient in the surface layer and canopy. Surface deposition is calculated
5
using the aforementioned approach by Wesely (1989) using estimated reactivities and Henry’s law coefficients similar to those used by von Kuhlmann et al. (2004) in a study of the sensitivity of the global isoprene budget to processes including deposition of ox-idation products. This results in simulated MVK and MACR dry deposition velocities (Vd) which are slightly smaller compared than those of O3 and SO2 (maximum
day-10
time Vd ∼1 cm s−1and nocturnal Vd ∼0.1 cm s−1). However, it should be noted that the
nighttime destruction by surface deposition does not result in a substantial nocturnal decrease in MVK+MACR mixing ratios. On the contrary, especially in the residual layer overlaying the inversion layer the model simulates a further increase in MVK+MACR mixing ratios associated with nocturnal isoprene destruction through its reaction with
15
O3. This results in maximum residual layer MVK+MACR mixing ratios up to 2 ppbv, which are entrained into the developing BL the next day.
Unfortunately the early morning observations in the residual layer during GABRIEL are too few to evaluate this feature of nocturnal accumulation of isoprene oxidation products in the residual layer. Observations by Warneke et al. (2001), which were
20
collected over Suriname in the LBA-CLAIRE 1998 campaign, show residual layer con-centrations of MVK+MACR of the order of 400 pptv, substantially smaller compared to the simulated residual layer mixing ratios. However, these observations were collected in March and April 2001 with the prevailing wind direction being northeast, in contrast to GABRIEL with the main wind direction being east to southeast, the latter resulting in
25
a substantially longer residence time of the sampled air masses over land than during LBA-CLAIRE1998. Surface observations of VOCs collected during LBA-CLAIRE1998 at a site about 1000 km further downwind and in-land at the site of Balbina, Brazil (Kesselmeier et al., 2000), show similarly small MVK+MACR mixing ratios. We have
ACPD
8, 11909–11965, 2008
Reactive Trace Gas exchanges over Guyanas tropical forest L. Ganzeveld et al. Title Page Abstract Introduction Conclusions References Tables Figures ◭ ◮ ◭ ◮ Back Close
Full Screen / Esc
Printer-friendly Version
Interactive Discussion
conducted an additional SCM simulation in which we have applied a substantially larger surface removal efficiency, assuming zero resistance against uptake by the dry and wet vegetation. Unsurprisingly, this simulation shows a very strong depletion of surface and canopy MVK+MACR mixing ratios but does not result in a substantial decrease in the residual layer mixing ratios simply because nocturnal turbulent transport is completely
5
suppressed in the SCM. This is a feature of all atmospheric chemistry models, while observations show that nocturnal intermittent transport events actually occur regularly. For example, observations by Fitzjarrald and Moore (1990) and Acevedo et al. (2006) provide evidence of the important role of nocturnal intermittent turbulent transport in tropical forest exchanges of energy, moisture and CO2. Fitzjarrald and Moore (1990)
10
postulated a mechanism to explain this intermittent exchange regime by the breakdown of the nighttime inversion through enhanced shear associated with the presence of a nocturnal jet. Such local-scale processes are not yet resolved in models, including our SCM, and we recommend further analysis that would ultimately result in the devel-opment of parameterizations of enhanced nocturnal mixing in atmospheric chemistry
15
models.
For another important isoprene oxidation product, HCHO, the simulations based on the uncorrected MEGAN C5H8emission flux yields BL mixing ratios in excess of 6 ppbv for 4 October, which is significantly higher compared to the observed HCHO mixing ra-tio. Figure 15 shows a comparison of observed and simulated HCHO mixing ratio
20
profiles for 3–4 October, 17:00–20:00 UT, applying the reduced MEGAN emission flux simulations. It can be clearly seen that the model overestimates HCHO mixing ratios in the lower 1000 m of the BL, whereas it underestimates the HCHO mixing ratios at the top of the BL and in the free troposphere. The underestimation above 1 km height is consistent with the misrepresentation of the C5H8mixing ratio profile discussed above.
25
It is likely related to the underestimation of convective mixing and isoprene and HCHO oxidation by OH. Furthermore, it is conceivable that the CBM4 higher hydrocarbon chemistry mechanism applied in our SCM may misrepresent isoprene chemistry for low-NOxconditions. The yield of formaldehyde from the lumping of hydrocarbons and
ACPD
8, 11909–11965, 2008
Reactive Trace Gas exchanges over Guyanas tropical forest L. Ganzeveld et al. Title Page Abstract Introduction Conclusions References Tables Figures ◭ ◮ ◭ ◮ Back Close
Full Screen / Esc
Printer-friendly Version
Interactive Discussion
reaction products may be overestimated, bearing in mind that CBM4 has been de-veloped and tested for higher-NOx conditions compared to those encountered during the GABRIEL campaign. The removal of HCHO by wet deposition is considered in the SCM although this seems to be only a small sink compared to that due to pho-tochemical loss and dry deposition. This is consistent with the actual meteorological
5
conditions encountered during GABRIEL with local precipitation events in deep con-vection approximately once every three days. For a more elaborate discussion on the role of dry deposition in explaining some of the discrepancies between observed and simulated HCHO mixing ratios in the BL we refer to Stickler et al. (2007).
To understand the increase in mixing ratios in the lower BL between 3 and 4 October,
10
similar to that shown for MVK+MACR, we show in Fig. 16 the simulated HCHO mixing ratios for this period up to 1500 m. The diagnostic BL height is also shown. It can be inferred from Fig. 16 that the model simulates a daytime increase in the BL mixing ratios reflecting daytime chemical production, turbulent (and convective) transport and dry deposition. However, it can also be inferred that there is a continuous nocturnal
15
source of HCHO through the oxidation of isoprene by ozone, which results in the ac-cumulation of HCHO in the residual layer, providing an additional source of HCHO in the early morning through the entrainment of these air masses into the growing BL. As mentioned earlier, this mechanism indicated by our SCM simulations cannot be directly tested by comparison with observations in the residual layer.
20
4.4.2 Hydroxyl and peroxy radicals
The preceding model evaluation of the various species observed during GABRIEL pro-vides insight in atmosphere-biosphere exchanges and the control of reactive species over the Guyana coastal region and tropical forest. To evaluate the modeled radi-cal chemistry we show in Fig. 17 a comparison of simulated and observed OH and
25
HO2 concentrations over land for 3–4 October for 14:00–17:00 LT. Clearly, despite the reasonable agreement between observed and simulated precursor concentrations involved in radical chemistry, the SCM significantly underestimates OH and HO
con-ACPD
8, 11909–11965, 2008
Reactive Trace Gas exchanges over Guyanas tropical forest L. Ganzeveld et al. Title Page Abstract Introduction Conclusions References Tables Figures ◭ ◮ ◭ ◮ Back Close
Full Screen / Esc
Printer-friendly Version
Interactive Discussion
centrations, in particular within the BL. The model partitioning of the OH reaction ten-dency indicates that the simulated main OH source is ozone photolysis followed by the production from HO2reacting with NO and O3. However, the previously presented agreement between observed and simulated H2O, O3and NO mixing ratios as well as photolysis rates in the BL suggests that this misrepresentation of OH in the BL can not
5
be explained in terms of these two predominant sources of OH. This points to either, a misrepresentation of the OH sink, which, according to our simulation, is dominated by the C5H8-OH reaction, or a missing source of OH. The evaluation of C5H8mixing ratio profiles has indicated that, despite the fact that the simulated mixing ratio in the middle of the BL agrees well with observations, the simulated vertical gradient is overestimated
10
with too high mixing ratios in the lower BL and an underestimation of C5H8higher up in the BL. However, the comparison reveals a bias between the observed and simulated OH concentrations that does not change much with height suggesting that misrepre-sentation of C5H8, in particular of the vertical profile, is not the only explanation of the strong underestimation of radical concentrations in the BL.
15
To assess the role of potential missing OH formation, we have conducted simula-tions to study the effect from a source of OH through terpene ozonolysis. This is also motivated by the role of these reactions in producing OH inside the canopy for day-time as well as nocturnal conditions (e.g., Faloona et al., 2001) and the fact that visible observations from the aircraft clearly indicated the presence of a haze layer. Since
20
biomass burning sources were not important for most of the campaign this haze prob-ably reflects the role likely results from the oxidation of biogenic precursor emissions (such as terpenes) in the formation of secondary organic aerosols (SOA). Furthermore monoterpenes were measured from the aircraft at mixing ratios of circa 10–20% of isoprene (Williams et al., 2007). Karl et al. (2007) stated that, based on an analysis
25
combining a photochemical box model and a mixed layer budget approach to study VOC exchanges over Amazonia, the large discrepancy between the simulated and in-ferred OH, could be explained by ozonolysis of sesquiterpenes with a mixing ratio of ∼1% of that of isoprene. Here we complement this analysis through explicit numerical