Publisher’s version / Version de l'éditeur:
Proceedings of the American Society for Testing and Materials, 61, pp.
1239-1249, 1962-06-01
READ THESE TERMS AND CONDITIONS CAREFULLY BEFORE USING THIS WEBSITE. https://nrc-publications.canada.ca/eng/copyright
Vous avez des questions? Nous pouvons vous aider. Pour communiquer directement avec un auteur, consultez la première page de la revue dans laquelle son article a été publié afin de trouver ses coordonnées. Si vous n’arrivez pas à les repérer, communiquez avec nous à PublicationsArchive-ArchivesPublications@nrc-cnrc.gc.ca.
Questions? Contact the NRC Publications Archive team at
PublicationsArchive-ArchivesPublications@nrc-cnrc.gc.ca. If you wish to email the authors directly, please see the first page of the publication for their contact information.
NRC Publications Archive
Archives des publications du CNRC
This publication could be one of several versions: author’s original, accepted manuscript or the publisher’s version. / La version de cette publication peut être l’une des suivantes : la version prépublication de l’auteur, la version acceptée du manuscrit ou la version de l’éditeur.
Access and use of this website and the material on it are subject to the Terms and Conditions set forth at
Some observations on the measurement of sensitivity of clays
Eden, W. J.; Kubota, J. K.
https://publications-cnrc.canada.ca/fra/droits
L’accès à ce site Web et l’utilisation de son contenu sont assujettis aux conditions présentées dans le site LISEZ CES CONDITIONS ATTENTIVEMENT AVANT D’UTILISER CE SITE WEB.
NRC Publications Record / Notice d'Archives des publications de CNRC:
https://nrc-publications.canada.ca/eng/view/object/?id=4aa2f23e-1ec4-457d-84b9-868ab1016618 https://publications-cnrc.canada.ca/fra/voir/objet/?id=4aa2f23e-1ec4-457d-84b9-868ab1016618
Ser
THl
N21r2
no. 157
c.2
BLDG
NATIONAL
RESEARCH
CANADACOUNCIL~,\A%~
DIVISION OF BUILDING RESEARCHSOME OBSERVATIONS ON THE MEASUREMENT O F
SENSITIVITY OF CLAYS
BY
W. J. EDEN AND J. K. KUBOTA
R E P R I N T E D FROM
PROCEEDINGS O F THE AMERICAN SOCIETY FOR TESTING AND MATERIALS VOL. 61, 1961, P. 1239
-
1249R E S E A R C H P A P E R NO. 157
P
O F T H Ez r - '
~ [ : C ) ~ I V I ION OF BUILDING RESEARCH.
. - , .1 i
OTTAWA JUNE 1962
T h i s publication i s being d i s t r i b u t e d by the Division of Building R e s e a r c h of the National R e s e a r c h Council. It should not be r e p r o d u c e d in whole o r in p a r t , without p e r m i s - sion of the o r i g i n a l publisher. The Division would be glad to be of a s s i s t a n c e in obtaining such p e r m i s s i o n .
Publications of the Division of Building R e s e a r c h may be obtained by mailing the appropriate r e m i t t a n c e , ( a Bank, E x p r e s s , o r P o s t Office Msney O r d e r o r a cheque m a d e pay- able at p a r in Ottawa, to the R e c e i v e r General of Canada, c r e d i t National R e s e a r c h Council) t o the National R e s e a r c h Council, Ottawa. Stamps a r e not acceptable.
A coupon s y s t e m h a s been introduced to make pay- ments for publications r e l a t i v e l y s i m p l e . C ~ u p o n s a r e avail- able in denominations of 5. 2 5 and 50 c e n t s , and m a y be ob- tained by making a r e m i t t a n c e a s indicated above. These coupons m a y be u s e d f o r the p u r c h a s e of a l l National R e s e a r c h Council p ~ b l i c a t i o n s including specifications of t h e Canadian Government Specifications Board.
Authorized Reprint from the Copyrighted P r o c c c d i ~ r g s of the
:\MER~C.\S S ~ C I E T Y FOR TESTIXG A S D XIATERIALS
Philndelphin, Pa. Volume 61, 1061
S O M E O B S E R V A T I O N S O N THE M E A S U R E X E N T O F S E N S I T I V I T Y O F C L A I r S *
Sensitivity is based on actual n~easurements of the undrained shear strength of a clay. I t should accordingly be a better criterion to describe soil properties than measures such as the liquidity index. No critical values of sensitivity have appeared, ho~vever, that nould distinguish a clay subject to earthflows from one that is not. I t may be that the present methods of measuring sensitivity lack the necessary precision.
In this paper, four methods of measuring sensitivity, the field vane, the unconfined compressio~l test, the laboratory vane, and the fall-cone test are described in some detail. X comparison is made betneen the results of the four methods in the light of observations nlade on a number of borings in Leda clay. The sensitivities ranged from 1 to over 300. I t was found that there was con- siderable discrepancy between the results obtained by the four methods.
Sensitivity i n soils is defined a s the ratio of the undisturbed strength t o the remolded strength a t t h c same water content. I t is usual t o report values of sensitivity along w i t h other geotechnical properties of clay. Suggestions h a v e been m a d e b y Skempton ancl N o r t h e y ( I ) ~ ancl ~ j e r r u m (2) to classify clays b y their sensitivity; B j e r r u m shows a general relationship between t h e liquidity index
LI =
'"
- P L ) ailcl t h e sensitivity.(
L L - P LAS y e t no critical ' values of sensitivity
h a v e appeared, t h a t would distinguish a clay sibject to flow slides from o n e t h a t
"
Presented a t the Sixty-fourth Annual 1Ieet- i ~ l g of tllc Society, June 25-30, 1961.Research Officer, Soil Mechanics Section, Division of Buildiug Iicscarch, National Rc- search Council, Ottawa, Canada.
2 Professor of Civil Engineering, Kobe Uni-
versity, Kobe, Japan. Visiting l>rofessor with the Division of Building Iiescarch, National Itcsearch Council. Ottawa, Canada, during t h e
is not. As sensitivity is based on actual measures of shear strength, logically i t should be a better criterion t o describe soil properties than t h e liquidity index. This m a y n o t be possible because of t h e wide variations of sensitivity i n a single clay profile, b u t the a u t h o r s suggest t h a t another reason m a y b e t h a t methods now used t o o b t a i n a measure of sensitivity lack t h e necessary precision.
Terzaghi a n d Peck (3) suggest t h a t sensitivity b e defined a s t h e ratio of t h e undisturbed unconfinecl compression strength to t h e remolded unconfined con~pressive strength a t t h e same w a t e r content. T h i s method is satisfactory for clays of relatively low sensitivities, b u t a s t h e liquidity index of t h e clay a p - proaches 1, i t is no longer possible t o form remolded specimens t h a t h a v e enough strength to b e self-supporting for a n unconfinecl compressio~l test.
summer of 1060.
3 T h e boldface numbers in parcnthcses refer T h u s for clays with high sensitivities,
t o tllc list of references apperldcd t o this Impcr. alternate means of lneasuring the sen- 1239
sitivity had to be sought. In the litera- ture, values of sensitivity are reported based on (1) field vane tests, (2) labora- tory vane tests, and (3) laboratory fall- cone tests.
Andresen and Bjerrum (4) report on
the measurement of sensitivity with the field vane test. Their method was to remold the soil by rotating the vane rapidly for 25 revolutions, then taking the remolded strength without allowing the rotation to stop. Their apparatus completely eliminates friction between the rods connecting the vane to the sur- face from the surrounding soil and can be rotated quite rapidly. Eden and Hamil-
ton (5) found that sensitivities measured
by another field vane were not reliable. With the latter apparatus, friction be- tween the soil and the rod was a signifi- cant factor in remolded strength deter- minations, and the vane was only rotated four times rather slowly to remold the
soil, and there was a delay of about 1
min between the completion of the re- molding and the start of the test. Even with the better quality equipment,
Andresen and Bjerrum (4) report that
the sensitivity values obtained with the field vane test are somewhat less than measured in the laboratory.
The laboratory vane test follows the same principle as that of the field vane test in that a 4bladed vane is inserted into a soil specimen, and the torque necessary to rotate the vane is measured and related to the undrained strength. I t has been used on both undisturbed and remolded clay samples to measure the sensitivity. I n practice, it can be used to measure sensitivity over a fairly wide range, but when the remolded strength becomes extremely small, it is difficult to measure torque with enough discrimina- tion to give reliable sensitivity values.
I n the fall-cone test, a cone of known weight and dimensions is brought into contact with the surface of the clay.
I t is released for about a 5-sec interval and allowed to penetrate the clay under its own weight. The penetration is then measured and if desired related to shear
strength as suggested by Hansbo (6) by
S, = (kQ)/(H2) where S , is shear
strength, Q the weight of the cone, H is
the penetration, and k a cone constant.
The test can be done on both undisturbed and remolded samples. The sensitivity is then defined by (Hz remolded)/(Hz undisturbed). The cone is useful over a limited range of sensitivity. For the un- disturbed test, the penetration should be at least 5 mm to be reliable. and if the remolded strength is very low, the cone buries itself in the soil.
Hansbo (6) reports that the sensitivity
as determined by the fall-cone test was taken simply as (H remolded),/(H un- disturbed) although this was not in full accordance with the definition of sen- sitivity.
In the present study, the four de- scribed methods of measuring sensitivity are compared. In addition, the sensitivity as measured by the ratio of one half the unconfined compressive strength to the remolded laboratory vane strength is compared with the first four methods.
To compare the results of the four test methods, the measured sensitivity from four borings in Leda clay in the Ottawa area are presented. All four borings are located within 20 miles of Ottawa so that the general description of the clay given
by Crawford (7) applies.
The first boring is located on the east- ern outskirts of Ottawa on the Montreal Road property of the National Research Council. The total depth of the clay a t this site is about 60 ft with a fissured crust extending to a depth of at least 30 ft. The surface elevation is about 310. The clay is extremely sensitive and highly stratified at depths below 40 ft.
The salt concentration of the pore water is less than I g per liter at this site.
The second boring was located about two miles east of the first boring on a lower terrace of the Leda clay. The sur- face elevation is about 180, and the depth of clay is about 120 ft. The pore water salt concentration a t this boring is from 5 to 13 g per liter, and the clay is much less sensitive than in the first boring.
The third boring is located on the same terrace as the second boring, but about one mile north near the bank of the Ottawa River. The salt concentration is less than 2 g per liter and the sensitivity much higher than in the second boring. The surface elevation is 175 and the clay extends to a depth of nearly 100 ft.
The final boring is located about 20 miles south of Ottawa near the village of Kars. The boring is situated beside the Rideau River. The clay extends to 50 ft, the top 20 ft being fissured. From 20 to 40 ft the clay has a very low salt con- centration and is extremely sensitive.
I n addition, some detailed tests were conducted on two block samples ob- tained from deep excavations in the city of Ottawa.
The test methods used to compute sensitivity, S t , are numbered 1 to 5 as follows:
Field Vane ilpparatus.-In three of
the four borings, the field vane manufac- tured by Geonor, Oslo, Norway, was used. This apparatus is described in
detail by Andresen and Bjerrum (4) and
their procedure was followed. The only modification was that where the un- disturbed strength exceeded 2000 lb per sq ft, a 43 by 86-mm vane was used in
place of the 55 by 110-mm vane. This
reduced the discrimination of the torque measuring equipment somewhat.
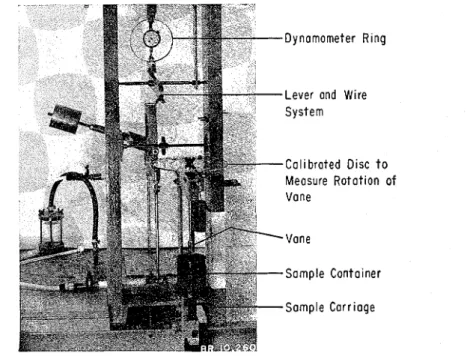
Laboratmy Vane Apparatus.-This
apparatus (Fig. I) was mounted on a Soiltest triaxial frame. The vane itself
was 12 by
2
in. and patterned after thatof Skempton and Bishop (8). The torque
was measured by a dynamometer ring acting through a lever system. The variable speed drive on the Soiltest triaxial frame was utilized to provide a nearly constant rate of rotation for the vane.
For the undisturbed test, a cylinder of soil, 2% in. in diameter by 3 in. long, was wrapped tightly in metal foil and sealed in wax to restrain the specimen laterally. The retainer was firmly seated in the bottom of the specimen. The top surface was cleaned, and the sample was thrust upwards so the vane was buried a t the middle of the specimen. Torque was ap-
half the unconfined compressive strength No. 1 St =
remolded laboratory vane strength unclisturbed laboratory vane strength No. 2 St =
remolded lalloratory vane strength (penetration of fall cone on remolded soil)? No. 3 St =
(penetration of fall cone on undisturbed soil)* undisturbed field vane strength
No. 4 St = -
remolded field vane strength
penetration of fall-cone on remolded soil No. 5 St =
plied so that the vane was turned a t about 6 deg per min. I t has been found that the method of wrapping and holding the specimens was satisfactory for soft clays. For firm and stiff clays, however, the insertion of the vane sometimes split the specimen; hence the undisturbed laboratory vane is generally restricted to use in soft clays. I11 these clays the
strength thus obtained generally agrees
capacity of 50 lb was used. I t was soon found that this ring did not give suf- ficient discrimination for remolded clays with a very low shear strength. A second special ring with a capacity of 15 lb was made, which could be inter- changed with the 50-lb ring. With this ring, it is possible to measure shear strengths as low as 0.02 psi.
Fall-Cone Apparatzts.-This \vas pur-
Dynamometer Ring
Lever and Wire System Calibrated Disc t o Measure Rotation of Vane Vane Sample Container Sample Carriage
FIG. 1.-Laboratory Vane Apparatus.
well with one half the unconfined com- pression strength.
After the undisturbed test, the speci- men was remolded thoroughly with a mechanical miser. T h e resulting slurry was deposited in a Lucite container 22 in. indiameter by 3 in. long. Thevane was thrust into the slurry to determine the remolded strength a t the same rate of strain as the undisturbed determination. A period of 1 min elapsed between the completion of the remolding process and the start of torque application.
At first, a dynamometer ring with a
chased from Geonor, Oslo, Norway. I t consists of a n instrument head mounted on a vertical arm free to be moved u p and down the arm by a rack and pinion arrangement. The cone is held in position by a small electromagnet. I t falls freely when t h e current supply to the electro- magnet is switched off. T h e penetration of the cone is measured by observing a scribed mark on the cone through a n optical scale.
Three cones were used with the ap- paratus regularly, a 30-deg cone weigh- ing 100 g, a 60-deg cone weighing 60 g
and a 60-deg cone weighing 10 g. The cone was substituted. T h e cone readings
choice of cone depends on the con- were then compared by Hansbo's equa-
sistency of the undisturbed sample. A tion:
penetration of a t least 5 mm was de- S, = ( k Q ) / ( H 2 ) . . . (1)
I
@
Best S t r a i g h t L ~ n e for Methad 2 I 6 7 Observations) 5 10 ZI + .- > .--
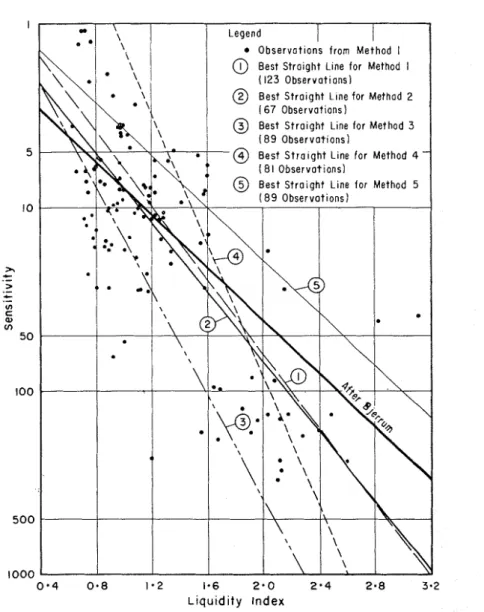
.- V) C a3 V) 50 100 500 1000 0.4 0.8 1.2 1.6 2.0 2.4 2.8 3.2 Liquidity IndexFIG. 2.-Relation Between Licluiditp Index and Sensitivity by Five Methods.
sirable to obtain a reasonable assessment The cone readings were repeated a t
of the strength. It was preferable t o use least three times for each determination
the same cone for the remolded strength to rule out effects of the cone encoun-
determination, but if penetration in the tering a sand grain or other obstruc-
Bjerrum (2) shows a logarithmic cor-
relation between sensitivity and liquidity indes. This correlation has been used for the comparison of the five methods of measuring sensitivity. Figure 2 shows the individual observations for method No. 1 along with the best straight lines for the other four methods. The correla-
Of the five methods shown in Fig. 2,
the laboratory vane and unconfii~ed methods (methods Nos. 2 and 1) present the best agreement with Bjerrum's relationship. If Bjerrum's correlation is valid for Leda clay, the field vane method
(No. 4) tends to underestimate the
sensitivity when the liquidity index is less than 1.5 and overestimate the
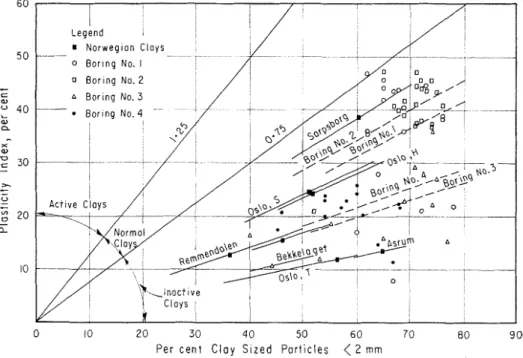
0 10 2 0 3 0 4 0 50 6 0 7 0 80 9 0
P e r c e n t C l o y S ~ z e d P o r t i c l e s
<
2 mmFIG. 3.-Activity Chart.
tion established by Bjerrum is also shown.
I11 general, the Leda clays appear to be more sensitive for the same liquidity index than the Norwegian clays. This may be because Leda clays generally have a higher plasticity index than the Norwegian clays, and hence, an excess water content over the liquid limit, say of
5 per cent, leads to higher values of
liquidity index in the case of the Nor- wegian clays. This feature is shown in Fig. 3, the activity chart comparing the two clays.
sensitivities a t high liquidity indices. The fall-cone test (method No. 3) ap- pears to overestimate the sensitivity of all liquidity indices, when square func- tions are used. If the ratio of penetration
readings are employed (method No, j),
then the sensitivity is underestimated. I t will be noted that the results pre- sented for the one test method are badly scattered. T h e results of the other four methods exhibit a similar scatter and
have not been shown on Fig. 2. The
scatter may be attributed t o the fact that neither the liquidity indices nor the
seilsitivity values are precise measure- ments.
The liquidity indices used in the cor- relation are the average values of a 2-ft layer of clay. The sensitivity measure- ments were made on samples repre- senting a t a masimum a 3-in. layer of clay. Thus the true liquidity index for the 3-in. layer could have been signifi- cantly different from the value obtained for a 2-ft layer. T o illustrate this point, in one sample of stratified clay the li- quidity index varied f r o n 1.3 to 2.3 in a
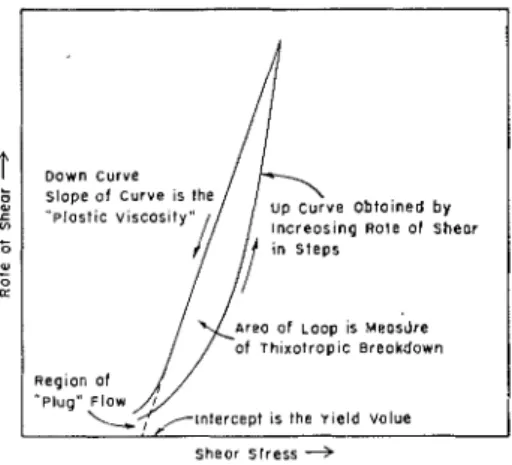
Down curve slope of curve is the
Increasing Rote of Shear
R;,$:
;Lw
11
L, /Intercept is the n e l d value Sheor Stress +
FIG. 4.-Consistency Curve for Thixotropic Plastic AIaterial. (:\fter Green (9).)
3-ft length, with the average being 2.0 for the total length. I n general, if the liquidity indes was high, larger variations could be expected.
All methods of measuring sensitivity suffer from lack of precision in deter- mining the remolded strength. This is especially true when the sensitivity is high, and it may be stated generally that the higher the sensitivity, the less relia- ble it is likely to be.
T h e question now arises as to t h e pre- ferred method of measuring sensitivity. For the purposes of this argument, it is assumed that all methods can be de-
pended upon to assess the undisturbed strength reliably. Thus the discussion will center around the application of the four test methods for measuring the remolded strength.
Since a clay slurry may be compared with paint or printing ink in consistency, it may be useful to examine t h e methods used to measure the viscous properties of paint. Green (9) has shown a consistency curve as determined b y a rotational viscometer for a thixotropic plastic suspension, the features of which are shown in Fig. 4. If shear stress is plotted against rate of shear, suspensions of this class will demonstrate a yield value, t h a t is, a measurable shear stress is necessary before any flow will take place. Once the yield stress is exceeded, flow will begin, and, as with all viscous materials, there is a relation between rate of shear a n d
shear stress. If the material is thixo-
tropic, then there is a hysteresis effect between ascending and descending rates of shear. Green (9) has suggested t h a t the area defined by the hysteresis loop is a measure of thisotropy. T h e hysteresis loop can be determined with a rotational viscometer a s described b y Green. I n a thixotropic material, the readings on the ascending run must be taken after a lapse of time to allow the set rate of shear to break down the thisotropic structure. For example, if the viscometer speed is set a t 10 rpm a t first a high shear strength will be measured which will de- crease with time to a minimum value as the thixotropic structure is broken down. When the minimum value has been reached and recorded, the viscometer can be set to the next higher rate of shear. A further breakdown with time will occur a t this higher rate of shear. The down curve is obtained without any influence from thixotropic breakdown.
At very low rates of shear, an ad- ditional complication is encountered, that of "plug flow." At slow angular
velocities, the material moves around the bob of the viscometer as the cup rotates as a body without shearing within itself. The shearing action occurs in a thin zone either next to the wall of the cup or the bob, and hence it is necessary to extrap- olate the down curve to obtain the yield value.
On a sample which had a sensitivity
about 200, two tests were conducted on the remolded clay with a high-speed
obtained. The speed was then increased to 40 rprn and the reading repeated.
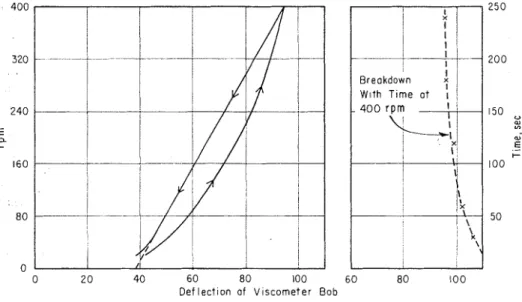
In steps of 20 rpm, the speed was in- creased to 400 rpm. After the 400-rpm reading was obtained, it was necessary to stop the rotation because the sample was heating up. After the sample had cooled to the bath temperature, the cup was rotated once more a t 400 rpm. A series of readings were taken to meas- ure the breakdown with time a t 400 rpm.
0
0 2 0 40 60 80 100 60 80 100
Def iection af Viscometer Bob
FIG. 5.-Consistency Curves for Viscometer Test on Sensitive Clay.
rotational viscometer. To prepare the specimens, the clay was remolded at its natural water content, then extruded through a 100 mesh screen to remove any sand particles which might influence the viscometer. The sample was then placed in the cup of the viscometer, the an- nular space between the bob and the cup being 2 mm. T o prevent the sample from drying out during the test, it was neces- sary to cover the specimen with a thin film of mineral oil.
The cup of the viscometer was rotated a t 20 rpm, this speed being maintained until the minimum stable reading was
TABLE I.-RESULTS OF ROTATIONAL VISCOMETER TESTS.
When the deflection reading equalled that previously established at 400 rpm, the speed was decreased in steps of 20
rpm. For run No. 5, the steps were
spaced 30 sec apart and number 6 run,
15 sec.
T e s t
Co;)cfi:2ct
viSCOsitY, Value, YieldPSI Remolded Laboratory Vane S t r e n ~ t h , PSI
T h e results of one viscometer run is action of the viscometer. T h e remolding
presented in Fig. 5 along with the break- process is completed a t a relatively high
down with time a t 400 rpm. I t nil1 be rate of shear, then readings are taken a t
apparent that the shape of curve ob- a much lower rate of shear without a
tained for the clay slurry resemble that period of rest between remoldiilg and
of Green's hypothetical curve. Table I reading. I t is also believed that remolding
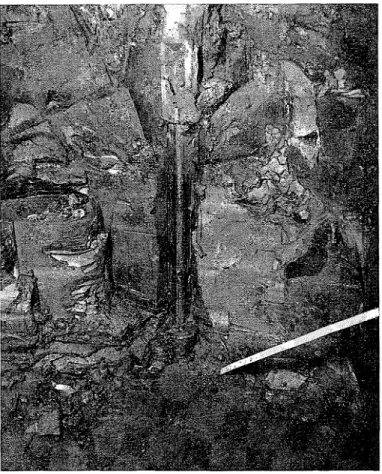
FIG. 6.-Remolcled Surface Fornietl in Field Vane Test.
compares the values derived from the viscometer test in relation to the labo- ratory vane tests on the same remolded sample.
Considering now the methods of measuring remolded strength to derive their sensitivity, it may be argued that the field vane most closely duplicates the
action produces only a thin remolded surface to the order of 1 or 2 mm. This
feature is illustrated in Fig. 6 which
sho~vs the surface of rupture around the
field vane after a remolded test. T h e cylinder of soil retained in the blades of the vane in this instance ~ v a s relatively undisturbed.
Another factor which m a y influence the field vane test is the pore water
pressure and the rate with which it dissipates. Any loss of water during the remolding process because of drainage would lead to the remolded strength being too high.
With the laboratory vane test, the remolded clay is prepared in a container with a diameter much larger than that of the vane. With the more sensitive soils, the remolded clay is in a semi-fluid or fluid state. Under these conditions. i t is questionable whether the shearing surface formed in the clay slurry is the cylinder conforming to the shape of the vane. If the soil tends to be thixotropic, the laboratory vane will yield too high a result because there is no breakdown process and the readings are taken during the ascending leg of the hysteresis loop. As Fig. 2 has shown, the fall-cone test consistently yielded higher sensitivity values than the other test methods when the values of sensitivity were taken as (Hz remolded)/(H2 undisturbed). Hansbo has pointed out that for the same cone, the k value in S, = (kQ)/(H2) is different for undisturbed and remolded clays. For example, considering the 60- deg, 60-g cone, k for undisturbed clay was approximately 0.25 for one type sampler and 0.20 for another. For re- molded clay, the k for the 60-deg cone was about 0.30. Thus, in view of Hansbo's work, the simple comparison of the un- disturbed and remolded cone penetra- tions can be expected to yield too high values of sensitivity.
If any conclusion can be drawn from
this study, it is that the present methods of measuring sensitivity cannot be ex- pected to yield consistent results. Not much significance can be attached to a single sensitivity measurement.
Factors that contribute to the rather poor results obtained a t :
1. Insuflicient sensitivity in apparatus for measuring the remolded strength, 2. Time interval between the com- pletion of the remolding process and the start of the remolded strength deter- mination, particularly in clays which are thixotropic, and
3. Whether or not the test is con- ducted with ascending or descending rates of shear.
The study has shown t h a t no one method is to be preferred for the deter- mination of the sensitivity. The field vane method is probably the most economical method, h u t it appears to underestimate sensitivity a t low liquidity indices and overestimate it when the liquidity index is high. T h e fall-cone test is the most convenient and economical of the laboratory methods. The inter- pretation of the results of this test is open
to doubt. If the function (H2 remolded)/
(P
undisturbed) is used as sensitivity,the results resented indicate that the
sensitivities are higher than obtained
with other methods. If ( H remolded)/
( H undisturbed) is used for the sensi- tivity the results are lower than obtained by the other methods.
I t would appear that the Leda clays studied are slightly more sensitive for the same liquidity index than the relation suggested by Bjerrum.
I n spite of the more or less negative findings resulting from this study, i t is hoped t h a t this paper will have made some contribution to the problem of measuring sensitivity and will assist in an appreciation of the sensitivities re- ported in the literature of soil mechanics.
This paper is a contribution of the Division of Building Research, National
Research Council of Canada, and is
published with the approval of the Director of the Division.
(1) A. W. Skempton and R. D. Northey, "The Sensitivity of Clays," C&olecli)~iq~re, Vol. 3, No. 1, pp. 30-53 (1952).
(2) I,. Bjerrum, "Geotechnical Properties of Norwegian Marine Clays," Ge'olech?~ique, Vol. 4, No. 2, pp. 49-69 (1954).
(3) K. Terzaghi and K. B. Peck, "Soil Me- chanics in Engineering Practice." John Wile), and Sons, Inc., New York, N. 3'.
(1948).
(4) -A. Andresen and L. Bjerrum, "Vane Testing in Norway," Symposium on Vane Shear Testing of Soils, A S T M STY N o . 193, Am. Soc. Testing Mats., pp. 54-60 (1956). (5) W. J. Eden and J. J. Hamilton, "Use of a Field Vane Apparatus in Sensitive Clay," Symposium on Vane Shear Testing of Soils,
A S T S I S T P N o . 193, Am. Soc. Testing
Mats., pp. 41-53 (1956).
(6) S. Hansbo, "A New r\pproach to the Deter- mination of the Strength of Clay by the Fall-Cone Test," Yroceediltgs, No. 14, Iioyal Swedish Geotechilical Institute, Stockholn~ (1957).
(7) C. B. Crawford, "Engineering Studies on the Leda Clay," Soils in Canada, Royal Society of Canada, Special Publications No. 3, University of Toronto Press, Toronto (1961).
(8) A. W. Skempton and A. W. Bishop, "Soils," Chapter 10 of "Builtling 1,Iaterials-Their Elasticity and Inelasticity," edited by M.
Reiner,North-Holland Puhlishing Company, Amsterdam (1954).
(9) H. Green, "Industrial Rheology and Rheo- logical Structures," John Wiley and Sons, Inc., New York, N. Y . (1949).